The Closer: Housing Getting Silly, Carry & Roll — 10/17/18
Log-in here if you’re a member with access to the Closer.
Looking for deeper insight on markets? In tonight’s Closer sent to Bespoke Institutional clients, we take a look at some market developments in the US including breadth, real yields, and the term structure of volatility markets. We also dive into housing data updated today by the US Census, the extreme valuation levels for homebuilders, and some observations from fixed income.

See today’s post-market Closer and everything else Bespoke publishes by starting a 14-day free trial to Bespoke Institutional today!
UK Inflation Continues to Cool
As we discussed in our Morning Lineup, early this morning the UK’s Office for National Statistics released its September inflation data. Overall, the report was somewhat mixed with consumer measures missing while PPI rose. Headline and core HICP came in at 2.4% YoY and 1.9%, respectively. These are both below estimates and the prior period’s reading. The other measure of consumer inflation, RPI (Retail Price Index), was expected to come inline with last month but this too fell to 3.3% YoY. On a MoM seasonally adjusted basis, consumer inflation fell to one of its lowest levels in the past few years as shown in the charts below. This shows the general inflation picture is settling down, but politics surrounding Brexit can have an impact down the road.
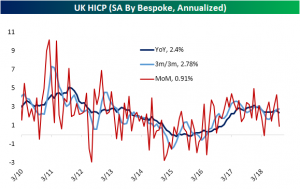
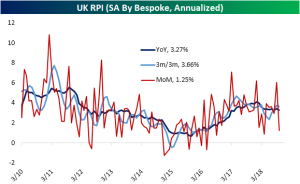
In the period following the Brexit referendum in 2016, consumer inflation ratcheted upwards for both HICP and RPI, both thanks to the collapse in GBP being passed along to consumers. Since Brexit negotiations between the EU and UK began in 2017, we have seen this trend begin to cool as the pound has stabilized, and this most recent release confirms this slowdown. The main concern is that these negotiations will not bear fruit resulting in a “no-deal” Brexit without a settlement on several hot-button issues like the North Ireland border and customs/trade plans. We generally expect the UK to avoid a “hard” Brexit and reach some sort of customs agreement with the EU, so inflation is likely to be less of a headache for the BoE going forward than it has been in recent years. Of course, a failure of negotiations ahead of the mid-March exit of the UK would mean all bets are off; that’s one reason to expect little policy change from the BoE over the next few months.
Russia and India On Separate Ends of the Spectrum
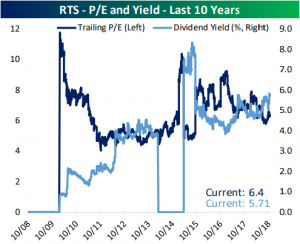
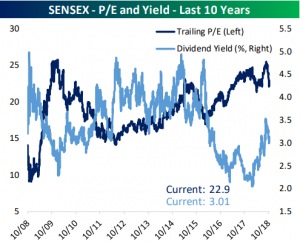
Our Global Macro Dashboard highlights the states of 23 major global economies. Below we show a comparison between each of these 23 countries’ P/E ratio and dividend yields. Russia is a standout at the extremes in regards to both measures. Russia has the lowest valuation among all of these countries at 6.4x trailing P/E, but at the same time, it boasts a substantially higher dividend yield of 5.7% (of course, these are related). The next highest dividend yield is over 1% lower with Singapore’s 4.6%. India, on the other hand, is basically the opposite. India has seen explosive growth (8.2% YoY GDP), and it is showing through the second highest valuation at 22.9x. The dividend yield lags behind all other countries at a mere 1.31%. The United States is in a similar boat to India with high valuations, but small dividends compared to the rest of the world.
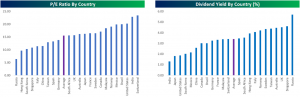
It is worth noting that Russia’s P/E has been trending downwards in recent years. Additionally, even though the current dividend yield is high, it was briefly much higher back in 2014 & 2015.
India has a similar trend with its dividend yields. Up until about 2015, it too had a much greater dividend yield which fell over the past few years, but it has seen a recovery.
Fixed Income Weekly – 10/17/18
Searching for ways to better understand the fixed income space or looking for actionable ideals in this asset class? Bespoke’s Fixed Income Weekly provides an update on rates and credit every Wednesday. We start off with a fresh piece of analysis driven by what’s in the headlines or driving the market in a given week. We then provide charts of how US Treasury futures and rates are trading, before moving on to a summary of recent fixed income ETF performance, short-term interest rates including money market funds, and a trade idea. We summarize changes and recent developments for a variety of yield curves (UST, bund, Eurodollar, US breakeven inflation and Bespoke’s Global Yield Curve) before finishing with a review of recent UST yield curve changes, spread changes for major credit products and international bonds, and 1 year return profiles for a cross section of the fixed income world.
This week we look at Uber’s new high yield bond offering.

Our Fixed Income Weekly helps investors stay on top of fixed income markets and gain new perspective on the developments in interest rates. You can sign up for a Bespoke research trial below to see this week’s report and everything else Bespoke publishes free for the next two weeks!
Click here and start a 14-day free trial to Bespoke Institutional to see our newest Fixed Income Weekly now!
Chart of the Day – Strong Breadth Isn’t What it Used to Be
Bespoke’s Global Macro Dashboard — 10/17/18
Bespoke’s Global Macro Dashboard is a high-level summary of 22 major economies from around the world. For each country, we provide charts of local equity market prices, relative performance versus global equities, price to earnings ratios, dividend yields, economic growth, unemployment, retail sales and industrial production growth, inflation, money supply, spot FX performance versus the dollar, policy rate, and ten year local government bond yield interest rates. The report is intended as a tool for both reference and idea generation. It’s clients’ first stop for basic background info on how a given economy is performing, and what issues are driving the narrative for that economy. The dashboard helps you get up to speed on and keep track of the basics for the most important economies around the world, informing starting points for further research and risk management. It’s published weekly every Wednesday at the Bespoke Institutional membership level.
You can access our Global Macro Dashboard by starting a 14-day free trial to Bespoke Institutional now!

Morning Lineup – Not a Lot of Follow-Through
Just like that, is everything all better with the market? While it may seem that way after yesterday’s big gain, there’s not much follow-through today as futures are lower. The only pocket of strength is in the Nasdaq where futures are indicated modestly higher on the heels of strong earnings results from Netflix (NFLX). Housing Starts and Building Permits were just released, and both came in modestly weaker than forecast.
Yesterday really was a pretty impressive day in terms of market breadth as the S&P 500’s A/D line was the strongest since March. More impressive, was the fact that every component of the Dow Industrials, Transports, and Utilities indices traded higher on the day. That type of breadth is something we haven’t seen since the Monday before the 2016 Presidential election! Years ago before ETFs started to dominate the market, that type event where every Dow Industrial, Transport, and Utility component traded higher on the day, was pretty monumental in the market.
Nowadays, though, it isn’t quite as impressive a feat. As shown in the chart below, there have been over 50 prior occurrences since the lows of the financial crisis in March 2009. Looking at where they occurred in various stages of the market shows no clear pattern of similar moves indicating a notable trough or peak.

Start a two-week free trial to Bespoke Premium to see today’s full Morning Lineup report. You’ll receive it in your inbox each morning an hour before the open to get your trading day started.

And Then We Bounced…
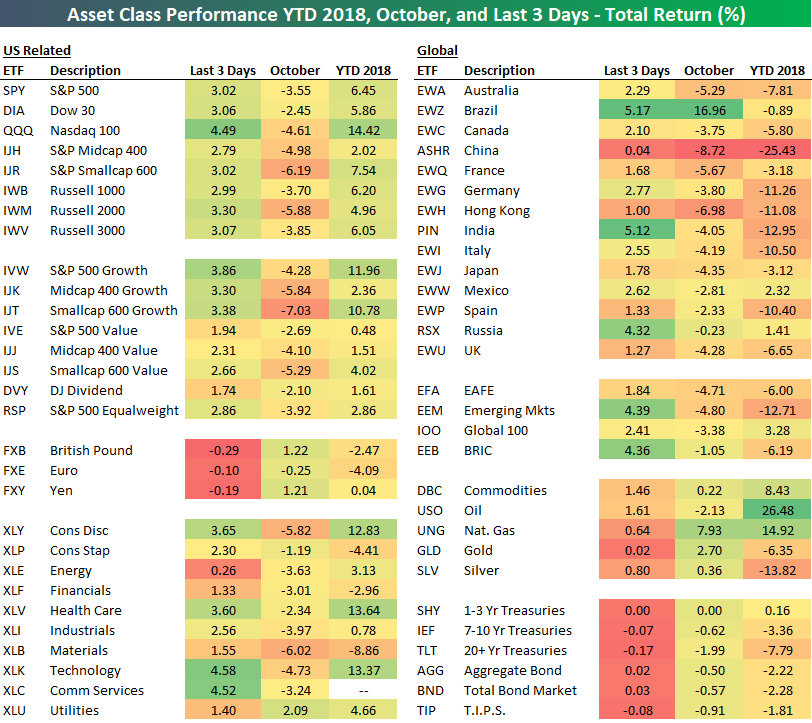
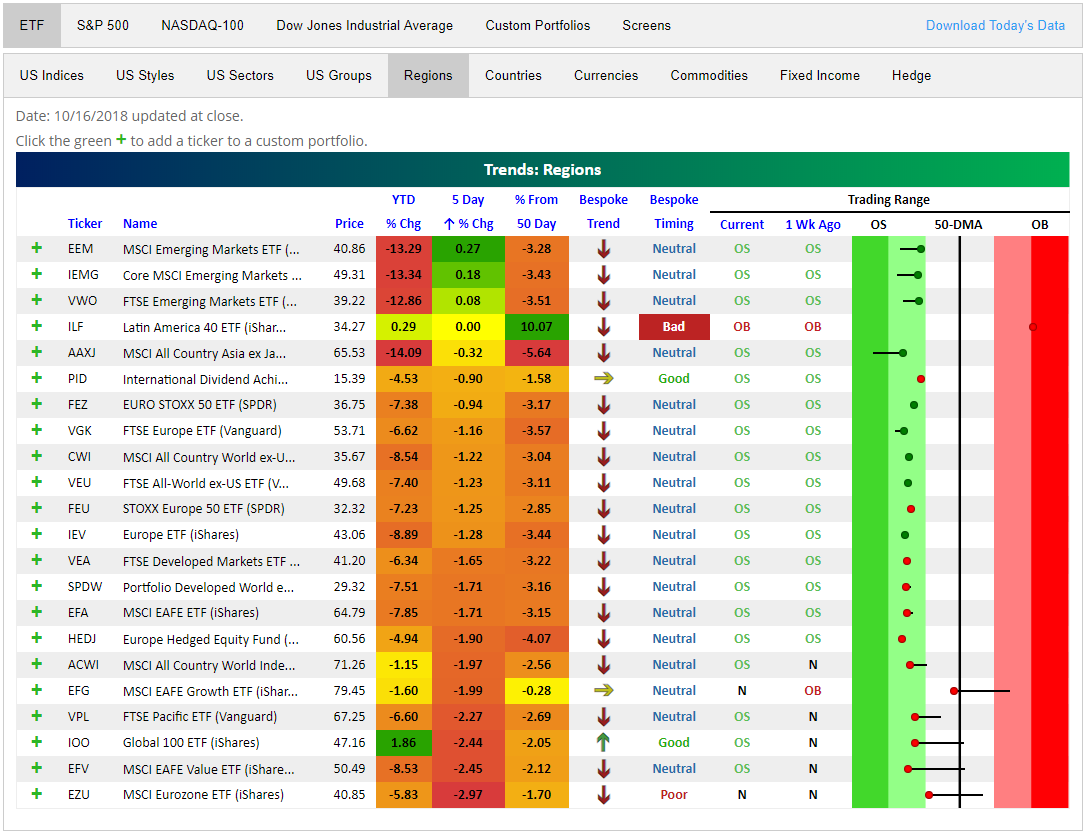
After a huge drop to start October, the S&P 500 (SPY) has rebounded 3% over the last 3 trading days going back to Thursday’s close. Below is a look at the performance of various asset classes during this 3-day bounce along with October and year-to-date performance as well.
The Nasdaq 100 (QQQ) took it on the chin the most during the early October sell-off, and now it’s up the most out of the major US index ETFs during the bounce back. Growth has crushed value on the bounce back as well, but growth is still lagging value badly for the month (but not for the year).
Technology (XLK) and Communication Services (XLC) are up the most over the last 3 days, while Energy (XLE) is up the least at just 0.26%.
Outside of the US, Brazil (EWZ) is up more than any other country over the last 3 days with a gain of 5.17%, leaving it up a whopping 16.96% month-to-date. That’s easily the best performing ETF in the entire matrix. On the flip side, China (ASHR) can’t catch a break as it’s flat over the last 3 days while everything else has rallied, and it’s down 25.43% YTD.

The Closer: Breaking Out Of A Bottom, Capacity Concerns, Workers Wanted — 10/16/18
Log-in here if you’re a member with access to the Closer.
Looking for deeper insight on markets? In tonight’s Closer sent to Bespoke Institutional clients, we discuss what types of stocks have led the rally off the bottom from last Thursday, as well as the technical developments over the last few sessions that make this rally look even more attractive. As far as economic data today, industrial production was solid, and oil production continues to impress despite relatively low capacity utilization in manufacturing. Finally, we dive into the blow-out job openings number reported today by the BLS.
See today’s post-market Closer and everything else Bespoke publishes by starting a 14-day free trial to Bespoke Institutional today!
Industrial Production Beats Estimates
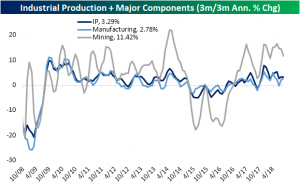
Industrial production growth in September was forecasted to fall to 0.2% from August’s reading of 0.4% MoM. The release for September came in higher than expectations at +0.3%. On a 3m/3m annualized basis, September’s data is still below where it has been for most of the year though. Mining has continued to be a key driver in the aggregate production measure this year. Even with over a 3% decline from the prior period, mining production rose 11.42% on a 3m/3m annualized basis. A big portion of this mining production comes from strength in oil and gas. Manufacturing saw a nice bounce thanks to much stronger automotive production.
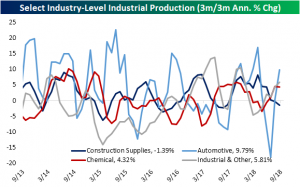
On the industry level, we have seen a substantial recovery of autos. As one of the major components that make up aggregate industrial production, it is a good sign to see this industry picking up steam. Only a couple months ago—back in July—the industry was at a multiyear low of -18.01% annualized on a 3m/3m basis. Since then, it has climbed all the way back to 9.79% through September. This comes on the back of September’s stronger than expected auto sales that was released earlier this month. This could bode well for the automotive industry which has been soft since the end of 2017.
Unfortunately, the strength in autos for this month was not reflected in construction supplies which fell again to -1.3% annualized 3m/3m. This is nothing new for this year as many housing and construction data points have been consistently weak.
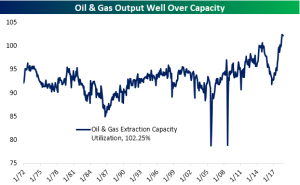
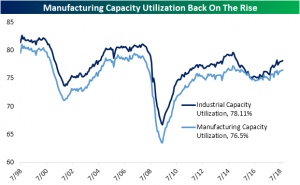
After bottoming out in 2016, both industrial and manufacturing capacity utilization have been on the move upwards. Industrial capacity utilization has yet to take out its high from back in April, but it has seen consistent moves higher over the course of the past few months. Today’s release forecasted capacity utilization to increase to 78.2%. Instead, September’s release came inline with August at 78.1%. Manufacturing utilization, on the other hand, did surpass its high in September. It is now at its highest level since July 2015. On a longer time frame though, capacity still has not reached pre-recession levels.
Despite a very small downtick for September—moving to 102.25% from 102.28%—oil and gas are still producing at levels over capacity. As international trade tensions surrounding these products mount, it should not come as any surprise that US producers are working overtime to make up the difference.