B.I.G. Tips – International Breadth Divergences
Housing Less Affordable, But Not Dramatically So
Housing data has come in weaker than expected across a number of indicators over the past several months, and as we discussed last night in The Closer, the Home Construction ETF (ITB) is near its worst levels versus the broad market in 6 1/2 years. With home prices relatively high, mortgage rates rising, a lack of cheap land to build on in many markets, tight labor availability, and input cost pressures, it’s not a huge surprise that homebuilders are in trouble.
All of that said, it’s remarkable how concerned markets and pundits are about housing. Each month, the National Association of Realtors puts out an index that combines home prices with income levels and mortgage rates to deliver a bottom-line affordability number. The level of the index is arbitrary; what matters is the change or relative level. Higher readings mean housing is more affordable, lower readings mean housing is less affordable. Post-crisis, the combination of lower rates and home prices dropping much more than incomes ever did mean housing became rapidly more affordable. For those that were able to take out a mortgage (credit was obviously very tight, many households couldn’t qualify, and households were deleveraging anyways), buying a house was cheap. Since home prices bottomed in 2012, though, things have gone the other way. Relative to the immediate post-crisis period, housing is now pretty expensive. But it’s important to keep in mind that relative to rates and incomes, it’s much, much less expensive now than it was at any point from 1989 through 2009. It’s important to keep this fact in mind when reading commentary about how hard mortgage rate increases will hit the housing market.
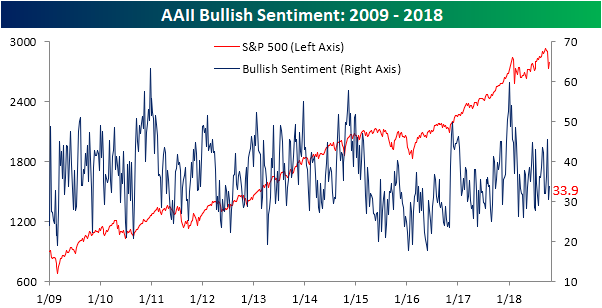
Bulls Stand Their Ground
There may not be a whole lot of them, but among the bulls that remain, they held firm in the latest week as equity markets attempted to regain their footing. According to the weekly sentiment survey from AAII, bullish sentiment increased this week from 30.6% up to 33.9%. While slightly more than a third of investors are bullish, this reading remains below the historical average of 36.7% that has been in place throughout the bull market.
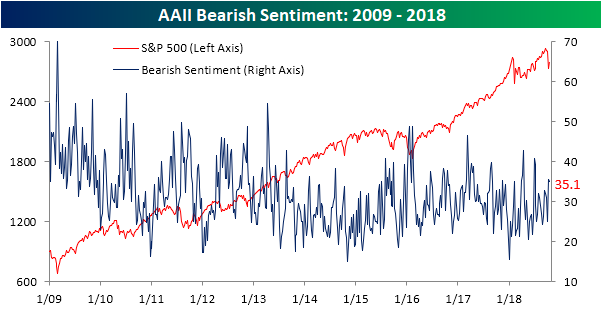
While bulls may have been resilient in the last week, so too were the bears. They held firm at 35.0% versus 35.5% last week.
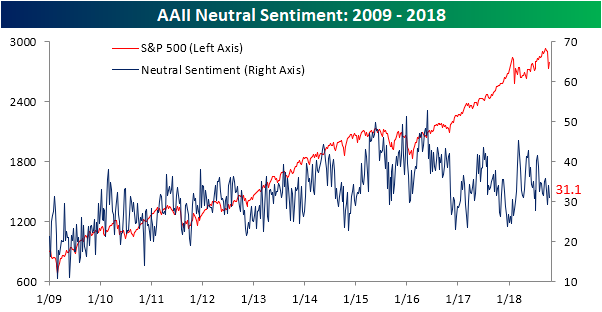
Investors considering themselves neutral saw the biggest decline this week, but even this reading saw little in the way of movement, falling from 33.9% down to 31.1%.
the Bespoke 50 — 10/18/18
Every Thursday, Bespoke publishes its “Bespoke 50” list of top growth stocks in the Russell 3,000. Our “Bespoke 50” portfolio is made up of the 50 stocks that fit a proprietary growth screen that we created a number of years ago. Since inception in early 2012, the “Bespoke 50” has beaten the S&P 500 by 91.7 percentage points. Through today, the “Bespoke 50” is up 195.3% since inception versus the S&P 500’s gain of 103.6%. Always remember, though, that past performance is no guarantee of future returns.
To view our “Bespoke 50” list of top growth stocks, click the button below and start a trial to either Bespoke Premium or Bespoke Institutional.

Philly Fed Slightly Better Than Expected
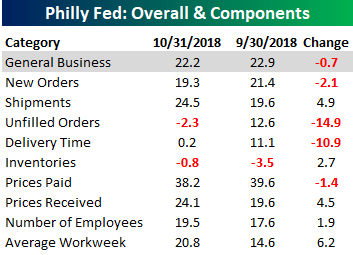
Like its New York counterpart, the October read on manufacturing in the Philadelphia Fed region came in slightly better than expected. While economists were forecasting the headline General Conditions index to come in at a level of 20.0 versus last month’s reading of 22.9, the actual reading of 22.2 showed only a slight decline. As it stands now, the Philly Fed has been positive for 29 straight months, which is the longest streak of growth readings since the 30-month streak ending in August 2015 and before that the 29-month streak ending in August 1998.

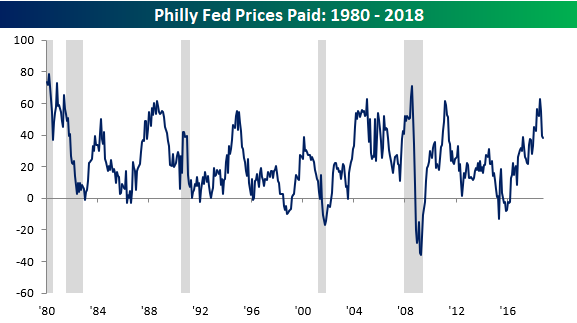
Breadth in this month’s report was skewed towards the positive side as five components increased m/m and just four declined. The biggest increase was in the Average Workweek followed by Shipments, while Unfilled Orders and Delivery Times saw the largest declines. Prices Paid also warrants a mention, as even though it didn’t see a large m/m decline, it remains well off of its multi-year high of 62.9 back in July (chart below).
Jobless Claims Fall Slightly More Than Expected
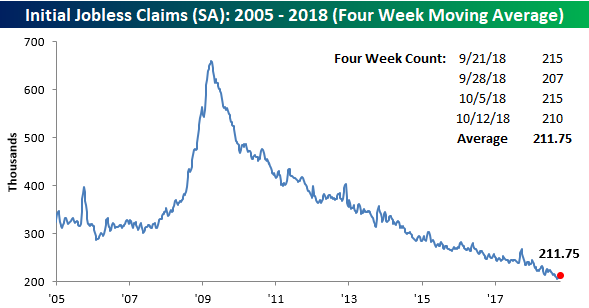
After reaching what was tied for the highest weekly reading (215K) since July last week, jobless claims fell slightly more than forecast, dropping from 215K down to 210K compared to expectations for a level of 211K. Perhaps the most noteworthy aspect of the previous sentence was the fact that a weekly reading of 215K represented a three-month high in claims. That’s just how low claims have been! As for the streaks, the weekly print has now been at or below 300K for a record 189 straight weeks, been at or below 250K for 54 straight weeks, and at or below 225K for 15 straight weeks.

Even though claims declined this week, the four-week moving average increased slightly, rising from 209.75K up to 211.75K. That’s still less than 6K from the multi-decade high of 206K back from mid-September, but based on the recent prints, it doesn’t look like we will be getting anywhere near that record in the near future.
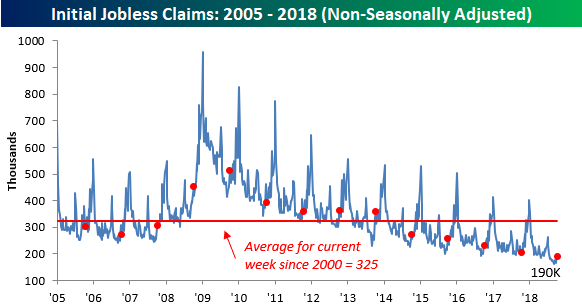
On a non-seasonally adjusted (NSA) basis, jobless claims fell from 199.9K down to 190K. For the current week of the year, that’s more than 130K below the average since 2000 and the lowest weekly print since the same week in 1969.
Morning Lineup – Still No Love For Earnings
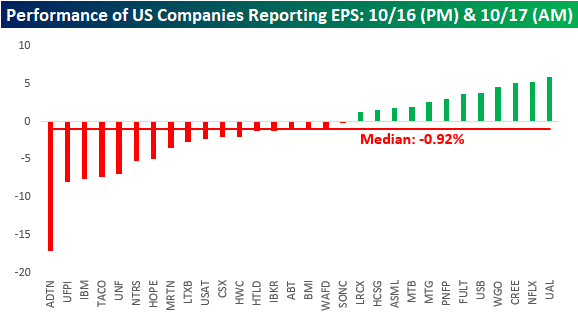
Equities are looking to start the day a little lower, but futures are off their lows of the overnight session. Economic data so far this morning has been positive as the Philly Fed and both Initial and Continuing Jobless Claims all came in slightly better than estimates. The pace of earnings reports is starting to pick up, but we still haven’t seen much of an improvement to the sell the news reaction that has been in place for over a month now.
With regards to the earnings sell the news trend, we would note that of the 30 US companies that reported earnings from the close on Tuesday through the open on Wednesday, only 12 finished higher yesterday. Overall, the median return of the 30 stocks was a decline of 0.92% compared to the S&P 500, which was flat on the day. The way the market has been punishing stocks that report earnings of late, there hasn’t been any incentive to buy a company ahead of its earnings report.
Start a two-week free trial to Bespoke Premium to see today’s full Morning Lineup report. You’ll receive it in your inbox each morning an hour before the open to get your trading day started.

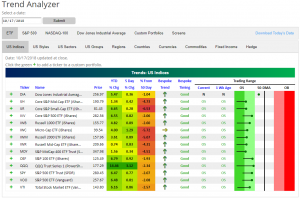
Trend Analyzer – 10/18/18 – Slight Improvements
This time last week was the worst of the recent widespread equity sell-off. In the week since then, markets have crawled higher. While they are nothing to write home about, every ETF in the major US Index ETF group has now edged out gains from one week ago. The Nasdaq has had a remarkably better week compared to its peers, up 3.12% from 5 days ago. Despite this, other than the Dow (DIA), all the ETFs remain oversold sitting well below their 50-DMAs. On the bright side, there are no longer any ETFs that are extremely oversold as they have climbed upwards towards their 50-DMA since this time last week. At least things are back to trending in the right direction.
The Closer: Housing Getting Silly, Carry & Roll — 10/17/18
Log-in here if you’re a member with access to the Closer.
Looking for deeper insight on markets? In tonight’s Closer sent to Bespoke Institutional clients, we take a look at some market developments in the US including breadth, real yields, and the term structure of volatility markets. We also dive into housing data updated today by the US Census, the extreme valuation levels for homebuilders, and some observations from fixed income.

See today’s post-market Closer and everything else Bespoke publishes by starting a 14-day free trial to Bespoke Institutional today!
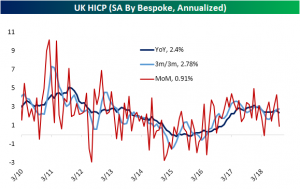
UK Inflation Continues to Cool
As we discussed in our Morning Lineup, early this morning the UK’s Office for National Statistics released its September inflation data. Overall, the report was somewhat mixed with consumer measures missing while PPI rose. Headline and core HICP came in at 2.4% YoY and 1.9%, respectively. These are both below estimates and the prior period’s reading. The other measure of consumer inflation, RPI (Retail Price Index), was expected to come inline with last month but this too fell to 3.3% YoY. On a MoM seasonally adjusted basis, consumer inflation fell to one of its lowest levels in the past few years as shown in the charts below. This shows the general inflation picture is settling down, but politics surrounding Brexit can have an impact down the road.
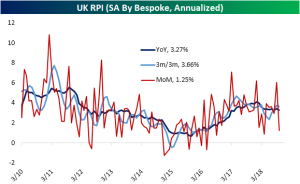
In the period following the Brexit referendum in 2016, consumer inflation ratcheted upwards for both HICP and RPI, both thanks to the collapse in GBP being passed along to consumers. Since Brexit negotiations between the EU and UK began in 2017, we have seen this trend begin to cool as the pound has stabilized, and this most recent release confirms this slowdown. The main concern is that these negotiations will not bear fruit resulting in a “no-deal” Brexit without a settlement on several hot-button issues like the North Ireland border and customs/trade plans. We generally expect the UK to avoid a “hard” Brexit and reach some sort of customs agreement with the EU, so inflation is likely to be less of a headache for the BoE going forward than it has been in recent years. Of course, a failure of negotiations ahead of the mid-March exit of the UK would mean all bets are off; that’s one reason to expect little policy change from the BoE over the next few months.