Severe Off-Season Earnings Weakness
Using our Earnings Explorer tool, we did a quick check today on how companies that have reported during this “off-season” have done. There have been 141 earnings reports since May 17th when the first quarter reporting period ended. Of these 141 reports, 71% reported stronger than expected EPS, while 62% reported stronger than expected sales. Only 6% have raised forward guidance while 11% have lowered guidance.
In terms of how company share prices have reacted to their reports this off-season, it has essentially been a bloodbath. The average stock that has reported has fallen 1.31% on its earnings reaction day, which is the first trading day following its earnings report. (For companies that report in the morning, its earnings reaction day is that trading day. For companies that report after the close, its earnings reaction day is the next trading day.)

Our rolling 3-month beat rate charts still show downtrends. While the bottom-line EPS beat rate remains nearly 3 points above its historical average, the top-line sales beat rate has recently dipped slightly below its average.

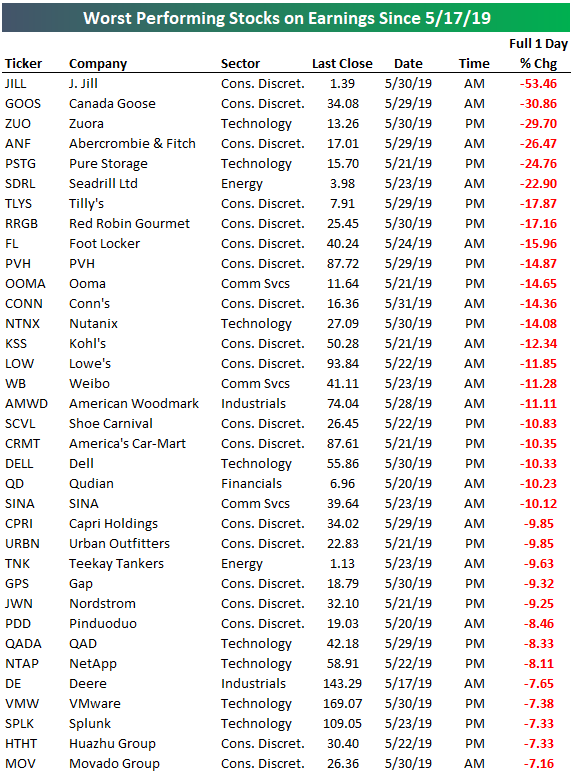
You can track the performance of individual stocks in reaction to earnings using our Earnings Explorer tool, but below is a list we pulled that shows the worst performing stocks in reaction to earnings since the “off-season” began on May 17th. Twenty-two of the 141 stocks that have reported this off-season have fallen more than 10% on their earnings reaction days. The list is littered with retailers like J. Jill (JILL), Canada Goose (GOOS), Abercrombie & Fitch (ANF), Foot Locker (FL), Kohl’s (KSS), Lowe’s (LOW), Urban Outfitters (URBN), and Nodstrom (JWN). Start a two-week free trial to Bespoke Institutional to unlock our Earnings Explorer tool and much more.
Bespoke Stock Scores — 6/4/19
Chart of the Day: Interest Rate Markets In Their Own World
As-of yesterday, the short-term interest rate market was pricing a 59% chance of a rate cut at the FOMC’s July meeting, a 75% chance of two cuts by December, and a 53% chance of three cuts by December. As a result, interest rate contracts and short-term bonds have exploded higher in price with two year yields down over half a percent in a bit less than two months. The explicit bet is that the FOMC will be forced to cut rates in response to rising uncertainty related to trade tensions and a weakening global economy, combined with risks of outright recession. In recent commentary, FOMC members have been much less sure about the negative sides of the outlook. One member of the FOMC (St. Louis Fed President James Bullard, the most dovish member of the committee and a regional bank President who has a history of outlandish lurches in commentary) has said verbatim that a cut may be warranted, but no other FOMC member has said anything close to that. Today, Fed Chair Powell said the FOMC will “act as appropriate to sustain the expansion” and is “closely monitoring” how trade developments impact the economy; that’s a long way from getting markets ready for an imminent cut! So the market is clearly being much more aggressive than the Fed. Why?
Continue reading this Chart of the Day by logging in (if you’re already a member) or starting a two-week free trial to any of our research membership levels.
May 2019 Headlines
“Internationals” Catch A Break
With the US dollar taking a breather in the last couple of days, our index of Internationals has caught a bid in the early going today as it attempts to stabilize from a drop of just under 10% since late April. For those unfamiliar with our Internationals index, using our International Revenues Database, we classify any S&P 500 company which derives more than 50% of their revenues from outside the United States as part of the Internationals index, while any S&P 500 company which derives more than 90% of their revenues in the United States is part of our Domestics index.
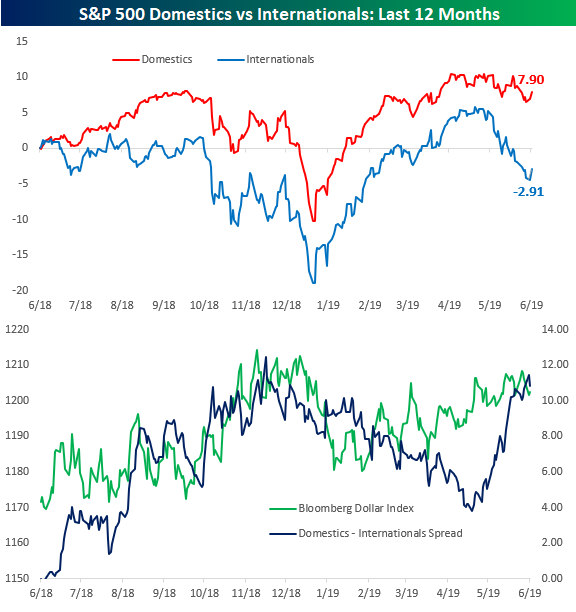
The chart below shows the performance of both indices over the last 12 months, and given the relative weakness of the rest of the world’s economy versus the US, our Domestics index has consistently outperformed the Internationals. Since late May, though, the gap really widened as Internationals fell sharply in response to heightened concerns regarding global trade and possible retaliation from China and other countries in response to US tariffs on imports. Through the early going on Tuesday, the Domestics index is up 7.9% over the last year and down less than 2.5% from its recent high. The Internationals index, meanwhile, is down 2.91% over the last year and nearly 10% from its high less than six weeks ago.
In the second chart, we show a comparison between the Bloomberg US Dollar Index and the performance spread between the Domestics and Internationals indices over the last year. Typically, when the dollar is strong, Domestics outperform the Internationals and vice versa. That’s exactly what we are seeing now, as both the Dollar Index and the outperformance of Domestics relative to Internationals are right near 52-week highs. Going forward, any signs this week from the litany of Fed speakers that they are coming around to the market’s view of cutting rates sooner rather than later would likely pressure the dollar and lead to a boost for the Internationals. We could be seeing some early signs of that today as the Internationals index is bouncing from very oversold levels and trading higher by 1.7% compared to a gain of just 0.8% for the Domestics. Choose one of Bespoke’s three premium subscription options for our most actionable research.
Trend Analyzer – 6/4/19 – Mid-Caps Bouncing
As US tech giants are put under the microscope with Facebook (FB), Alphabet (GOOGL), and Apple (AAPL) all now under investigation, the Nasdaq (QQQ) fell over 2% yesterday. These declines have brought it to the deepest oversold levels of all the major index ETFs. QQQ is also now down the most over the past 5 days having shed 4.51%. While every other ETF in this group is still also extremely oversold, mid-caps have begun to bounce off of these extreme levels. The Core S&P Mid-Cap ETF (IJH), Russell Mid-Cap ETF (IWR), and S&P MidCap 400 ETF (MDY) have all managed small gains over the past couple sessions and are outperforming their peers. IWR is perhaps the most interesting of these three as the past two session’s gains have come after the ETF found support at the 200-DMA. Additionally, it now sits with the largest YTD gain of 13.54% Start a two-week free trial to Bespoke Institutional to access our interactive Trend Analyzer and much more.

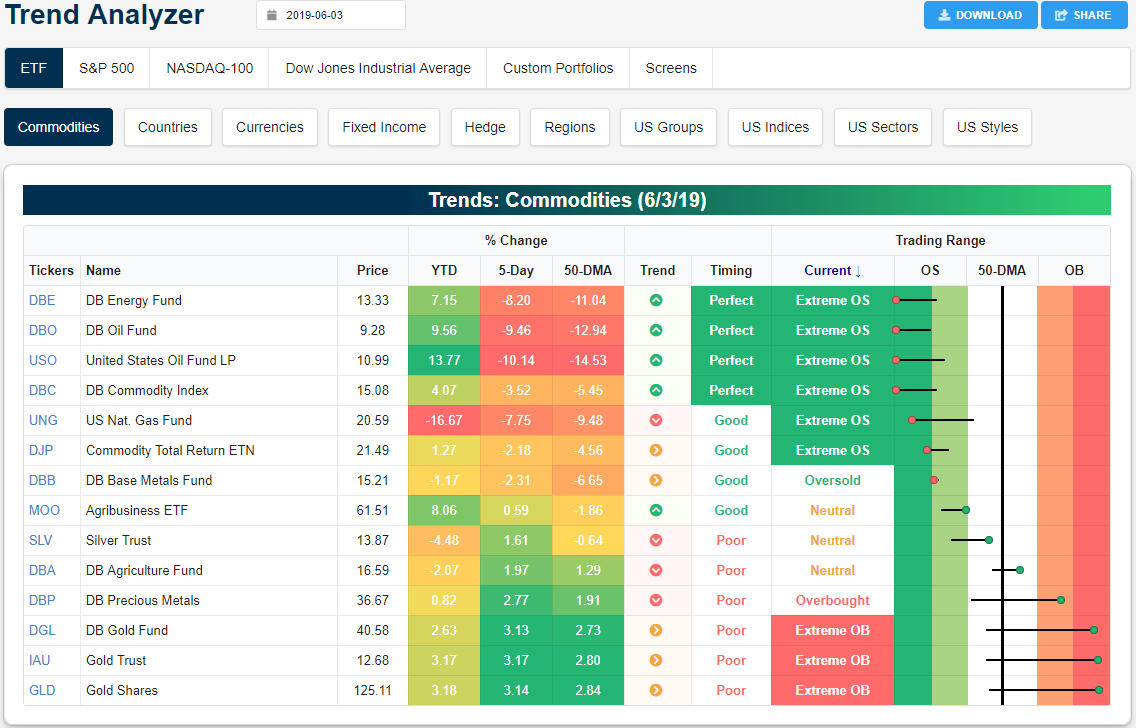
Turning over to commodities, the rout of oil has continued and the ETFs tracking oil are about as oversold as it gets in our Trend Analyzer. In the past week, the United States Oil Fund (USO) and DB Oil Fund (DBO) have lost 10.14% and 9.46%, respectively. While holding up slightly better, the DB Energy Fund (DBE) has also fallen considerably, down 8.2% in the same time. Along with the DB Commodity Index (DBC), these three all closed over 3 standard deviations from the 50-DMA. On the other hand, while equities have slid, gold has gotten bid up as the DB Gold Fund (DGL), Gold Trust (IAU), and Gold Shares (GLD) now all sit over 3% higher from last week. Each of these gold ETFs now sit deep into overbought territory. Another interesting point to make on gold is that this recent run higher has brought the metal out of its short term downtrend, but on a longer term it is still moving sideways. The DB Precious Metals ETF (DBP) and silver (SLV) have similarly seen strong gains of 2.77% and 1.97 %, respectively.
Morning Lineup – That Color You See is Called Green
Futures were already higher on little more than equities being sharply oversold and treasuries being extremely overbought, so we were due for at least a short-term bounce. The positive momentum has been aided by some dovish comments from Chicago Fed President Evans just now and somewhat conciliatory language from the Chinese regarding trade. There’s a lot more Fed commentary on the schedule for today, though, so they will likely send a message to the market either way. Either the market has it entirely wrong pricing in multiple cuts over the next several months, or they will signal they are coming around to the market’s view.
Please click the link below to read today’s Bespoke Morning Lineup for more of our recap of this morning’s market performance overseas as well as our view that stocks don’t have to plunge if the Fed doesn’t cut rates as aggressively as the market is pricing in.

Markets appear to be on pace to unwind much of the moves we saw yesterday, but we would be remiss not to point out the drubbing that the high yield market has seen in recent days. As shown in the chart below, high yield spreads (plotted on an inverse basis in the chart below) have widened out to their highest levels since early January. In just the last two days alone, spreads have widened out by more than 35 basis points, which is the biggest two-day move since December.

Start a two-week free trial to Bespoke Premium to see today’s full Morning Lineup report. You’ll receive it in your inbox each morning an hour before the open to get your trading day started.
S&P 500 and 10-Year Treasury Yields Converge
One of the most bullish cases for equities now is the fact that the S&P 500’s dividend yield and the yield on the 10-Year Treasury Note have fully converged. In early Q4 2018, “risk-free” yields on the 10-Year were at 3.23% versus a dividend yield of just 1.9% for the S&P 500. With the yield on the 10-year falling more than 110 basis points since its peak in early November 2018, it makes the stock market significantly more attractive relative to risk-free rates at this juncture. Choose one of Bespoke’s three premium subscription options for our most actionable research.

The Closer – Tech Smashed, Twos Surge, ISM Tank, Tweaked Home Improvement – 6/3/19
Log-in here if you’re a member with access to the Closer.
Looking for deeper insight on markets? In tonight’s Closer sent to Bespoke Institutional clients, as tech got smashed today as companies like GOOGL, FB, and AAPL are all now under investigation, we review what it means relative to the broader market. We then turn to what the front end of the UST curve is saying in regards of rate cuts and the probability of a recession. Next, we review the ISM Manufacturing report and the construction spending numbers for April.

See today’s post-market Closer and everything else Bespoke publishes by starting a 14-day free trial to Bespoke Institutional today!