Earnings Disasters
While the broad stock market had a banner week, companies that reported earnings this week generally did not. A total of 42 companies reported earnings this week, and the price reactions certainly left something to be desired. The average stock that reported this week opened down 2.44%, then traded down another 1.75% from the open to the close. The average full-day change for the 42 stocks that reported this week was a decline of 3.63%.
Below is a snapshot of the stocks that had the most negative price reactions to earnings this week:
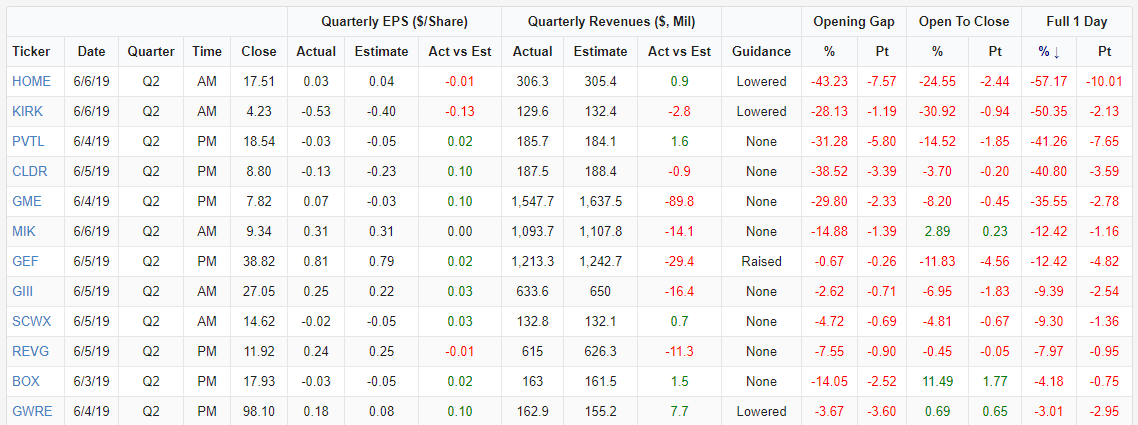
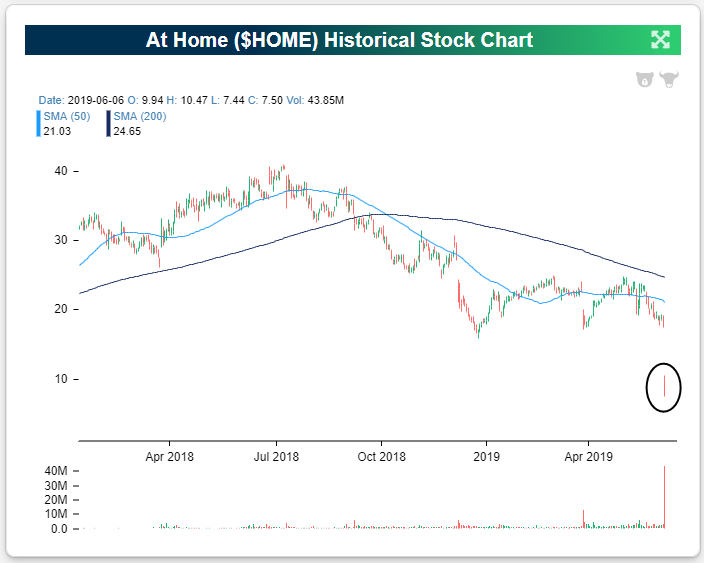
Home furnishing retailer At Home (HOME) tops the list of losers after the stock lost more than half of its value after its most recent earnings report Thursday morning. On top of lowering guidance, the company was expected to see EPS fall to $0.04, a massive decline versus the previous quarter’s $0.47 and last year’s Q2 $0.34, but the company reported an even worse EPS of $0.03. This profitability drop overshadowed YoY revenue growth of just over 6%. The stock’s complete collapse yesterday accelerated what was already a long-term downtrend, bringing the stock to an all-time low.
Another specialty home decor retailer, Kirkland’s (KIRK), reported its second abysmal quarter in a row with lowered guidance, lower and negative EPS, and a miss in revenues. Last quarter saw a similarly poor report and the stock slid 23.38% in response. The punishment kept coming this time around as the stock was cut in half, falling from $4.23 at Wednesday’s close to $2.10 by the end of the day Thursday; the stock’s lowest level in over a decade.
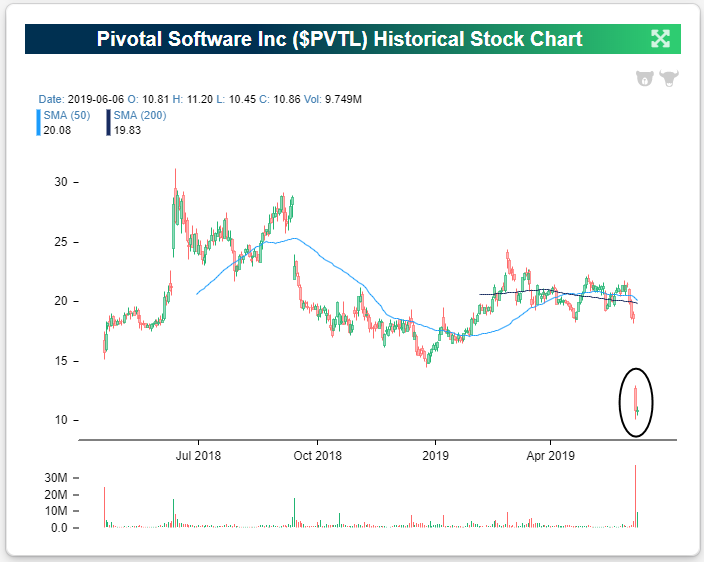
At first glance, cloud services provider Pivotal Software’s (PVTL) most recent quarter may not have looked too bad, especially given its solid earnings history headed into the report. Even after Tuesday’s report, the company has never missed an EPS estimate in its history, and it has only missed revenue estimates once (the prior quarter). Despite maintaining this pretty strong track record, PVTL fell 41.26% in response in Wednesday’s trading. These declines were a result of weakness under the hood of this report. PVTL claimed several deals had fallen through and competition had become more of a headwind. In turn, the stock received multiple analyst downgrades. This perfect storm leaves the stock near all-time lows and 36.12% below its price when the stock first hit the market just over one year ago. Start a two-week free trial to Bespoke Premium to use our Earnings Calendar and other tools!

Beginner’s Luck?
Since its IPO on May 2nd, plant-based meat alternative brand, Beyond Meat (BYND), has been one of the hottest stocks in the market. Last night, the company had its first earnings report as a public company. The results seemed to justify the run-up in price since the IPO as it saw an earnings triple play (beat EPS, beat revenues, raised guidance). EPS came in negative but 1 cent above analyst estimates. Revenues were $40.2 million versus estimates of $38.93 million. The major highlight of these revenue numbers was a year-over-year growth rate of an astounding 214.1%. The company also raised guidance. This has rocketed the stock higher as it now sits up 25.92% today, and that is off of the day’s highs and below the opening price!

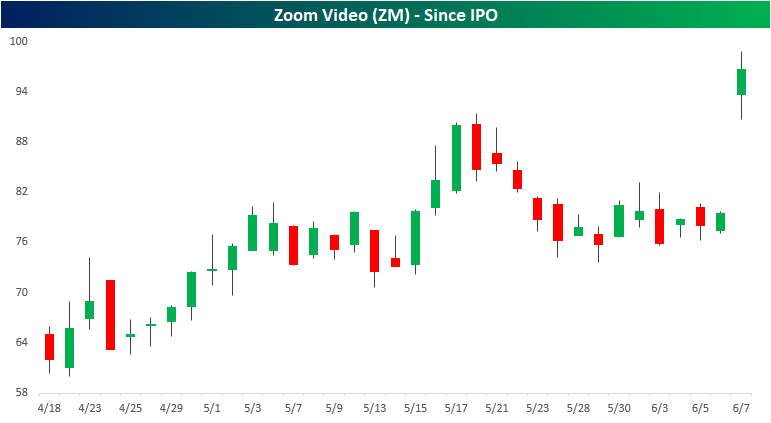
Another recent IPO, Zoom Video (ZM), is also up over 20% on an earnings triple play reported last night. This provider of video communication services reported EPS of $0.03 compared to estimates of $0.01. Revenues also came at $122 million, well above estimates. Similar to BYND, revenues also saw substantial year-over-year growth of 103.1%.
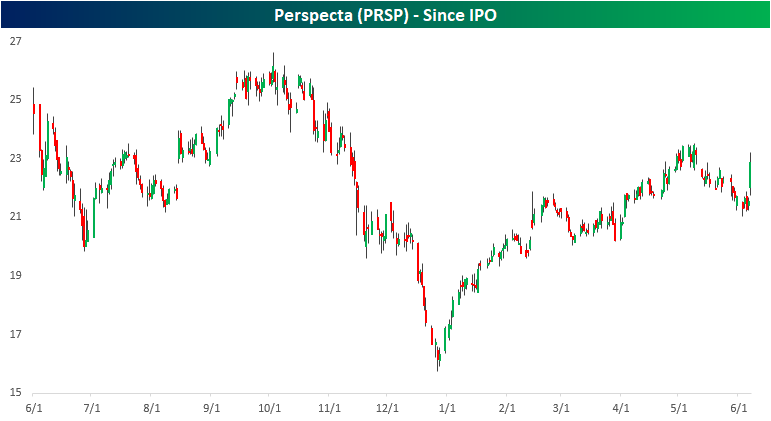
Perspecta (PRSP) was the third triple play reported last night after the close. While not as green as ZM or BYND, Perspecta is still fairly new as it first hit the market just over a year ago. PRSP beat EPS by 7 cents and revenues by $16 million. Not as high of a growth rate as the others, PRSP still boasts high YoY growth of 53%. Relative to the other triple plays today, PRSP hasn’t been nearly as volatile but it has made a solid push higher. The stock gapped up 2.18% at the open, rising further from the open now sitting 5.85% above last night’s close. It now sits just 2.28% below its highs from the first week of May. Start a two-week free trial to Bespoke Premium to track all earnings triple plays on a daily basis!
F For Forecasting
One would think that with all the technological improvement in the last few years and the ability to gather more data related to the employment landscape of the US economy, that forecasting of the monthly Non-Farm Payrolls report would be improving. For several years that was the case, but lately not so much. Take the last six months, for example. In the six Non-Farm Payrolls reports that have been released so far in 2019, the actual reported readings versus expectations have been +128K, +139K, -160K, +19k, +73k, and -100K, respectively. There was a time when it was pretty uncommon for Non-Farm Payrolls to be more than 100K above or below the consensus reading. Recently, though, that has been the norm, and over the last six months, the actual reported reading has been above or below consensus expectations by an average of 103K!
Using our Economic Indicators tool, we created the chart below which shows the six-month average spread between the actual and reported reading in Non-Farm Payrolls going back to the late 1990s. From 1999 through the early 2000s, there were multiple periods where the average spread topped 100K. Beginning in early 2005, though, the spread dropped below 100K and remained that way for a number of years, averaging just 50K from the start of 2005 through the end of last year. Economists were really on a roll in their forecasting! This year, though, the pattern has shifted in a big way, and through this morning’s report, the six-month average now stands at 103K – the highest reading since December 2004. We realize that there have been a number of macro-headwinds (government shutdown in late 2018 and tariffs this year) that have made the forecasting process more difficult, but it has been a bad few months for forecasting. Start a two-week free trial to Bespoke Institutional to access our interactive economic indicators monitor and much more.

Morning Lineup – Will Jobs Keep the Rally Going?
The last day of the week is looking like it will be off to a positive start, but who is anybody kidding thinking that these moves will mean anything when we have one of the most anticipated jobs reports in months on the horizon?
Please click the link below to read today’s Bespoke Morning Lineup for our take on this morning’s encouraging pattern in European Industrial Goods sector as well as a closer look at what’s driving the weakness in German exports.

Ahead of this morning’s jobs report, we just wanted to take a quick look at market breadth to see where the S&P 500’s cumulative A/D line stands. By this measure at least, we still don’t see a whole lot of weakness underneath the service as the cumulative A/D line held up pretty well throughout the recent bout of selling and currently isn’t far off its highs from earlier in the year.

Start a two-week free trial to Bespoke Premium to see today’s full Morning Lineup report. You’ll receive it in your inbox each morning an hour before the open to get your trading day started.
The Closer – New Small Cap Lows, Real Yield Impact, Factory USD, Flow of Funds – 6/6/19
Log-in here if you’re a member with access to the Closer.
Looking for deeper insight on markets? In tonight’s Closer sent to Bespoke Institutional clients, we begin with a look the underperformance of small caps as the relative performance of the Russell 2000 versus the S&P 500 has hit a 52-week low. We also look into the decline in real yields and how this can impact markets and industrial production in the future. Next, we dig into today’s Federal Reserve’s Z.1 report to get a read on debt levels in the US economy.

See today’s post-market Closer and everything else Bespoke publishes by starting a 14-day free trial to Bespoke Institutional today!
Bespoke’s Sector Snapshot — 6/6/19
We’ve just released our weekly Sector Snapshot report (see a sample here) for Bespoke Premium and Bespoke Institutional members. Please log-in here to view the report if you’re already a member. If you’re not yet a subscriber and would like to see the report, please start a two-week free trial to Bespoke Premium now.
In this week’s Sector Snapshot, we note improvement for equities over the past week even as defensives still lead.
To gain access to the report, please start a two-week free trial to our Bespoke Premium package now. Here’s a breakdown of the products you’ll receive.

Bespoke Consumer Pulse Report — June 2019
Bespoke’s Consumer Pulse Report is an analysis of a huge consumer survey that we run each month. Our goal with this survey is to track trends across the economic and financial landscape in the US. Using the results from our proprietary monthly survey, we dissect and analyze all of the data and publish the Consumer Pulse Report, which we sell access to on a subscription basis. Sign up for a 30-day free trial to our Bespoke Consumer Pulse subscription service. With a trial, you’ll get coverage of consumer electronics, social media, streaming media, retail, autos, and much more. The report also has numerous proprietary US economic data points that are extremely timely and useful for investors.
We’ve just released our most recent monthly report to Pulse subscribers, and it’s definitely worth the read if you’re curious about the health of the consumer in the current market environment. Start a 30-day free trial for a full breakdown of all of our proprietary Pulse economic indicators.

B.I.G. Tips – May Employment Report Preview
Heading into tomorrow’s report, economists are expecting an increase in payrolls of 180K, which would be a sizable decline from April’s much stronger than expected reading of 263K. In the private sector, economists are expecting an increase of 172K, which represents a 64K decline from last month’s reading of 236K. The unemployment rate is expected to remain unchanged at 3.6%. Average hourly earnings are expected to grow at a rate of 0.3% versus last month’s 0.2% reading last month. Finally, average weekly hours are expected to show a slight increase to 34.5 from 34.4.
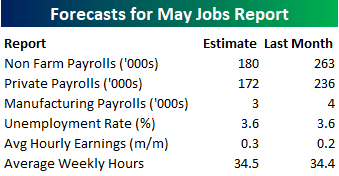
Ahead of the report, we just published our eleven-page preview of the April jobs report. This report contains a ton of analysis related to how the equity market has historically reacted to the monthly jobs report, as well as how secondary employment-related indicators we track looked in April. We also include a breakdown of how the initial reading for April typically comes in relative to expectations and how that ranks versus other months.
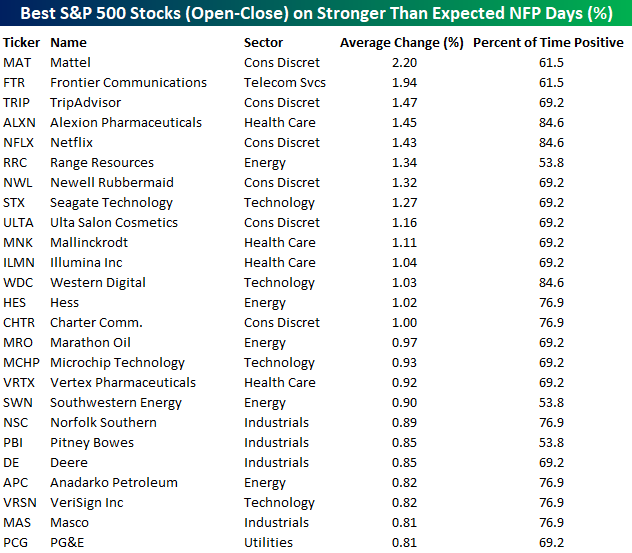
One topic we cover in each month’s report is the S&P 500 stocks that do best and worst from the open to close on the day of the employment report based on whether or not the report comes in stronger or weaker than expected. In other words, which stocks should you buy, and which should you avoid? The table below highlights the best-performing stocks in the S&P 500 from the open to close on days when the Non-Farm Payrolls report has been better than expected over the last two years.
Of the top performing stocks on days when NFP beats expectations, seven sectors are represented, but Consumer Discretionary leads the way with six stocks. Mattel (MAT), soon to be booted from the S&P 500, has been the best performing stock with an average gain of over 2%. In terms of consistency, Alexion Pharma (ALXN) and Netflix (NFLX) have seen gains over 80% of the time.
For anyone with more than a passing interest in how equities are impacted by economic data, this April employment report preview is a must-read. To see the report, sign up for a monthly Bespoke Premium membership now!
Claims Still Steady
Last week, we noted that Initial Jobless Claims have not been changing by much recently. That trend of steady claims has continued this week as seasonally adjusted numbers came in unchanged from last week’s upward revised 218K. That is slightly above estimates of 215K but still healthily below recent highs of 230K. Looking back on the May data, claims came in at 212K in the first two weeks and finished with 218K in the final two weeks. So again, labor data has been steady as far as this indicator goes. The streak of weeks below 250K now sits at 73 and claims have also sat below 300K for a record 222 consecutive weeks. That all may come as a surprise after yesterday’s huge miss in the ADP employment number, but to make sense of this, it seems that while labor data could see some slowing in job creation, people are also not exactly losing jobs at a worrying rate either. Start a two-week free trial to Bespoke Institutional to access our interactive economic indicators monitor and much more.
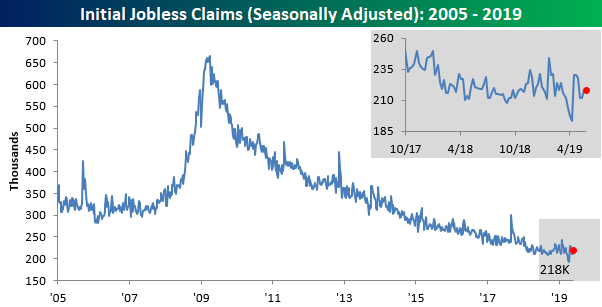
The last of the recent highs in the seasonally adjusted data has now come off of the less volatile four week moving average. Even with last week’s revision higher and this week’s 218K print, the moving average has fallen for its fourth week in a row down to 215K from 216.75K last week. While those declines are a good sign, the moving average also still has yet to make a new low since doing so back in mid-April when it fell to 201.5K.
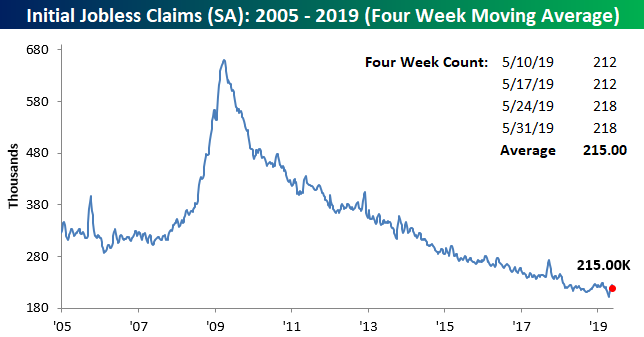
In line with seasonal patterns observed over the past several years, non-seasonally adjusted jobless claims fell this week to 188.7K. That is the lowest reading of the current cycle and going back to at least 2005. In addition, this week’s non-seasonally adjusted number is well over 100K below the average for the current week of the year since 2000 of 292.04K.

Stitch Fix (SFIX) Smashed Earnings, Gaps Up 24%
For the second quarter in a row, popular online clothing retailer Stitch Fix (SFIX) has reported an earnings triple play. Reporting after yesterday’s close, SFIX handily beat EPS estimates of -$0.03 with an actual EPS of $0.07. Revenues also came in at $409 million, $13.94 million above estimates. While the company has never struggled to beat estimates (has only missed revenues once and never missed EPS), SFIX is very volatile on earnings. On average, it has seen an absolute change of 20.19% on its earnings reaction day. In response to last night’s report, SFIX is sticking to that script with a gain of over 16%. Start a two-week free trial to Bespoke Institutional to access our interactive Earnings Expolorer and much more.
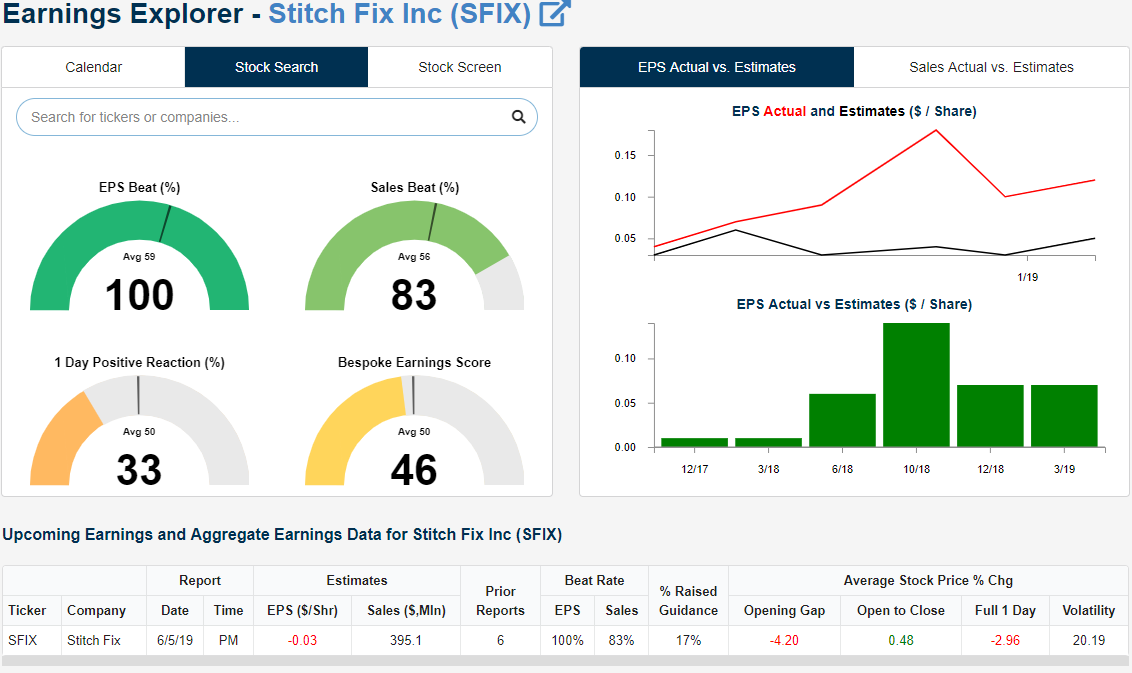
At today’s open, SFIX surged to gap up just over 24% to $29.23! Briefly afterward, it ran a little bit higher to just under $30. But like last quarter, so far in today’s session, these levels are not holding as the stock has been falling since the open, down to $27.73 as of this writing, but still a respectable 18% higher than last night’s close. Whereas the initial gap up brought SFIX through both the 50 and 200-DMA, today’s intraday selling has sent the price back down towards the 200-DMA and early May’s lower high, so it will be important for those levels to hold into the close. The next support level to watch after that will be the 50-DMA. Looking back at the stock’s reaction to its earnings report last quarter, it wasn’t very inspiring. After rising 25.2% in response to its last triple play, SFIX was never able to make a move higher with a series of lower highs and lower lows being made throughout the quarter. While it did not happen the same day as earnings, the 200-DMA and 50-DMA did not provide much support but instead acted more as resistance.
