A Banner First Half for Homebuilders as Mortgage Rates Fall
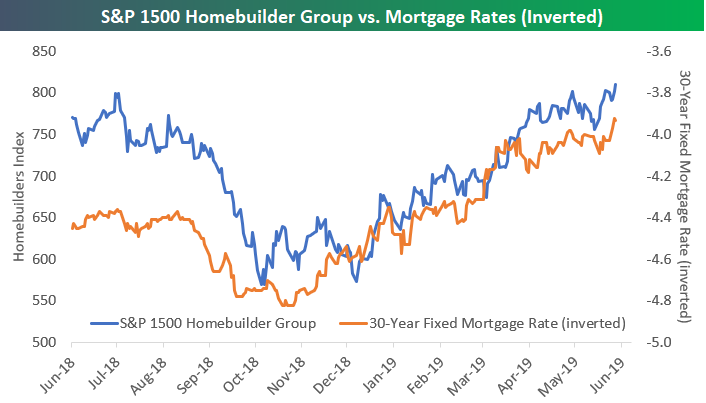
After a very weak second half of 2018 due to rising mortgage rates, the S&P 1500 Homebuilder group has rallied 35% in 2019 to a new 52-week closing high as of last Friday. Below is a chart of the S&P 1500 Homebuilder group vs. an inverted look at Bankrate.com’s 30-year national average fixed mortgage rate. The Homebuilder group bottomed right around the time that mortgage rates peaked, and they’ve been rallying as mortgage rates have been falling.
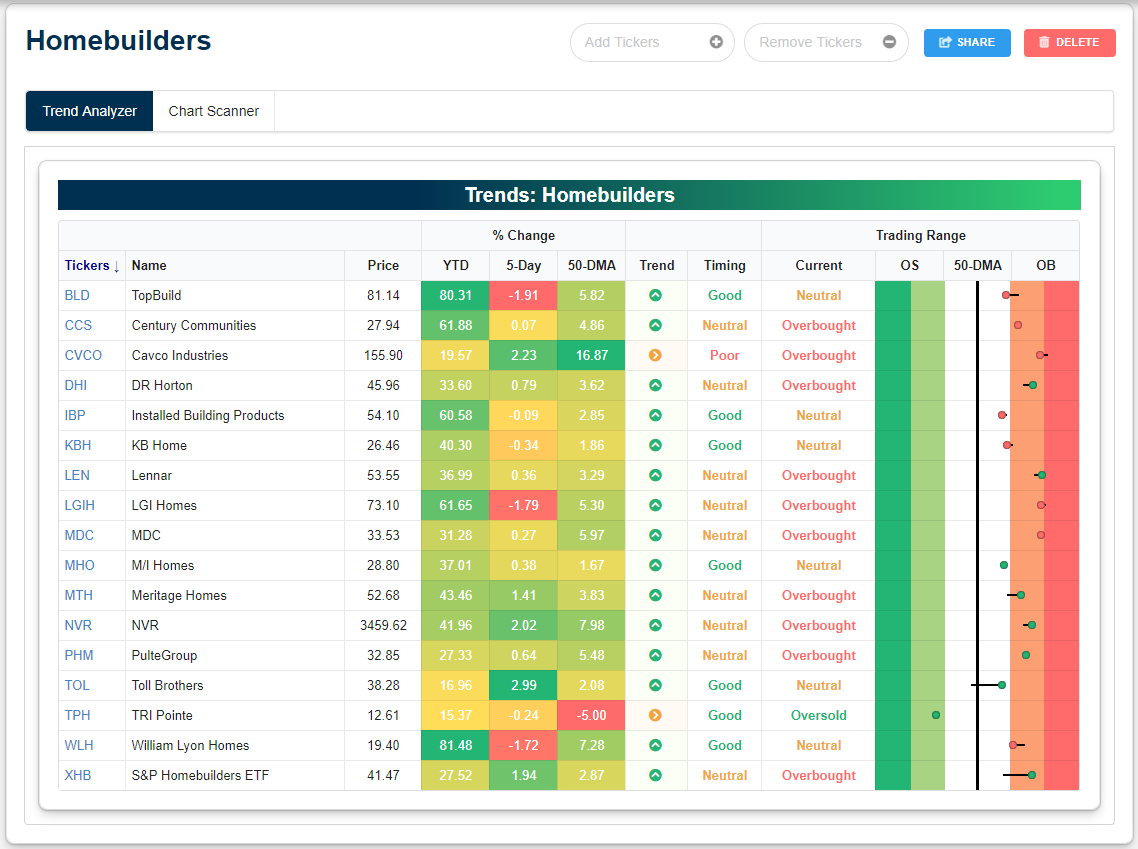
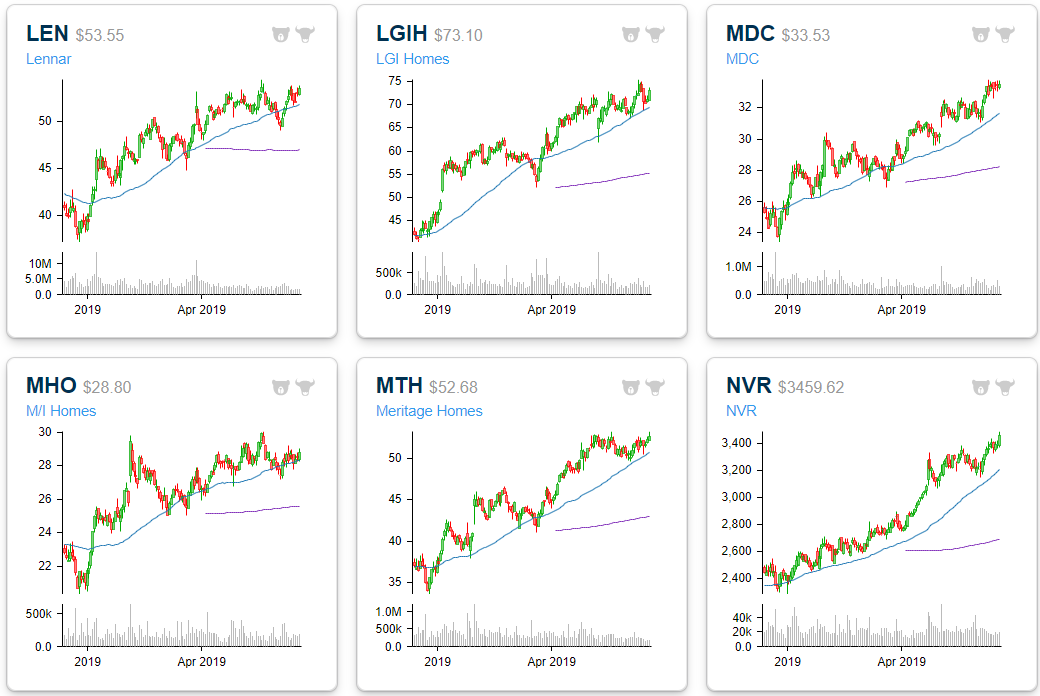
Below is a custom portfolio we’ve built on our website (custom portfolios are available to Premium members and higher) to see how the individual members of the S&P 1500 Homebuilders group look. As you can see, every single stock in the group is up at least 15% year-to-date, with some like TopBuild (BLD), Century Communities (CCS), LGI Homes (LGIH), Installed Building Products (IBP), and William Lyon Homes (WLH) all up more than 60%!
At the moment, all but one of the homebuilder stocks is in a sideways trend or long-term uptrend pattern. The majority are also overbought, meaning they’re currently trading more than one standard deviation above their 50-day moving averages.
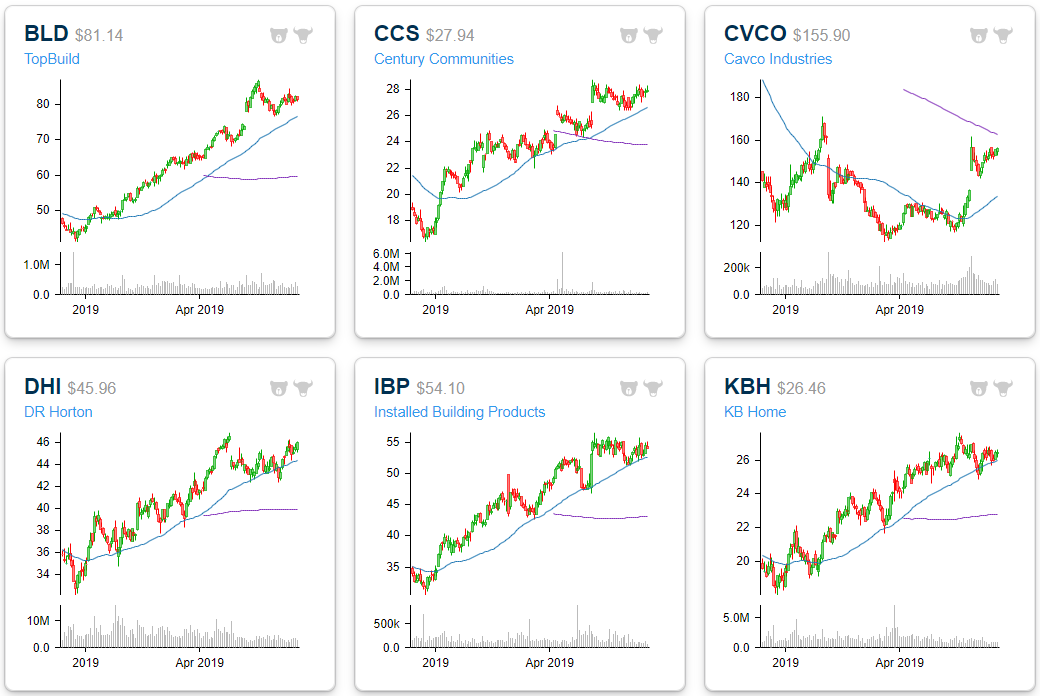
Below we show the individual chart patterns for the homebuilder stocks, which Bespoke Premium members also have access to when they create a custom portfolio. Here you can see that the entire group is made up of mostly bullish chart patterns, with prices trending up and to the right. Most 50-day moving averages (blue lines) are pointed higher, and the 200-day moving averages (purple lines) are starting to turn higher as well. Start a two-week free trial to Bespoke Premium to create your own custom portfolios now and also unlock Bespoke’s premium equity market research.

Record Decline in Empire Manufacturing Report
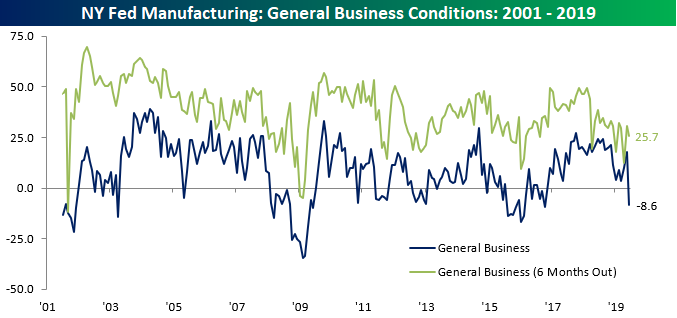
After month/month increases in three of the four prior months, the June Empire Manufacturing report fell and fell hard. While economists were expecting the headline index to drop from 17.8 down to 11.0, the actual decline was much larger sending the headline index down to negative 8.6. With the June decline, the Empire Manufacturing index saw its first negative reading since the 2016 election, the weakest decline relative to expectations since June 2011, and the largest m/m decline in the history of the survey dating back to 2001. One caveat to the decline, however, may be that the temporary trade spat with Mexico may have contributed to the weakness. We’ll have to wait until more data for the month comes in, though, for more clarity on that front.
While current conditions plummeted, the expectations component of the report saw a much more modest decline, falling from 30.6 down to 25.7.
As if the decline in the headline index wasn’t large enough, the text of the report may have been even worse. The first paragraph alone was filled with descriptors like “sharp turn downward,” “plummeted,” “largest monthly decline on record,” “receded,” “fell,” “slightly lower,” “small declines,” “price increases slowed,” and “less optimistic.” On top of that, the titles of the paragraphs that followed were “Growth Abruptly Reverses,” “Employment Shrinks,” and “Futures Indexes Decline.” Happy Monday!
As far as the internals of the report were concerned, every component of the Current Conditions declined except for Prices Paid, while on the Outlook side of the table (Six Months Out), all but two components (Prices Paid and Average Workweek) declined.

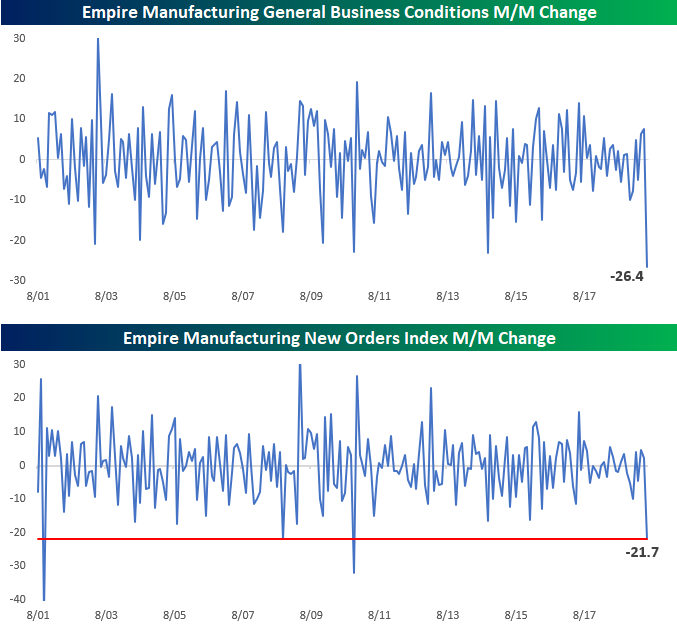
We already mentioned that the headline General Business index saw a record m/m decline, and we highlight that in the first chart below. It wasn’t only the General Business Index that saw a steep decline, though. As shown in the second chart below, the New Orders component also dropped over 20 points, which was the third largest m/m decline on record. The only times the index saw steeper declines were just after 9/11, after the Lehman bankruptcy, and in November 2010. Start a two-week free trial to Bespoke Institutional to access all of our interactive tools and best stock ideas.
Morning Lineup – Marking Time
It’s a big week on tap for financial markets as the FOMC meets on Tuesday and Wednesday. While odds of a cut at this meeting are low, with the probability of a cut at the July meeting still over 80%, investors will be looking for some direction as to whether those high odds are warranted or misplaced. Ahead of the meeting, investors have been pretty much sitting on their hands for the last several days not wanting to take a stand in either direction.
Please read today’s Morning Lineup for a recap of markets in Asia and Europe overnight and this morning, as well as a dive into the latest export numbers out of Singapore, suggesting that global trade activity remains healthy.
Bespoke Morning Lineup – 6/17/19

As mentioned above, investors have been on the sidelines over the last few days ahead of this Wednesday’s FOMC meeting, and the chart below from page two of the Morning Lineupillustrates that holding pattern. The fact that the S&P 500 and just about every sector have little or no tails on them indicates how little in the way of movement there has been over the last week.

Start a two-week free trial to Bespoke Premium to see today’s full Morning Lineup report. You’ll receive it in your inbox each morning an hour before the open to get your trading day started.
Bespoke Brunch Reads: 6/16/19
Welcome to Bespoke Brunch Reads — a linkfest of the favorite things we read over the past week. The links are mostly market related, but there are some other interesting subjects covered as well. We hope you enjoy the food for thought as a supplement to the research we provide you during the week.
While you’re here, join Bespoke Premium for 3 months for just $95 with our 2019 Annual Outlook special offer.
Climate Change
Indian villages lie empty as drought forces thousands to flee by Sam Relph (The Guardian)
The Indian subcontinent has face punishing pre-monsoon heatwaves this year leaving swathes of the country depopulated and 70-80% of some states hit by drought and/or crop failure, an early taste of the sort of chaos that widespread and persistent climate change could sew around the world. [Link]
Some Republican Lawmakers Break With Party on Climate Change by Arian Campo-Flores (WSJ)
Conservative lawmakers are struggling to come up with a policy proposal that reduces emissions but doesn’t impose regulation or new taxes as a growing share of the party acknowledges vulnerability on the issue. [Link; paywall]
China
Trump Has Gotten China to Lower Its Tariffs. Just Toward Everyone Else. by Chad P. Brown, Euijin Jung, and Evan (Yiwen) Zhang (PIIE)
As China has raised retaliatory tariffs in response to US protectionism, it’s reduced tariffs on other countries, a double-whammy for US exporters. [Link]
The New Tiananmen Papers by Andrew J. Nathan (Foreign Affairs)
Reform-minded protestors evicted by force (including hundreds of deaths) from Tiananmen Square 30 years ago were a massive threat to party power, and how officials reacted is being put in new light by a recently published book summarizing their speeches from a meeting just before the troops marched in. [Link]
Investing
When Everything That Counts Can’t Be Counted by Josh Brown (The Reformed Broker)
What happens if the cost of capital never goes up again? An exploration of the implication that brands are the only sustainable moat against oceans of abundant capital. [Link]
The S&P 500 Is Beating Yale’s Endowment Fund by John Rekenthaler (Morningstar)
Over the most recent 10 year period, the once-hallowed performance of the Yale Endowment Fund hasn’t done any better than a run-of-the-mill target date mutual fund. [Link]
Retirement
Social Security’s looming crisis is political, not economic by Jeff Spross (The Week)
A lucid review of the challenges facing social security, and more importantly, its political rather than economic constraints; inability to pay out benefits is a function of the will to do so in Congress rather than any budget constraint. [Link]
Food & Drink
On the Trail of New York’s Nutcracker Kings by David Gauvey Herbert (Grub Street)
The colorful history of ubiquitous, cheap, and definitely not legal New York summer street libations called “nutcrackers”. [Link]
The restaurant owner who asked for 1-star Yelp reviews by Zachary Crockett (The Hustle)
An Italian chef was sick of the tyranny imposed by Yelp and its legion of finnicky reviewers, so he offered a special discount to anyone who would leave a one star review. [Link]
Media
More U.S. Millennials Subscribe to Video Games Than Traditional Pay TV: Survey (Reuters/NYT)
A recent report by Deloitte (full report link) found that more American millennials pay for gaming services than a traditional paid TV subscription. [Link]
The Day the Music Burned by Jody Rosen (NYT)
A fire caused by roof repair gone wrong spread quickly across the Universal Studios Hollywood lot in June of 2008, taking with it the Universal Music Group’s archive of recorded materials. Master recordings dating back as far as the 1940s were destroyed, an enormous loss of musical history. [Link; soft paywall]
Gentrified Giglio
An Old Brooklyn Church Seeks New Muscle to Save a Tradition by Katie Honan (WSJ)
The unique tradition of hoisting a four-ton tower in celebration of an Italian saint and parading it around Brooklyn is under threat after 116 years: gentrification and population turnover in Brooklyn has reduced the ranks of the parish that does the hoisting. [Link; paywall]
Aviation
This C-17 Crew Broke Diplomatic Protocol to Save a Life. Now They’re Up for Awards by Oriana Pawlyk (Miltary.com)
Faced with a deteriorating patient and a long trip across the Atlantic, the crew of a C-17 Globemaster landed in under 200 feet of visibility in Ireland in order to get the patient to a hospital. [Link]
Education
Despite Rising Costs, College Is Still a Good Investment by Jaison R. Abel and Richard Deitz (NY Fed)
While college costs of spiraled, the wage premium for college grads is still high enough to justify the investment, on average across all students. [Link]
Read Bespoke’s most actionable market research by joining Bespoke Premium today! Get started here.
Have a great weekend!
The Bespoke Report – To Cut, or Not to Cut, That is the Question
We’ve just published our weekly Bespoke Report newsletter, which covers all of the topics you need to be aware of as an investor. After a sharp bounce off the lows on 6/3, the S&P 500 stopped to refuel this week as it readies itself for some key events in the coming weeks that will likely help to steer the market’s direction into the end of the second quarter. The first of those events (barring any surprising tweets from the President) is next week’s FOMC meeting where Jay Powell will be forced to reconcile the differences between what members of his committee have been saying and what the market is expecting for the July meeting.
On the one hand, economic data doesn’t seem anywhere close to warranting a cut in rates, but economic data is obviously backward looking. Members of the FOMC will be forced to weigh the data with other factors like the message of the yield curve, falling inflation, and even more importantly, plummeting inflation expectations. In addition to those factors, Fed officials must also weigh what’s going on with trade. For starters, can rate cuts even do anything to offset the potential drag that comes from tariffs and a potential trade war? In addition to that, a lot of the trade tensions can easily be undone just as easily as they were put into place. What happens if the FOMC cuts rates and trade issues are worked out shortly thereafter? Confused? Just be thankful you don’t have to make the decisions!

To read our full Bespoke Report newsletter and access everything else Bespoke’s research platform has to offer, start a two-week free trial to one of our three membership levels. You won’t be disappointed!

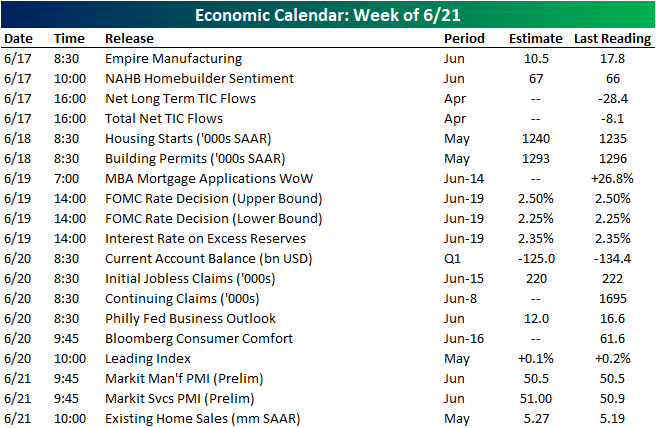
Next Week’s Economic Indicators – 6/14/19
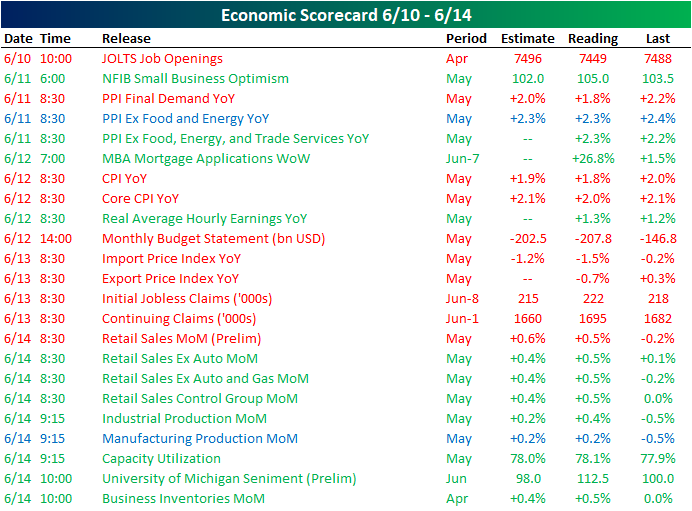
This week’s economic data came out to a slow and disappointing start as the JOLTS report showed fewer job openings in April than expected and was below the March number. That was the only release on Monday, but activity picked up on Tuesday with a strong NFIB Small Business Optimism report, continuing the second longest streak of monthly gains for the indicator (discussed in Tuesday’s Chart of the Day). Producer inflation also came out Tuesday, with a weaker headline print but improved core inflation. Wednesday’s CPI also saw some weakness missing expectations on both headline and core measures. Fortunately, we rounded out the week with a heavy slate on Friday with beats nearly across the board. Retail Sales impressed in addition to the previous month being revised up. Industrial production was also stronger than expected while the University of Michigan consumer sentiment improved to 112.5.
Next week quiets down with only 19 releases. June’s Empire Manufacturing index from the NY Fed kicks things off followed by homebuilder sentiment. Further in housing data, starts and permits will be out Tuesday morning. While starts are expected to rise, permits are forecasting a small downtick. Later in the week on Friday, existing home sales are forecasted to rise to 5.27 mm SAAR homes. On Wednesday, all eyes will be on the FOMC rate decision. Over the past couple of months, markets have increasingly been betting on the FOMC deciding to cut rates at this meeting or (more likely) in the near future. This event should provide some clarity into this situation. We will finish next week with the Leading Index on Thursday and preliminary June Markit PMIs on Friday. Start a two-week free trial to Bespoke Institutional to access our interactive economic indicators monitor and much more.
The Closer: End of Week Charts — 6/14/19
Looking for deeper insight on global markets and economics? In tonight’s Closer sent to Bespoke clients, we recap weekly price action in major asset classes, update economic surprise index data for major economies, chart the weekly Commitment of Traders report from the CFTC, and provide our normal nightly update on ETF performance, volume and price movers, and the Bespoke Market Timing Model. We also take a look at the trend in various developed market FX markets.

The Closer is one of our most popular reports, and you can sign up for a free trial below to see it!
See tonight’s Closer by starting a two-week free trial to Bespoke Institutional now!
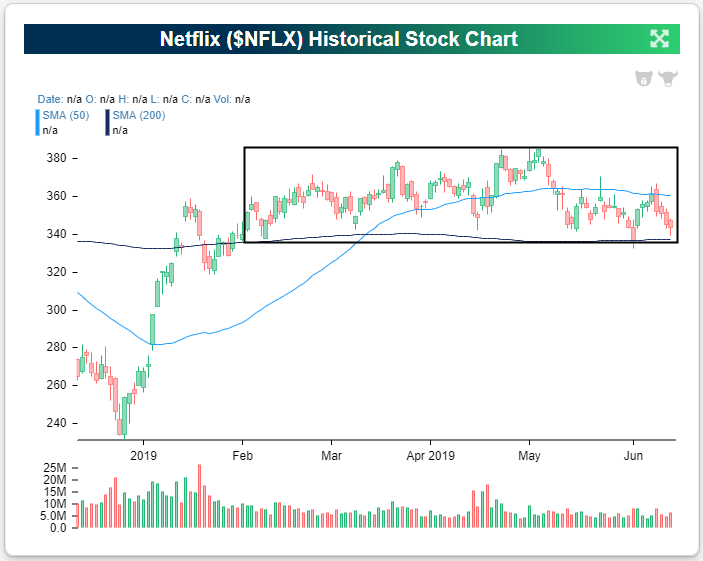
Sideways Netflix (NFLX)?
Netflix (NFLX) is not a stock that usually meanders sideways, but that is exactly what it has done for the past 5+ months. You can see the sideways track that NFLX has taken recently in the chart below pulled from our Security Analysis page that’s available to Bespoke Institutional members.
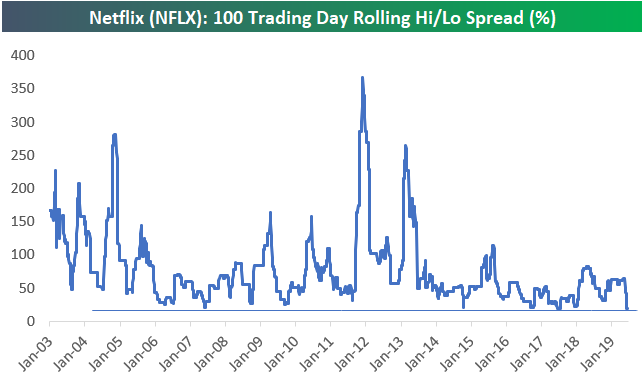
Over the last 100 trading days, the high/low closing spread for Netflix (NFLX) has been 19.5%. Below is a chart showing the rolling 100 trading day high/low spread for NFLX since it IPOd, and as you can see, the current spread is as tight as the stock has seen throughout its history. It could certainly get tighter, but we would expect this stock to break either higher or lower in a big way sometime soon given the long consolidation phase that it’s currently in.
B.I.G. Tips – Retail Sales: Even Stronger Below the Surface
While it may not have looked like anything special based on the weaker than expected headline reading, there actually wasn’t much not to like about May’s Retail Sales report. In addition to being slightly better than expected after stripping out Autos and Gas, April’s report was revised significantly higher.
The table below shows monthly streaks of gains or losses for each of the sectors tracked in the Retail Sales report. Here we can see how broad and consistent the strength has been in Retail Sales after taking revisions into account. Five sectors have seen m/m growth for five straight months, and no group has seen more than one straight month of decline. Bars and Restaurants are one group that has seen sales growth for five consecutive months, and while it has yet to overtake Food and Beverage Stores in terms of its total share of sales, it’s getting close.
We just published our monthly update to key trends in this month’s Retail Sales report. To see the report, sign up for a monthly Bespoke Premium membership now!

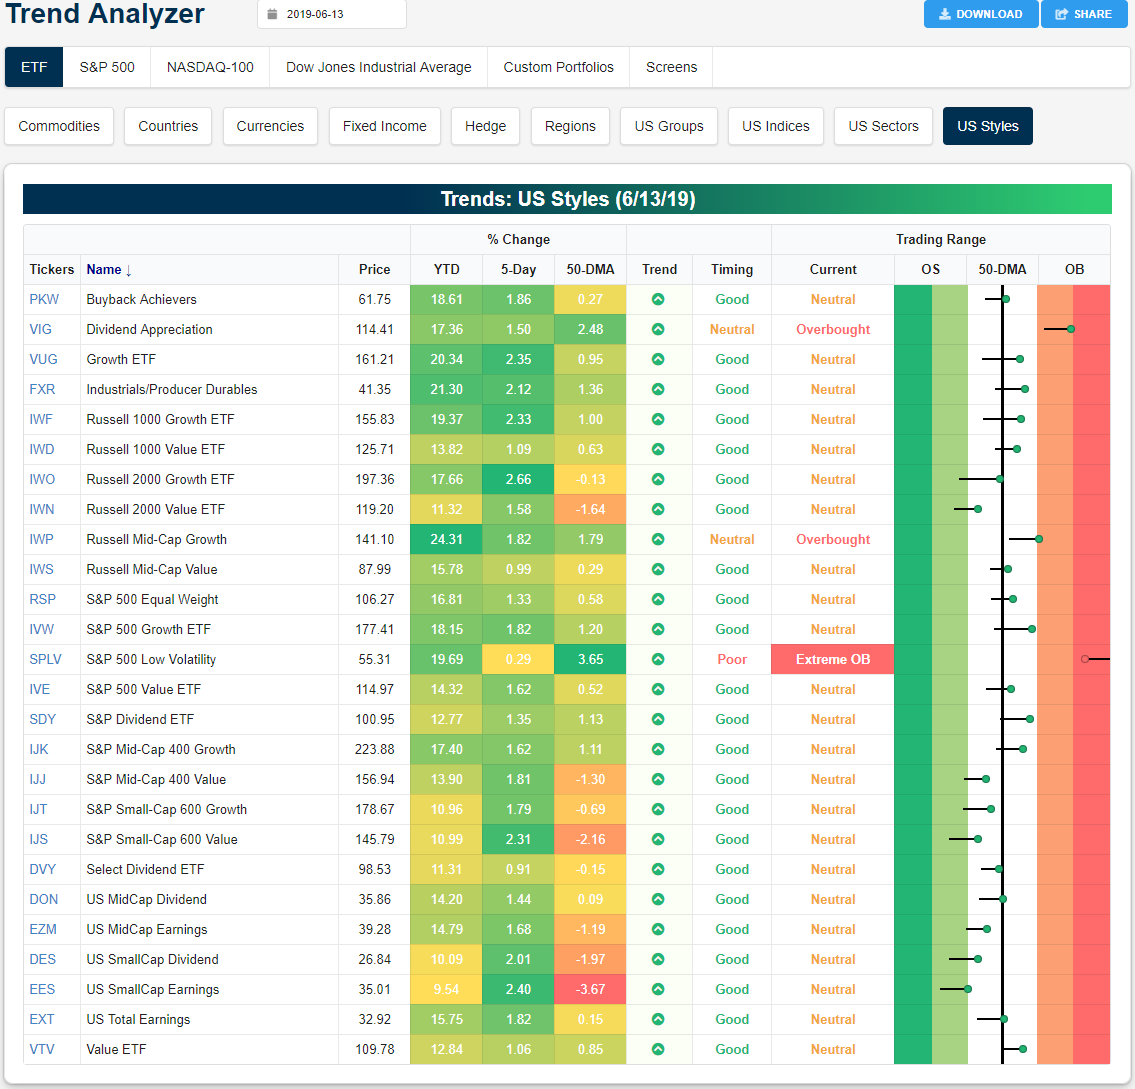
Trend Analyzer – 6/14/19 – Growth and Earnings Outperform
One week ago, small-caps—like the Micro-Cap ETF (IWC), Russell 2000 (IWM), and Core S&P Small Cap (IJR)—and the Nasdaq (QQQ) had all been unable to move out of oversold territory like the other major index ETFs. That has changed this week as all of the US index ETFs tracked in our Trend Analyzer tool are currently neutral. While they have moved out of oversold, small-caps are still lagging in the sense that they remain the furthest below the 50-DMA. Other indices either sit just below or have broken above in the past week. The Nasdaq has seen the most notable move towards the 50-day, surging 3.27% out of oversold territory. A weak earnings report from Broadcom (AVGO) last night has put pressure on the semis, and as a result, the broader technology sector and a tech-heavy Nasdaq. This is likely to eat into some of these gains today so it may take a bit longer until QQQ takes out the 50-day.

Over the past week, like the major index ETFs, the different style ETFs are almost entirely sitting at neutral. Although, there are some outliers like the S&P Low Volatility (SPLV) which is working its way out of extreme overbought levels (presumably as a flight to safety following May declines). One trend this week but also generally in 2019 to take note of is the outperformance of growth stocks versus value. Broadly speaking, the growth-focused ETFs like the Growth ETF (VUG) have been outperforming their value-focused peers by around 1% in the past week. This is the case across most of the indices and market caps, though, S&P Small and Mid Cap have seen slight outperformance of value. This is more evident in small caps. Additionally, earnings has been outpacing dividend-focused ETFs. Start a two-week free trial to Bespoke Institutional to access our interactive economic indicators monitor and much more.