Fixed Income Weekly – 6/19/19
Searching for ways to better understand the fixed income space or looking for actionable ideas in this asset class? Bespoke’s Fixed Income Weekly provides an update on rates and credit every Wednesday. We start off with a fresh piece of analysis driven by what’s in the headlines or driving the market in a given week. We then provide charts of how US Treasury futures and rates are trading, before moving on to a summary of recent fixed income ETF performance, short-term interest rates including money market funds, and a trade idea. We summarize changes and recent developments for a variety of yield curves (UST, bund, Eurodollar, US breakeven inflation and Bespoke’s Global Yield Curve) before finishing with a review of recent UST yield curve changes, spread changes for major credit products and international bonds, and 1 year return profiles for a cross section of the fixed income world.
In this week’s report we review the effects of the dovish speech by ECB President Draghi yesterday.

Our Fixed Income Weekly helps investors stay on top of fixed income markets and gain new perspective on the developments in interest rates. You can sign up for a Bespoke research trial below to see this week’s report and everything else Bespoke publishes free for the next two weeks!
Click here and start a 14-day free trial to Bespoke Institutional to see our newest Fixed Income Weekly now!
Chart of the Day – Tired of Losing!
Fed Day Weakness is Something Investors Aren’t Used To
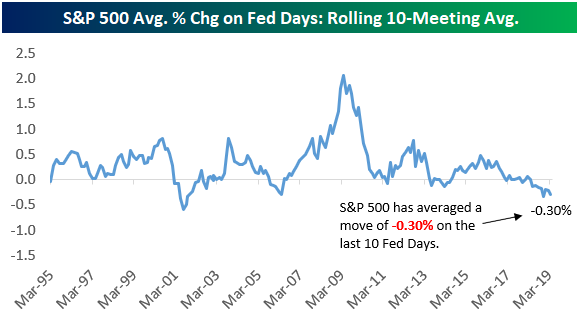
Bespoke publishes an in-depth look at the market’s historical performance on Fed Days prior to each FOMC meeting. One of the things we note each time is how well the S&P 500 has historically done on Fed Days since 1994 when the Fed began announcing its policy decisions on the same day as its meetings. (Prior to 1994, the Fed’s decisions were not released immediately, so the stock market did not have any Fed news to react to on meeting days.) Historically, the S&P has averaged a one-day gain of nearly 30 basis points on Fed Days. That’s 10x as strong as the average one-day change of 0.03% that the S&P has experienced on all trading days throughout history.
But gains on Fed Days have been few and far between lately. Below we show the average one-day change for the S&P 500 over the last 10 Fed Days, and we roll the 10 Fed Day reading back to 1994. As shown, the current average one-day change of -0.30% for the S&P over the last 10 Fed Days is very negative by historical standards. There have only been two prior periods (early 2001 and early 2006) where the average was lower than it is now.
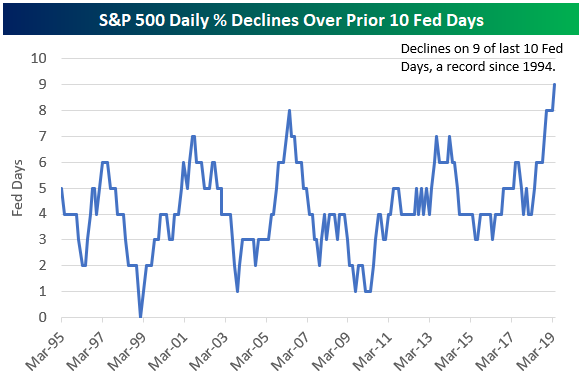
The 10 Fed Day average for the S&P is not being weighed down by just one or two extremely negative one-day moves. In fact, the S&P has declined on nine of the last ten Fed Days! As shown below, there has never been a prior 10 Fed Day period where the S&P declined on at least nine of those days. And coincidentally (?), 10 Fed Days ago was when Fed Chair Powell first took the helm! As we noted in today’s Morning Lineup ahead of the open, Powell is going to have to break out of this rut at some point! Start a two week free trial to one of Bespoke’s premium memberships to access our suite of investment tools and daily equity market research.
Trend Analyzer – 6/19/19 – Edge of Overbought
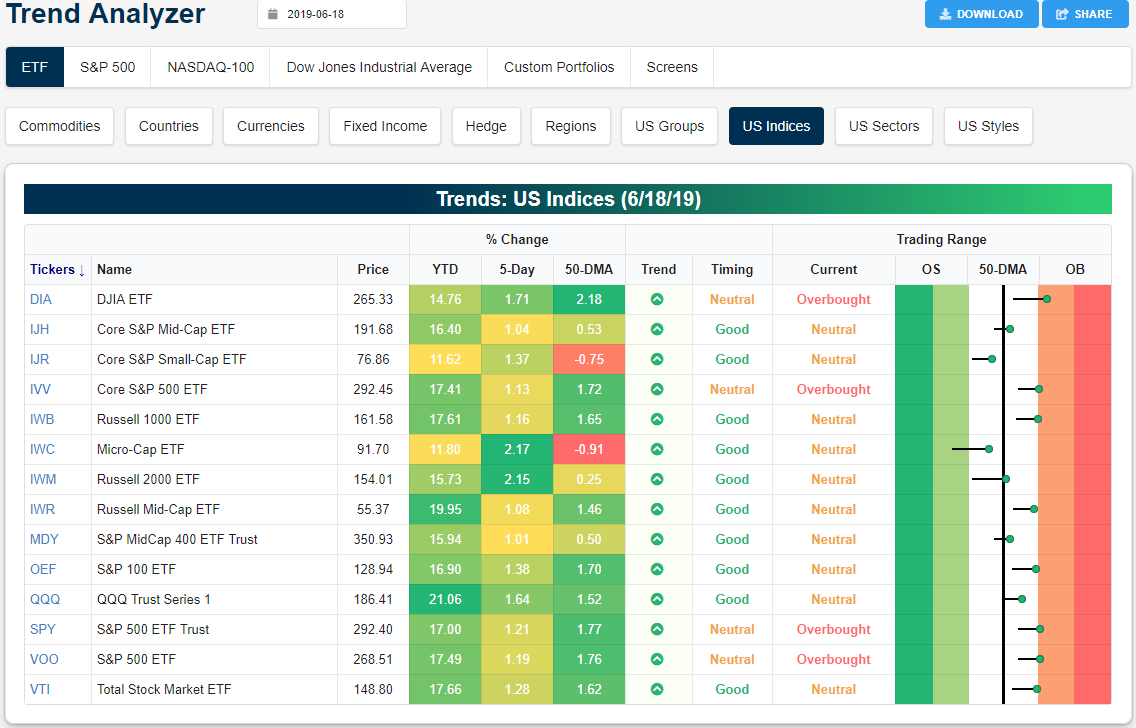
The surge for stocks yesterday in response to dovish ECB comments and potential progress on the trade front has lifted the major US large-cap index ETFs to overbought levels. The Dow and each of the ETFs tracking the S&P 500 (IVV, SPY, VOO) are now all overbought while the rest of the major index ETFs remain neutral. While these large-cap ETFs have moved into overbought range, they aren’t extended too far into extreme territory yet. A number of other ETFs like the Russell 1000 (IWB), the S&P 100 (OEF), and Total Stock Market ETF (VTI) are all teetering on becoming overbought. The movements to these levels have been pretty rapid over the past week as seen through the fairly large tails in the Trading Range section of our Trend Analyzer. For reference, the dot represents where each ETF is currently trading within its range, while the tail end represents where it was trading one week ago.
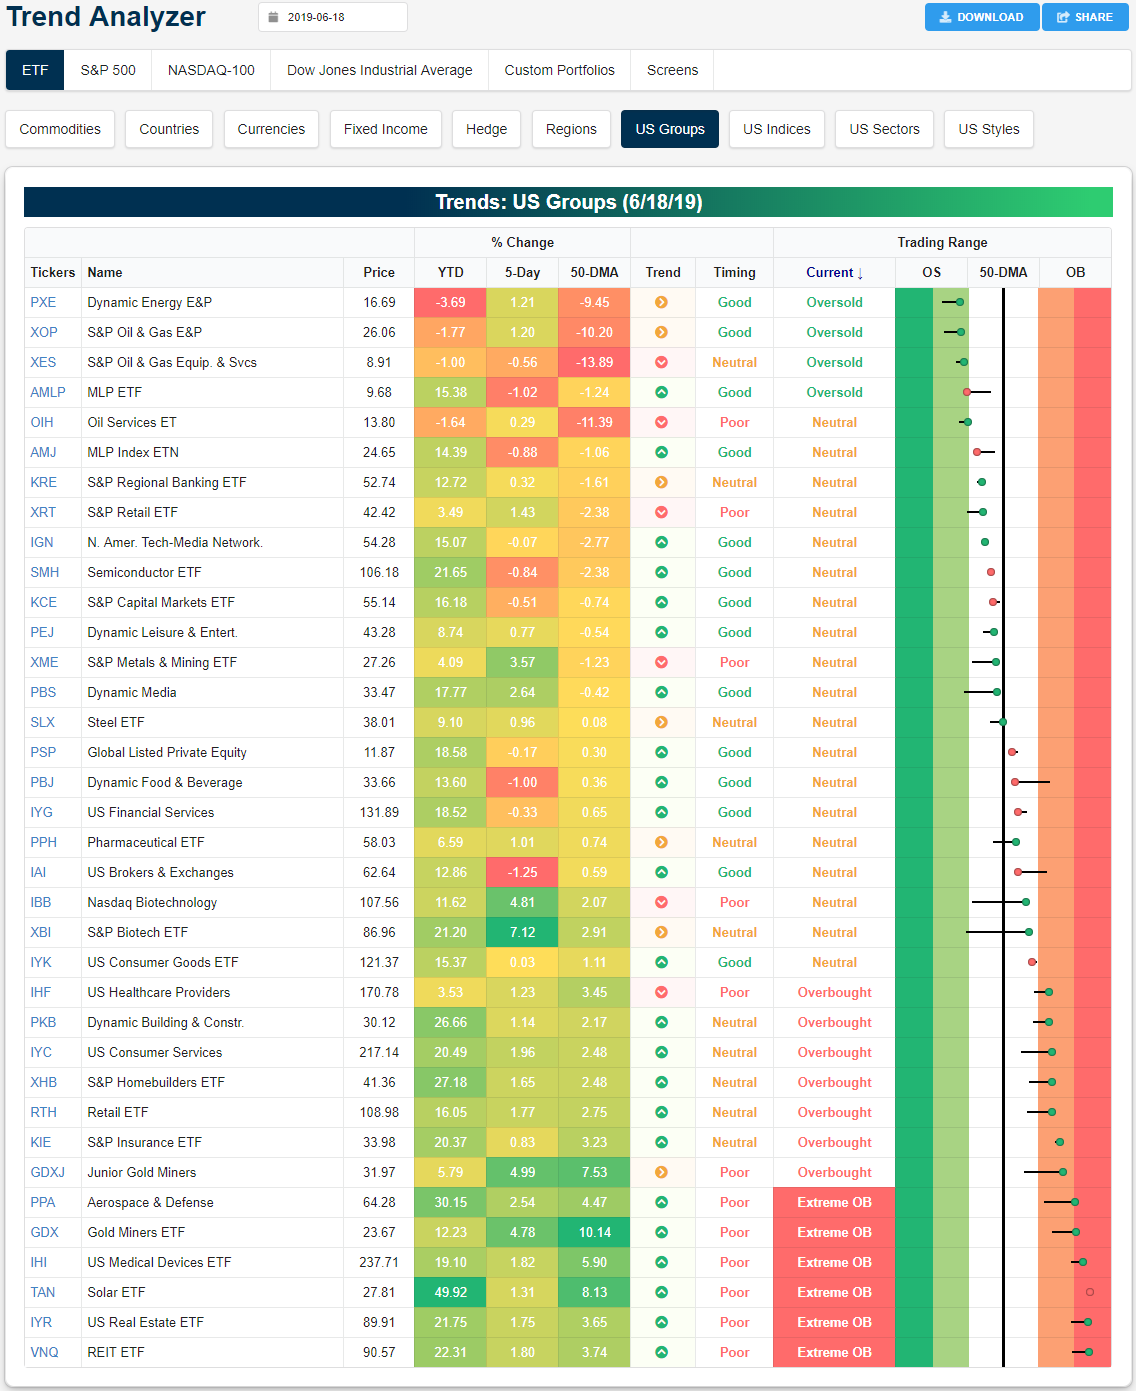
Looking at the individual industry group ETFs, like small caps, biotech ETFs have been handily outperforming. The Nasdaq Biotechnology ETF (IBB) has risen 4.81% in the past week while the S&P Biotech ETF (XBI) has surged even more with a 7.12% gain. A large portion of these gains have come in the past few days following Pfizer’s (PFE) announcement of an acquisition of Array BioPharma (ARRY). Now firmly neutral and above the 50-DMA, these two biotech ETFs were at or just above oversold levels only a week ago. Gold miners have also been performing well as GDXJ and GDX have both rallied nearly 5% in the past week. While this leads them to be fairly overbought (GDX just barely to an extreme), real estate has actually been running even hotter. Despite middling gains versus the rest of the industry group ETFs in the past week, the US Real Estate ETF (IYR) and REIT ETF (VNQ) are both the most overbought of the industries as has been the case for the past few days. Start a two-week free trial to Bespoke Institutional to access our entire suite of investment tools and all of our daily research.
Bespoke’s Global Macro Dashboard — 6/19/19
Bespoke’s Global Macro Dashboard is a high-level summary of 22 major economies from around the world. For each country, we provide charts of local equity market prices, relative performance versus global equities, price to earnings ratios, dividend yields, economic growth, unemployment, retail sales and industrial production growth, inflation, money supply, spot FX performance versus the dollar, policy rate, and ten year local government bond yield interest rates. The report is intended as a tool for both reference and idea generation. It’s clients’ first stop for basic background info on how a given economy is performing, and what issues are driving the narrative for that economy. The dashboard helps you get up to speed on and keep track of the basics for the most important economies around the world, informing starting points for further research and risk management. It’s published weekly every Wednesday at the Bespoke Institutional membership level.
You can access our Global Macro Dashboard by starting a 14-day free trial to Bespoke Institutional now!

Morning Lineup – Quiet Ahead of Fed
Markets are on the quiet side this morning as traders await the big interest rate policy statement from the FOMC along with the latest updates to their economic forecasts and Fed Chair Powell’s press conference. Asian equities traded higher in reaction to yesterday’s strength in the US, and European markets are trading on either side of the flatline. With regards to the FOMC. we would note that since Powell stepped into his role as Fed chief, there has only been one meeting day (out of ten) where stocks finished in positive territory for the day. He’s going to have to break out of this rut at some point!
Please read today’s Morning Lineup for a recap of overnight moves in Asian markets, the latest export data out of Japan, and economic data in Europe.
Bespoke Morning Lineup – 6/19/19

Semis rallied over 4% on Tuesday as the Philadelphia Semiconductor Index had its best day since late January. We’ve discussed the leadership traits of the semis in terms of their relative strength versus the S&P 500 a lot over the months, and that leadership was tested earlier this week as the group now looks (for now) to have successfully tested its lows from earlier this month. They’re still not in the clear, but this afternoon’s Fed meeting and the upcoming US-China talks at the G-20 are sure to play a role in how things play out.

Start a two-week free trial to Bespoke Premium to see today’s full Morning Lineup report. You’ll receive it in your inbox each morning an hour before the open to get your trading day started.
The Closer – Low VIX Cuts, Risk Asset Rally, Housing Starts, Homebuilders – 6/18/19
Log-in here if you’re a member with access to the Closer.
Looking for deeper insight on markets? In tonight’s Closer sent to Bespoke Institutional clients, ahead of tomorrow’s FOMC rate decision, we take a look at previous rate cuts when the VIC looked similar to how it does today. We also show could be in store for the forward performance of equities and WTI given today’s rally. Next, with the ECB’s dovishness and positive trade headlines, we show today’s movement in credit and EMFX markets. Finishing with a bit of economic data, we recap today’s slightly stronger residential construction data and show how some Homebuilder stocks have been performing.

See today’s post-market Closer and everything else Bespoke publishes by starting a 14-day free trial to Bespoke Institutional today!
Bespoke Stock Scores — 6/18/19
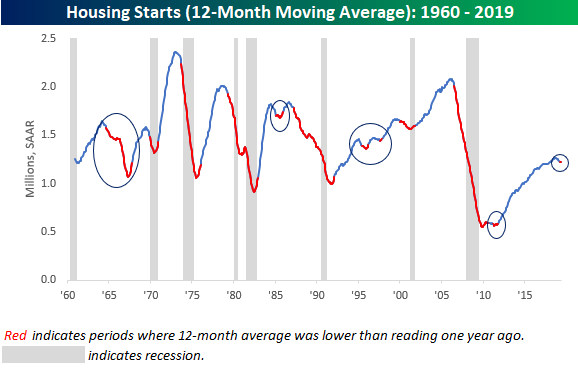
Starts Starting to Roll
It has now been 15 months since Housing Starts last made a new high, and despite the fact that they seem to have stabilized, on a 12-month average basis, they are showing signs of rolling over. With residential housing being such a large share of the economy, we wanted to show how a rollover in Housing Starts fits in with the economic cycle. The chart below shows Housing Starts on a 12-month rolling average basis. In it, we have overlaid recessions in gray and colored the line red whenever the reading hit a one-year low. Looking at the chart, there wasn’t a single recession where the 12-month average reading in Housing Starts wasn’t at 12-month lows heading into the recession. There were, however, a number of ‘false positives’ where the 12-month average had rolled over and no recession followed before Starts started to rebound again. Those occurrences were in the mid-1960s, mid-1980s, mid-1990s (2 periods) and during the early stages of this expansion in 2011. So while the slowdown in Housing Starts is reflective of slower overall growth, it hardly guarantees a recession is around the corner. One trait that these ‘false-positive’ periods do have in common, though, is that during all five of them, the FOMC was easing monetary policy during or shortly after the 12-month low readings in Housing Starts.
Given the volatility in multi-family units, we also ran this analysis using single-family Housing Starts, but here again, the results are similar. While single-family starts have typically already started to roll over well in advance of recessions, not all rollovers in single-family starts have been followed by recessions. Start a two-week free trial to Bespoke Institutional to access our entire suite of investment tools and all of our daily research.
