Bespoke Stock Scores — 6/25/19
That Was Bad
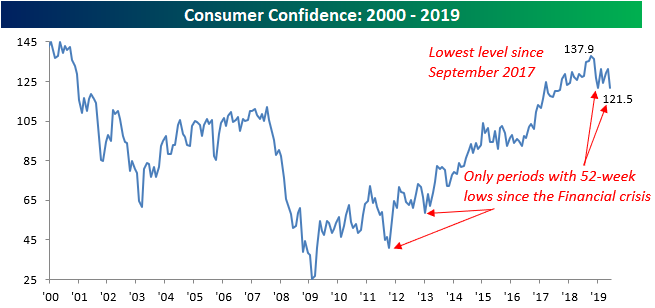
Consumer Confidence for the month of June missed expectations by a mile this morning as the headline reading dropped from 131.3 down to 121.5. That 9.8 point decline is tied with last December for the largest m/m decline since August 2011. Not only was the decline notable, but the magnitude of the miss relative to expectations (121.5 vs 131.0) was the largest since June 2010. While headlines surrounding trade and Iran can understandably hurt sentiment, the fact that the stock market was bouncing off the June 3rd lows during this period and had no positive impact was notable. This month’s reading in the headline index of the Consumer Confidence report was also the lowest since September 2017 and only the fourth period since the Financial Crisis that the index dropped to a 52-week low.
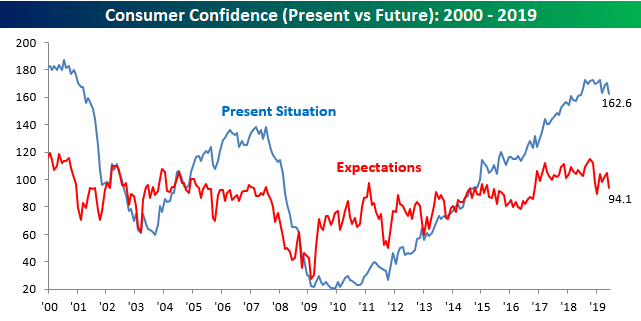
In terms of the breakout between Present Situation and Expectations, both indices saw similar declines in June.
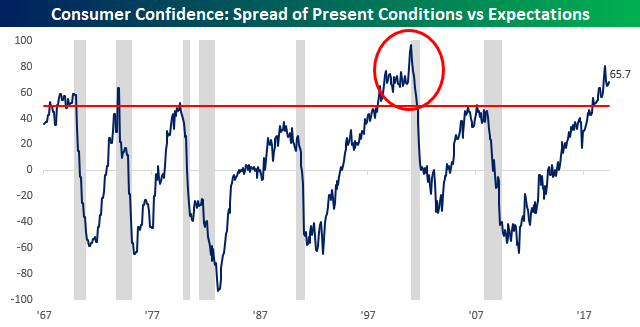
With both indices seeing similar declines, the spread between the two was little changed and remains extremely elevated and at levels that have typically been seen leading up to recessions.
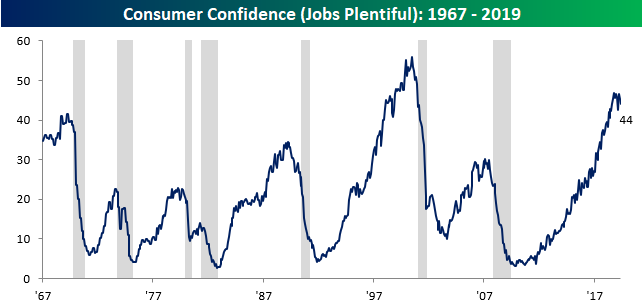
While the spread between Present Conditions and Expectations is worrisome, the percentage of consumers responding that jobs are plentiful didn’t see as large of a decline, falling from 45.3 down to a three-month low of 44.0.
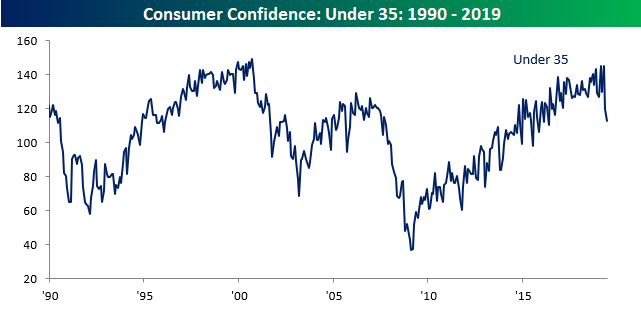
Finally, while there may not have been much of a decline in the percentage of consumers viewing jobs as being plentiful, young consumers have seen a sharp drop in confidence levels. While we saw across the board declines in confidence by age group, consumers under the age of 35 have seen the sharpest declines falling to the lowest levels since May 2016. Start a two-week free trial to one of our three membership levels to stay on top of all the economic trends and developments.
The Comeback Stock of the Decade: Microsoft (MSFT)
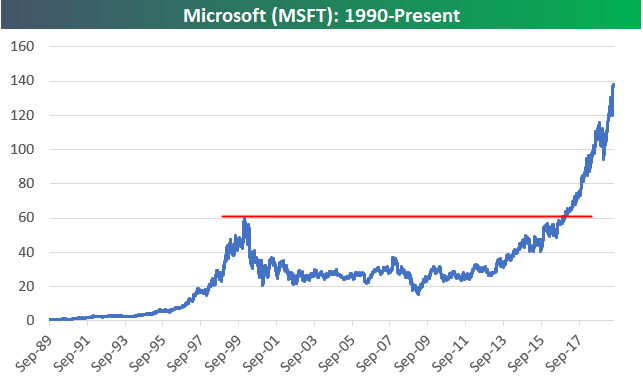
After winning the 90s by having its Windows operating system on the large majority of PCs, Microsoft (MSFT) experienced a lost decade in the 2000s. From its peak in December 1999 to its trough in March 2009, Microsoft (MSFT) fell 75%! Throughout the 2000s, “Mr. Softy” as it was called was considered “dead money,” and it was all but forgotten by momentum and growth investors.
If there was an award given out for “Comeback Stock of the Decade,” there’s no doubt that MSFT would be an odds on favorite for the 2010s. After missing out on search and social media, MSFT hit a homerun with its transition from a traditional software company to a “software as a service” (SaaS) cloud company.
The long-term price chart for MSFT is something to behold. While the stock experienced bigger gains in percentage terms during its run in the 1990s, its sheer price move this decade totally dwarfs the 90s move at this point. The point at which MSFT really took off was after it finally broke above its 1999 highs back in late 2016. This is one of the best examples you’ll find of a breakout from a long-term base.
Since its Financial Crisis low in 2009, MSFT’s price has moved up 809%. Since breaking out above its 1999 highs in late 2016, the stock has more than doubled with a gain of 131%, making it the largest company in the world once again with a market cap of $1.06 trillion!
Unfortunately for those that missed out on MSFT’s epic comeback decade (which is most investors), the chart below is certainly not one you would want to go out and buy right now! You certainly can’t make the argument that you’d be “buying low.” Start a two-week free trial to one of our three membership levels for access to our premium research.
Yield Curve Rejected at the 50-DMA…Again
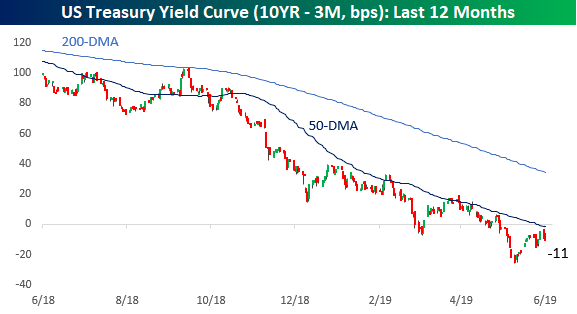
After moving down as low as -25 basis points (bps) earlier this month, the yield curve (the spread between the yield on the 10-year and 3-month US Treasuries) looked like it was going to move back into positive territory closing out last week. That was until the 50-day moving average came into play. On Friday, the yield curve finished the week inverted by less than 5 bps, but today it’s back inverted to the tune of 11 bps. Looking at the chart below, the latest experience with the 50-DMA looks to be just one in a series of times in the last year where the yield curve has stalled out at or near the 50-DMA. What will it be that breaks this trend? A larger than expected rate cut from the FOMC or a sharp increase in rates at the long end of the curve? Start a two-week free trial to Bespoke Institutional to access our interactive tools and much more.
Trend Analyzer – 6/25/19 – Small Caps and the Moving Average
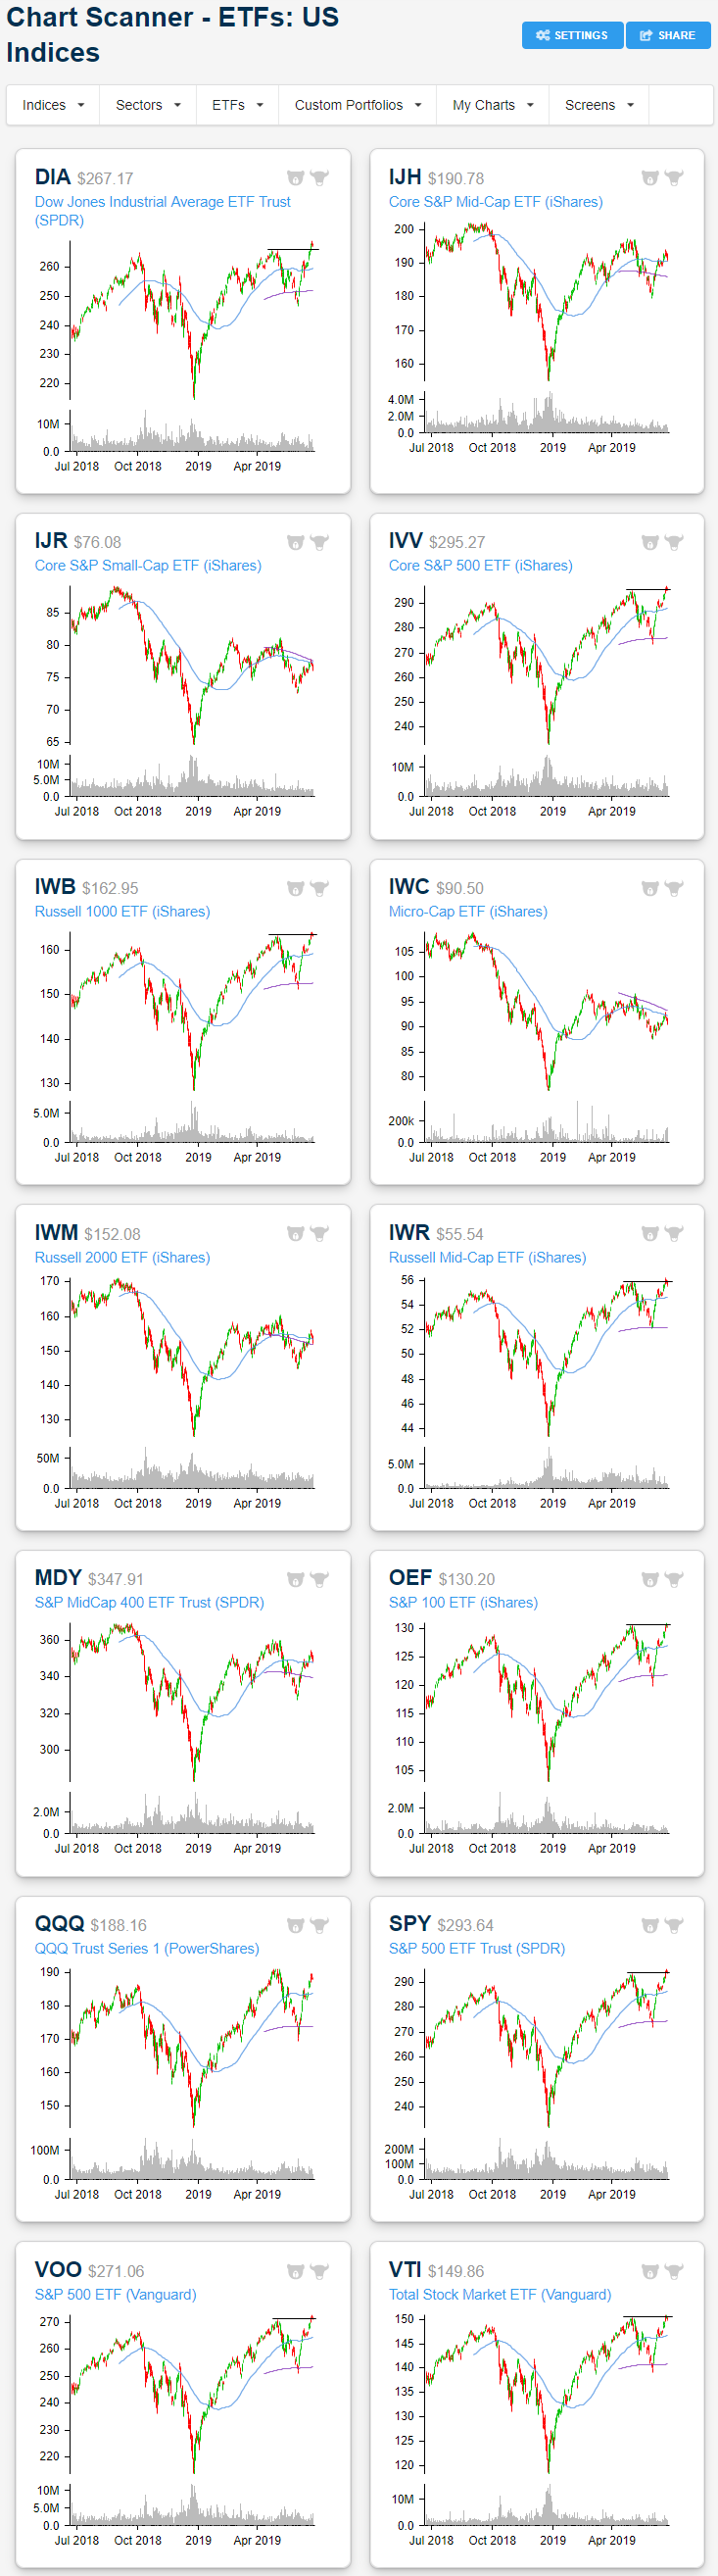
The fourteen ETFs tracking the major US indices in our Trend Analyzer tool are still split down the middle with half overbought and the other half neutral. While large-cap ETFs are overbought after sitting at neutral last week, conditions are less overbought and closer to the 50-DMA with declines over the past two sessions. Weekly performance is still solid though with most of these ETFs up just under 2%. The Nasdaq (QQQ) and Dow (DIA) have actually outperformed with even larger gains of 2.41% and 2.34%, respectively. With this, DIA has become the most extended above the 50-DMA. Small caps, meanwhile, have continued to lag behind. The Micro-Cap ETF (IWC) and Russell 2000 (IWM) are both down over the past week. In fact, IWC is just barely sitting above oversold levels. While not in the red, mid-caps like the Core S&P Mid-Cap ETF (IJH) and S&P Mid-Cap 400 (MDY) have also been fairly week relative to other market caps.
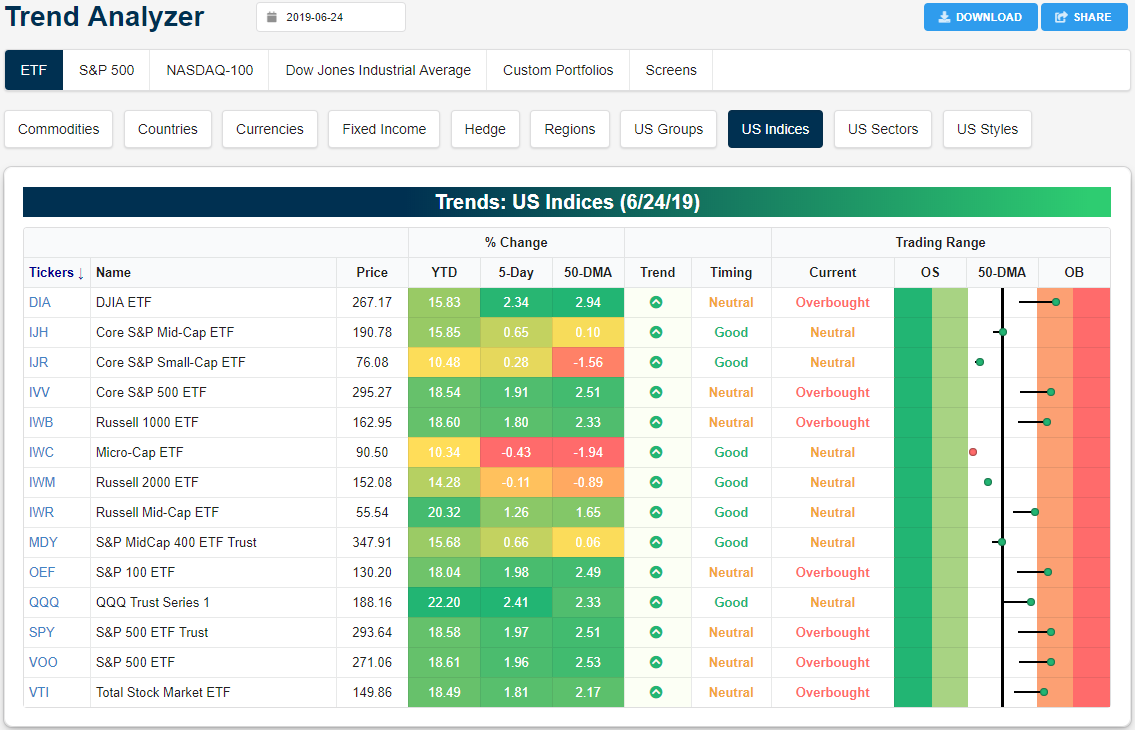
Looking at the charts of these same ETFs, with declines in the past couple of sessions bringing the ETFs off of new highs, former resistance at previous highs has not necessarily held as support for indices like the S&P 500 (SPY). Only the Dow (DIA) is still sitting noticeably above these prior highs. Doubling back on smaller-cap ETFs’ recent weakness, others like the Russell 1000 (IWB) and Russell Mid Cap (IWR) have more clearly broken below these levels. Additionally, for these ETFs, the failure to take out both the 200 and 50-day moving averages is pretty clear. Each sits below these averages, despite some like the Core S&P Mid-Cap ETF (IJH) and Russell 2000 (IWM) managing to close above both the 200 and 50-day last week. Start a two-week free trial to Bespoke Institutional to access our interactive Trend Analyzer, Chart Scanner, and much more.
Morning Lineup – Flat-line
It’s hard to remember a time in recent memory when futures were as muted as they have been this morning. For the last three hours now, Dow futures have essentially been in a range of indicating an open of +/- 15 points from yesterday’s close! There’s not much incentive to do anything major, though, as many traders appear content to sit on their hands ahead of this weekend’s G-20 meeting where both sides seem to be actively lowering expectations ahead of the meeting. Things could get a little more interesting for the rest of the day, though, as five FOMC voters (including Powell) are scheduled to speak today.
Please read today’s Morning Lineup to get caught up on everything you need to know ahead of the new trading day including a look at Gold’s overbought levels, the weak UK Retail Sales earlier today, and weak manufacturing confidence out of France.
Bespoke Morning Lineup – 6/25/19

As mentioned above, there’s going to be a lot of Fed commentary on the wires today, beginning with Williams coming up in a few minutes. The big one, though, will be Powell, who is scheduled to speak at 1PM New York time. Besides the Fed speak, we have some important economic data, including the Richmond Fed, which will likely be weak on the heels of the very disappointing prints from New York, Philly, and Dallas. Besides that, New Home Sales are expected to show a modest increase, while Consumer Confidence is expected to dip from last month’s print of 134.1.

Start a two-week free trial to Bespoke Premium to see today’s full Morning Lineup report. You’ll receive it in your inbox each morning an hour before the open to get your trading day started.
The Closer – Moving Average Hurdling, Manufacturing Stumbling – 6/24/19
Log-in here if you’re a member with access to the Closer.
Looking for deeper insight on markets? In tonight’s Closer sent to Bespoke Institutional clients, we begin with a look at forward returns when investment grade credit makes 52-week lows and the price action in small caps and EURUSD in reference to their moving averages. We also show models using credit spreads, rates, and Citi Economic Surprise indices as inputs to predict EURUSD and bank movements. Turning to economic data, we recap today’s surprisingly weak Dallas Fed Manufacturing Activity Index and what it means for our Five Fed Composite. We finish with a glance at Mexican economic activity.

See today’s post-market Closer and everything else Bespoke publishes by starting a 14-day free trial to Bespoke Institutional today!
Bitcoin Soars and Retail Investors Pile In
Bitcoin has been in massive rally mode for pretty much of all 2019, but the pace of gains has really accelerated in the last several days. While the price briefly topped $11,000 earlier, prices have pulled back slightly to just under that level now. Even with the pullback from earlier highs, though. year to date, bitcoin is up just about 200%, while in the month of June, the gain has already been just under 30%.
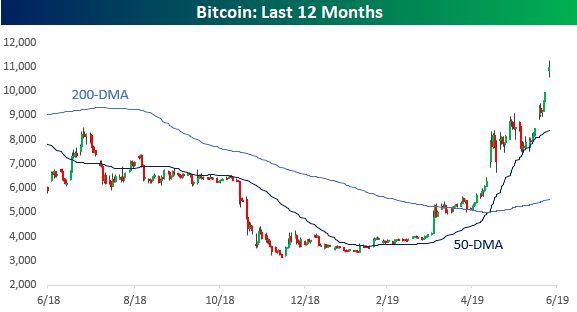
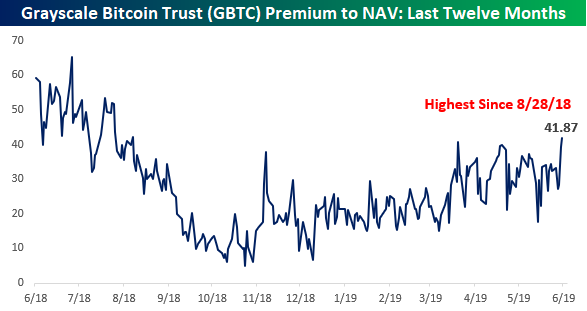
As prices have started to run up in recent days, retail enthusiasm for bitcoin has predictably increased. Because acquiring bitcoin isn’t nearly as simple of a process as buying traditional stocks, bonds, or other currencies, for many investors it simply isn’t worth the bother. One easier (and much more expensive) way to gain exposure to bitcoin, though, is through the Grayscale Bitcoin Trust (GBTC) which is the only ETF-like security that tracks the price of bitcoin. One major drawback to GBTC is that it is a very expensive way to trade bitcoin. Not only does the Trust charge a 2% annual fee, but it also traditionally trades at a massive premium to the actual value of the bitcoin held in the trust. Over the last year, for example, GBTC has traded at an average premium to NAV of 27%. That means that if you liquidated the Trust, the value of the assets would be worth considerably less than the price that the trust is trading at.
Because of the management fee and the fact that the trust trades at such a premium to NAV, it’s widely assumed that most of the buyers and sellers of GBTC are more retail-oriented as opposed to serious bitcoin investors. Therefore, when the premium to NAV is relatively low, it indicates that so-called retail interest in bitcoin is low, while higher premiums represent retail interest on the rise. With that in mind, a look at the recent trend in the trust’s premium to NAV suggests that retail investors have been increasingly warming up to bitcoin as prices rise. At the current level of 42%, GBTC’s premium is the highest since last August. While that’s a ten-month high, the premium was consistently higher in the first half of last year, and back when the retail frenzy over bitcoin was at its peak in early 2018, the premium topped 80%. Sentiment on the part of retail investors has been on the rise, but they aren’t quite yet going ga-ga for bitcoin. Start a two-week free trial to Bespoke Institutional to access our interactive tools and much more.
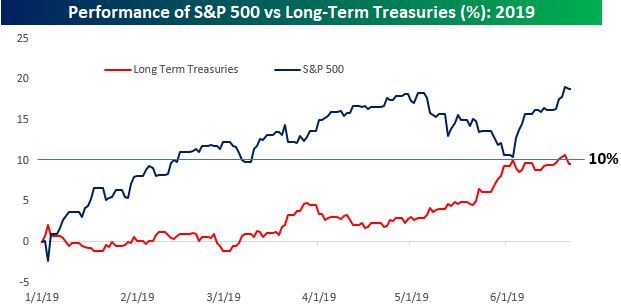
B.I.G. Tips – Stocks and Treasuries Both Capping Off a Strong First Half
While the relationship between the performance of equities and US Treasuries has changed over time, throughout most of the bull market in equities off the March 2009 lows, positive equity performance has coincided with weaker performance in Treasuries and vice versa. This year has bucked that trend. While the S&P 500 has rallied nearly 19% on a total return basis, long-term Treasuries, as measured by the Merrill Lynch Long-Term Treasury index, have rallied just under 10% and were actually up over 10% on the year through last Thursday’s close. In our latest B.I.G. Tips report, we provided an analysis of prior years where equities and long-term treasuries both saw strong first half returns to see if there were any discernible trends for the second half. To see the report, sign up for a monthly Bespoke Premium membership now!
Bespoke CNBC Appearance (6/24)
Bespoke co-founder Paul Hickey appeared on CNBC Squawk Box on Monday (6/24) to discuss our outlook for Emerging markets. To view the segment, click on the image below. Start a two-week free trial to Bespoke Institutional to access our interactive tools and much more.
