Trend Analyzer – 7/2/19 – Overbought in a Day
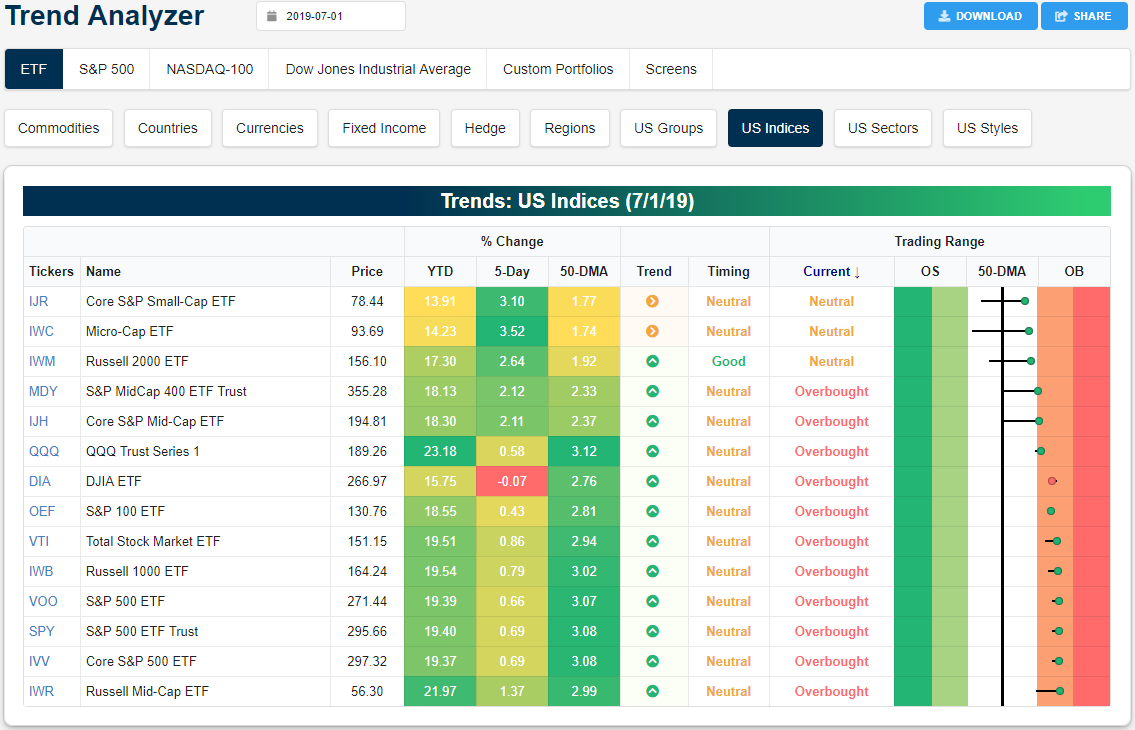
With equities surging to new all-time highs yesterday, several more major index ETFs joined the overbought club as those that are still neutral have also come increasingly close to overbought levels. Whereas most of these ETFs had been sitting in the red versus one week ago yesterday, today only the Dow (DIA) sits lower by 7 bps. Other large caps have done better but are also underperforming as the S&P 100 (OEF) and Nasdaq (QQQ) have the second and third worst gains in this time. Meanwhile, small caps have begun to surge from beneath the 50-DMA. The Core S&P Small Cap (IJR) and Micro-Cap (IWC) both have risen well over 3% now in the past week. Another small-cap index, the Russell 2000 (IWM), has also rallied through the 50-DMA but on a smaller gain of 2.64%.
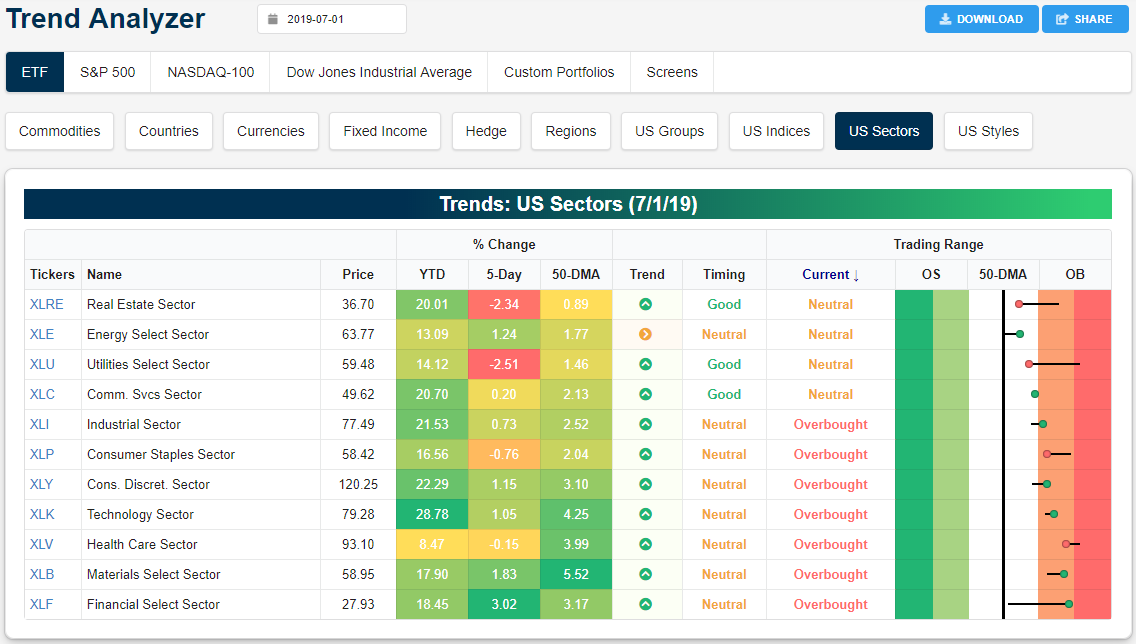
In the past couple months, defensive sectors have been rallying to new highs while more cyclical sectors continued to sit below their previous highs. There is now starting to be some rotation away from defensives and into cyclicals. For most of June and into last week, Utilities (XLU) had been trading at very overbought levels but XLU has finally seen some mean reversion. It has fallen 2.51% in the past week bringing it only 1.46% above the 50-DMA and moved back into neutral territory. Real Estate (XLRE) is a similar story now down 2.34% over the past five days after hovering around extreme overbought levels for a solid portion of last month. Granted, XLRE and XLU are now at the bottom of their recent uptrends earning them a good timing score.
Inversely, Financials (XLF) have been ripping higher after major financial plays got the all clear in last week’s stress tests. This has sent the sector higher by over 3% from just above the 50-DMA. The sector has approached extremely overbought territory in a very short span of time. Right on XLF’s heels in terms of overbought/oversold levels is Materials (XLB). The second best performer in the past week, XLB has gotten a boost from trade tailwinds over the weekend as it finished yesterday at the highs of the day. Start a two-week free trial to Bespoke Institutional to access our Trend Analyzer tool and much more.
Bespoke Matrix of Economic Indicators: 7/2/19
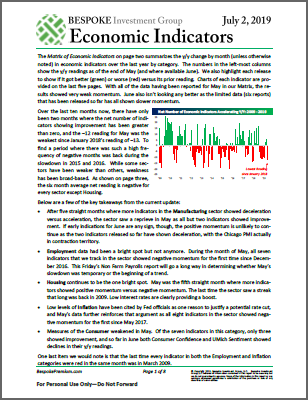
Our Matrix of Economic Indicators is the perfect summary analysis of the US economy. We combine trends across the dozens and dozens of economic indicators in various categories like manufacturing, employment, housing, the consumer, and inflation to provide a directional overview of the economy.
To access our newest Matrix of Economic Indicators, start a two-week free trial to either Bespoke Premium or Bespoke Institutional now!
Morning Lineup – No Fireworks Yet
Quiet is the word this morning. There are no major economic reports on the calendar, no major earnings releases, and little in the way of volatility in overseas markets. China and Japan were basically flat overnight, most of Europe is little changed, and the yield on the 10-year Treasury is unchanged from yesterday. Even bitcoin is down just 4% after several days of 10%+ daily moves. The only major news headlines concern tariff threats (what else is new), but this time on European imports, and then talk that Saudi Aramco is looking to revive the IPO process.
Read today’s Morning Lineup to get caught up on news and stock specific events ahead of the trading day, as well as updated charts on the technical state of the market.
Bespoke Morning Lineup – 7/2/19

One indicator we track in order to asses the internal health of the market is the percentage of S&P 500 stocks hitting 52-week highs on a daily basis. In June, there were two days where the daily percentage of stocks hitting new highs clocked in at a healthy 20%, but in yesterday’s rally to new highs, the percentage of stocks that hit new highs only got as high as 11.9%, which is a relatively weak reading for a day when the S&P 500 breaks out to all-time highs. Going forward, we will be looking for stronger readings, especially on a positive market day like Monday.
In terms of the percentage of stocks in the ‘pipeline’ for new highs, the chart below summarizes where S&P 500 components finished yesterday relative to their 52-week highs. 20% of S&P 500 components are currently within 2% of a 52-week high (red bar), while another 21% are more than 2% but less than 5%, so on a strong market day there is certainly the potential for new highs to surge, but with futures indicating a slightly lower open, it’s unlikely we will see that surge today.

Start a two-week free trial to Bespoke Premium to see today’s full Morning Lineup report. You’ll receive it in your inbox each morning an hour before the open to get your trading day started.
The Closer – Decile Analysis, Sector Weightings, ISM Beat – 7/1/19
Log-in here if you’re a member with access to the Closer.
Looking for deeper insight on markets? In tonight’s Closer sent to Bespoke Institutional clients, we provide our decile analysis of the S&P 500 for the month of June. We also look to see how sectors that perform best or worst in the 1st half of the year typically perform in the 2nd half. We update S&P 500 sector weightings and how they changed in the first half, and we finish the report off with a look at today’s better than expected ISM Manufacturing report.

See today’s post-market Closer and everything else Bespoke publishes by starting a 14-day free trial to Bespoke Institutional today!
Broadly Weak Manufacturing Data
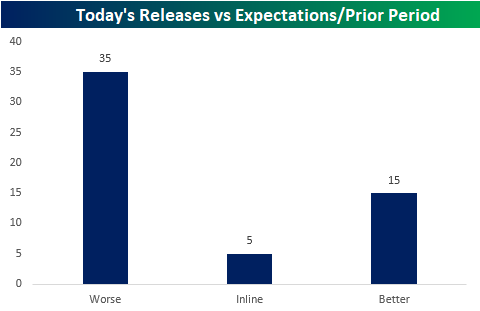
There was a huge slug of data out from all around the world overnight and today. The results did not live up to expectations as the majority (35 data points) came in either worse than forecasts or worse than the previous period. Meanwhile, five met expectations or were unchanged and fifteen indicators saw improvement.
The data slate over the past 24 hours was primarily comprised of manufacturing data including final June Markit PMIs, the ISM PMI in the US, and Japanese Tankan indices. Of all the manufacturing data points out today, over three quarters came in below expectations or worse than the previous period (highlighted in red in the Global Economic Scorecard below). The Americas and Australia at least provided some relief as the US, Mexico, Brazil, and Australia were the only bright spots for Markit PMIs. Each saw the opposite result of the rest of the world with beats. Granted, the picture is a bit more muddied taking other indicators into account. Australia’s AIG Performance of Manufacturing index was weaker and the US’s ISM PMI also had some weak spots despite a headline beat. ISM Prices Paid came in with a contractionary reading and ISM New Orders also weakened to a flatline reading of 50. Japanese data was similarly mixed in the quarterly results for Tankan indices. While the data was generally worse, large manufacturers were a silver lining given a better than expected reading for outlook. Additionally, non-manufacturing data for these same Tankan indices held up better than their manufacturing counterparts. Later this week (beginning tomorrow night into Wednesday) we will see other non-manufacturing data with the release of Markit Service PMIs from around the globe. Subscribers can use our Economic Monitors help to keep track of all of the day’s economic releases domestic and abroad. Start a two-week free trial to Bespoke Institutional to access our interactive economic monitor and much more.
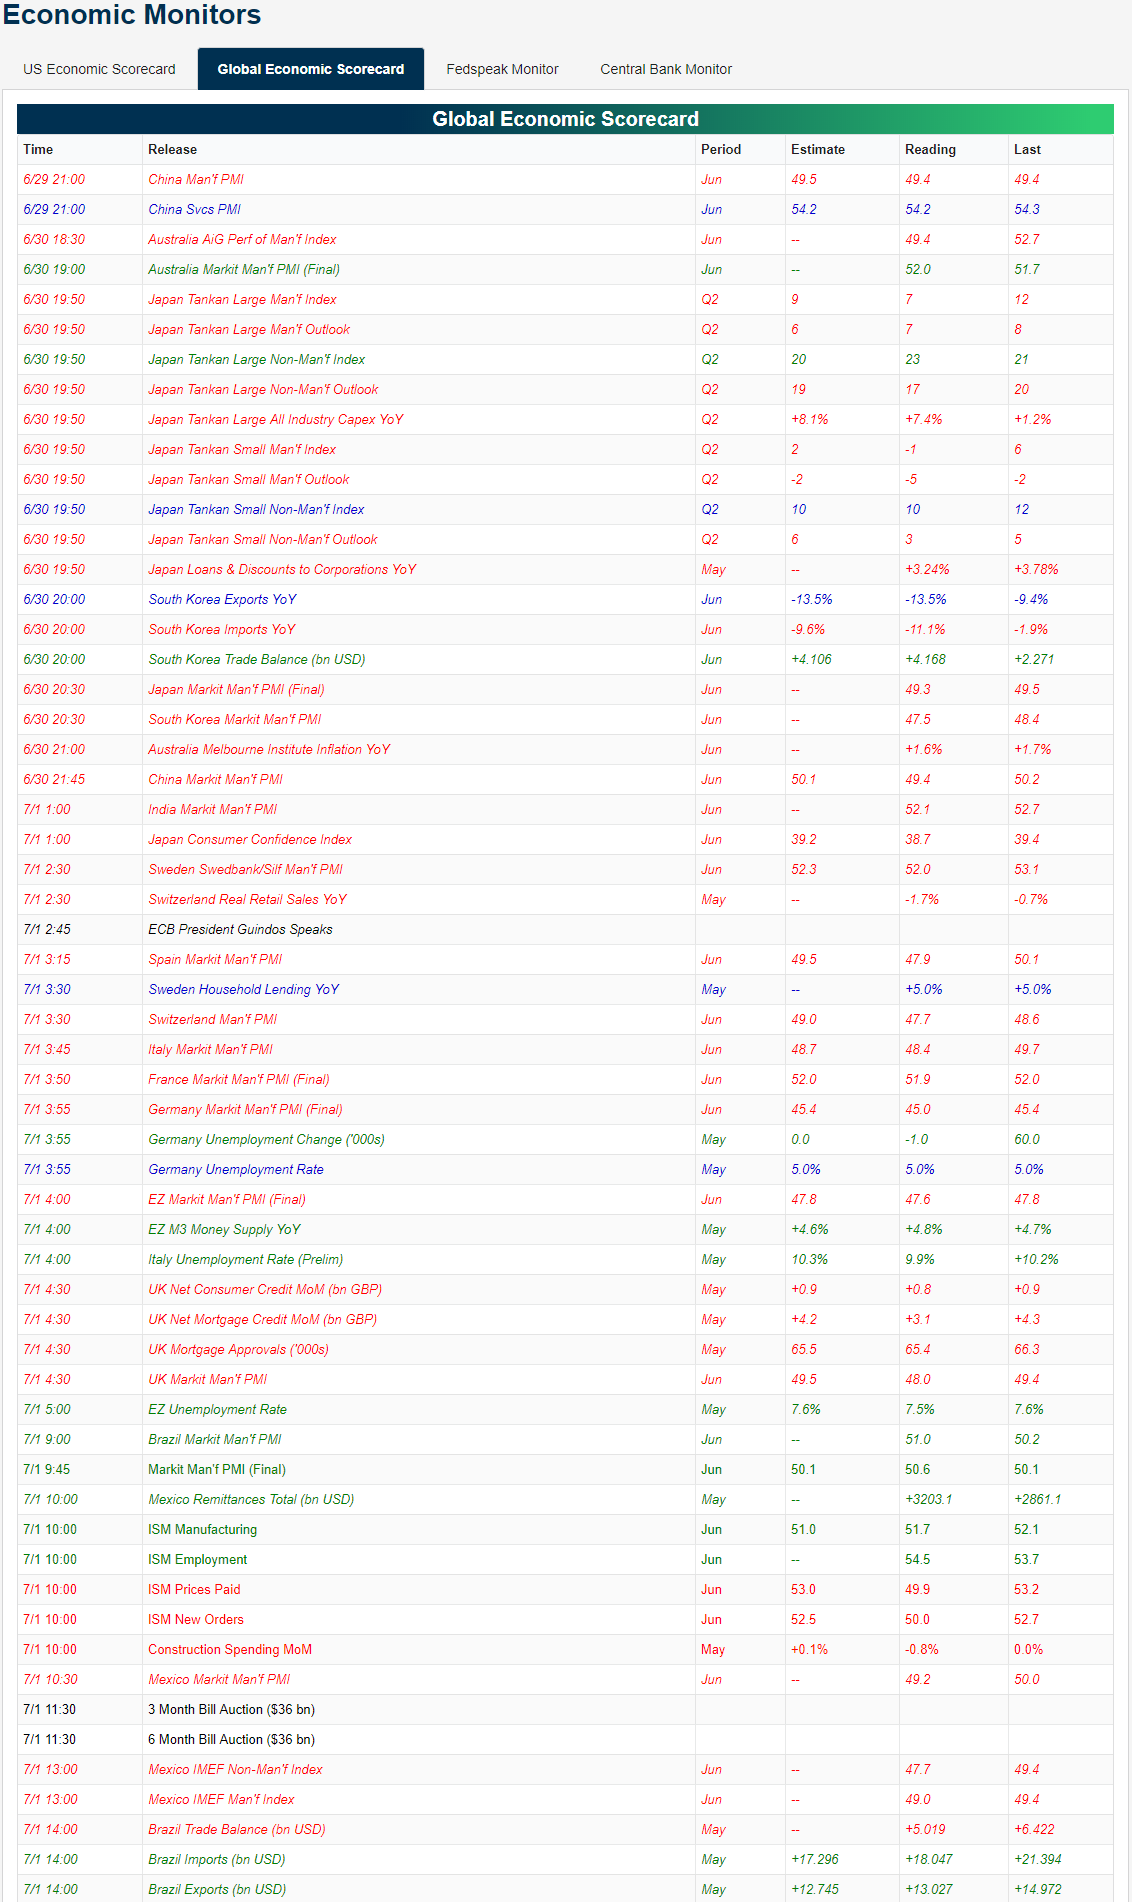
Chart of the Day: Stocks vs Bonds
June 2019 Headlines
Trend Analyzer – 7/1/19 – Strong End of June, Strong Start to July
After finishing the session higher on Friday to cap off a strong June and first half of 2019, conditions have not necessarily become overly extended as the major indices work their way back all-time highs. Only half of the 14 the major index ETFs are overbought while the rest are neutral. These overbought ETFs are primarily comprised of large caps including the Dow (DIA), S&P 500 (SPY), and Russell 1000 (IWB). Meanwhile, distancing itself from some of its peers, the Nasdaq (QQQ) was the worst performer last week and has actually fallen out of overbought territory. Now sitting at neutral, QQQ is actually one of the least overbought ETFs of this group.
While large caps are mostly overbought, they are down versus one week ago, and as such, less extended than they were a week ago as well. The red dots and tails to the right in our Trend Analyzer tool show this slight pullback off of more overbought levels. On the other hand, small and mid-caps outperformed last week as each saw a gain of over 1%—save the Russell Mid Cap (IWR) which only rose 0.09% as it is also the most overbought index ETF. The Micro Cap (IWC) and Core S&P Small Cap (IJR) were the strongest performers rising over 1.7%, taking out the 50-DMA in the process. Despite the short term performance for these two, the long term trend is still sideways.

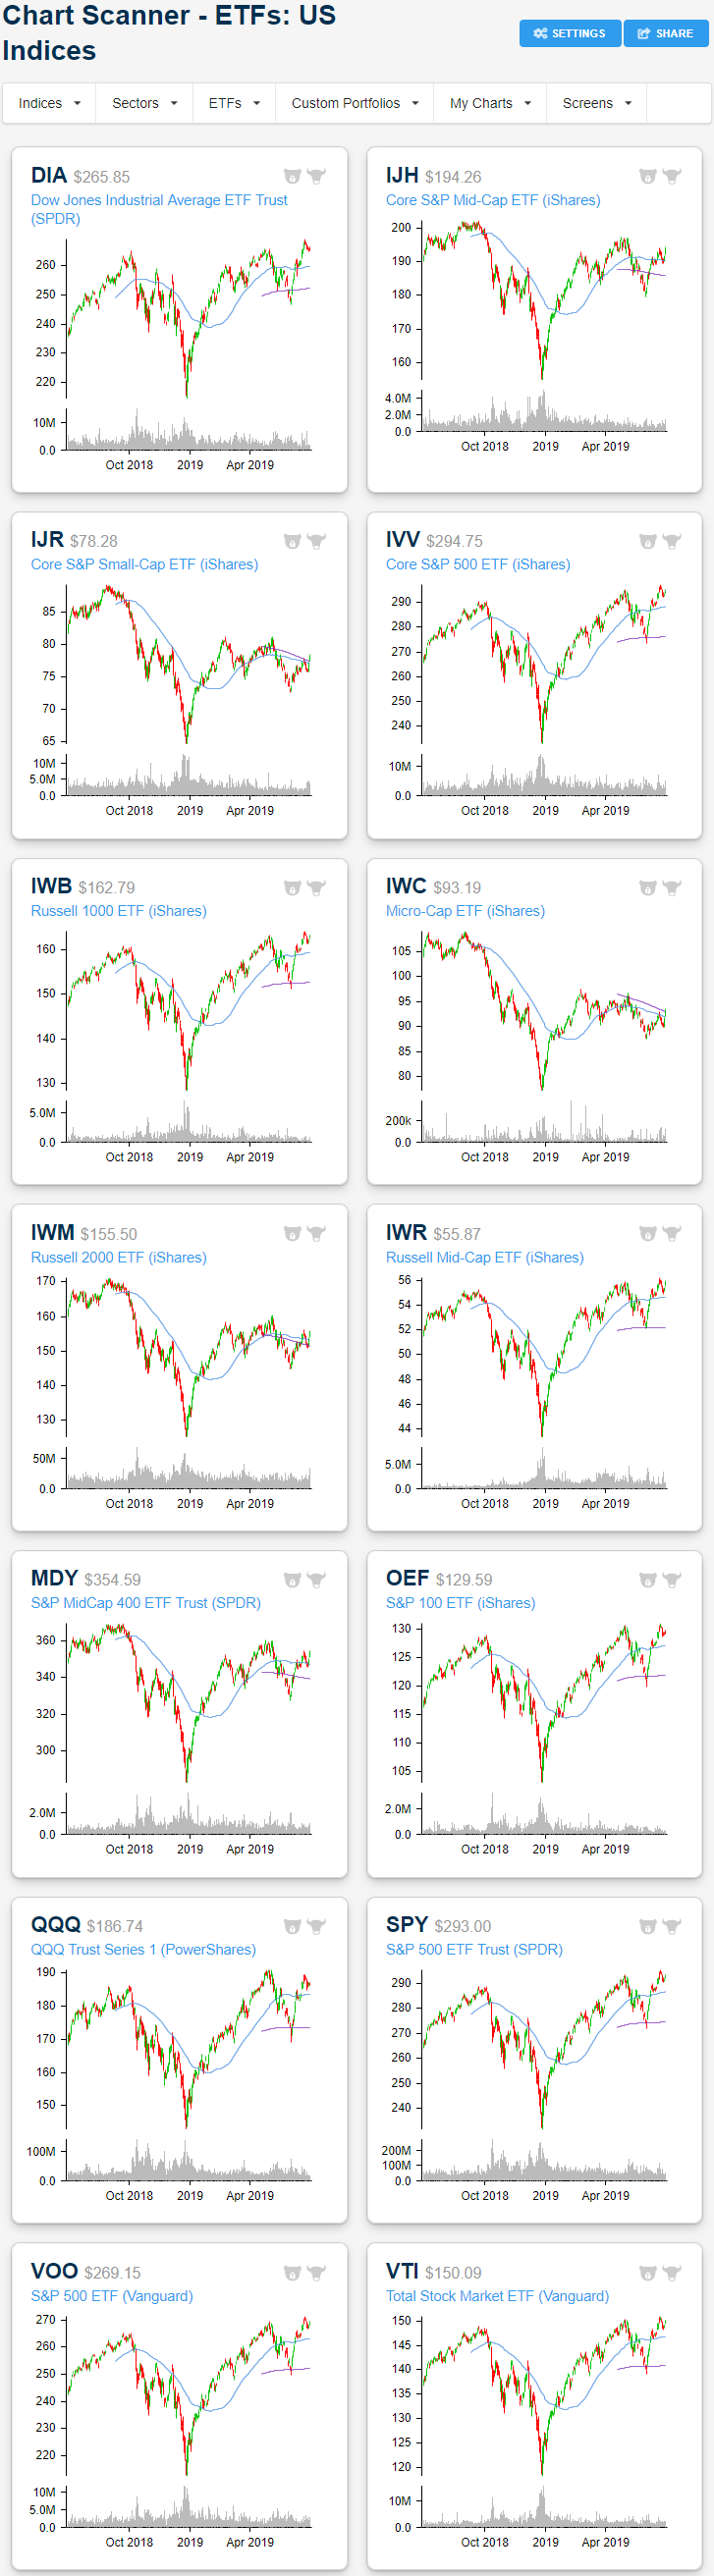
Following geopolitical progress made this past weekend at the G-20 summit, S&P 500 futures have gapped up to all-time highs leading to what will likely be a sizable gap up for other indices at the open as well. As shown in the charts from our Chart Scanner tool below, another gap up will lead some of these index ETFs back up towards their all-time or prior highs. A number of index ETFs reached new highs in the past couple of weeks in the form of both all-time highs for the Dow (DIA) and the S&P 500 (SPY) as well as lower highs like the S&P MidCap 400 (MDY). The major indices once again reaching these highs would be a positive sign for stocks. Similarly, late last week, the small cap IWC and IWM both managed to see some positive technical developments in taking out both the 200 and 50-DMA. Currently, none of the major index ETFs sit below either the 200 or 50-day. Start a two-week free trial to Bespoke Institutional to access our Trend Analyzer tool and much more.
Bespoke ETF Matrix — First Half Asset Class Total Returns
The S&P 500 (SPY) gained 7% on a total return basis in June, leaving it up 18.37% on the year at the halfway mark. The Nasdaq 100 (QQQ) gained 21.54% in the first half, while the Dow was more than 6 percentage points weaker at +15.18%. Mid-caps performed about inline with large-caps in the first half, while small-caps underperformed slightly.
Looking at S&P sectors, Energy (XLE) had a very strong June, but that still wasn’t enough to put it in positive territory for the entirety of the second quarter. Materials (XLB) was the best sector in June with a gain of 11.57%, while Utilities (XLU) was up the least in June at +3.18%. For the first half, Tech (XLK) was up the most at +26.89%. The Tech sector was actually the best performing ETF in the entire matrix in the first half of 2019.
Outside of the US, every country gained in June except India (PIN), which was down 1.44%. For the second quarter and the full first half, Russia (RSX) was the best-performing country. In Q2, RSX gained 14.71%, while the ETF gained 26.03% for the full first half.
Oil (USO) was up 24.53% in the first half, while natural gas (UNG) was down 19.51%. Gold was up 9.86% in the first half, but silver (SLV) was actually down 1.31%.
Finally, Treasury ETFs posted solid returns across the board in the first half, with the 20+ Year (TLT) gaining more than 10%. Start a two-week free trial to Bespoke Premium to see our just-published Mid-Year Outlook report.

Morning Lineup – And They’re Off!
It’s hard to imagine a stronger way to start off the second quarter as US equities and risk assets around the world are surging following what is being billed as a cease-fire in the US-China trade war and President Trump’s meeting with North Korean leader Kim Jung-Un over the weekend.
While the news surrounding trade has been positive, the reality on the ground remains less optimistic. Manufacturing PMIs for the month of June continued to show weakness around the world, and this morning’s ISM Manufacturing report for the US will kick off a busy week of economic data in the US that will go a long way in determining whether the market is correct in its pricing of 100% certainty that the FOMC will cut rates at the end of the month.
Read today’s Morning Lineup to get caught up on everything you need to know ahead of the new trading day including a recap of overnight trading in Asia and Europe as well as a rundown of all economic data released.
Bespoke Morning Lineup – 7/1/19
The S&P 500 SPY ETF is set to gap up more than 1% this Monday morning, so we wanted to highlight a few stats surrounding similar types of moves.
Since 1993 when SPY began trading, there have been 255 gaps up of 1%+, which accounts for 3.8% of all trading days. On these 255 days, SPY has averaged a further gain of 0.20% from the open to the close of trading after the initial jump at the open.
Today is also a Monday morning, and there have been 49 Monday mornings since 1993 in which SPY began the trading week with a 1%+ jump at the open. On these 49 Mondays, SPY has averaged a further gain of 0.18% from the open to the close of trading. Notably, though, returns one week from the open following Monday gaps up of 1% have been poor, with SPY down an average of 1.12% five days later.
It’s also the first trading day of the month. Since 1993, SPY has gapped up 1%+ on the first trading day of the month 16 prior times, which is about 5% of the time. The average open to close change on these days has been positive at +0.34%.
And what about Monday gaps up of 1%+ to start a new month? That has happened 9 times since 1993, which is 7.4% of the time. On these 9 trading days, SPY has basically been flat from the open to the close of trading.
Finally, there have been just 4 starts to a new quarter that have seen 1%+ gaps higher at the open for SPY, and on these 4 days, SPY has continued higher from open to close twice (50%). Five days later, though, SPY has been higher every time.
Today would be the first time in its history that SPY has gapped up 1%+ at the open on the first trading day of July.

Start a two-week free trial to Bespoke Premium to see today’s full Morning Lineup report. You’ll receive it in your inbox each morning an hour before the open to get your trading day started.