Trend Analyzer – 7/3/19 – Solar (TAN) Keeps Running
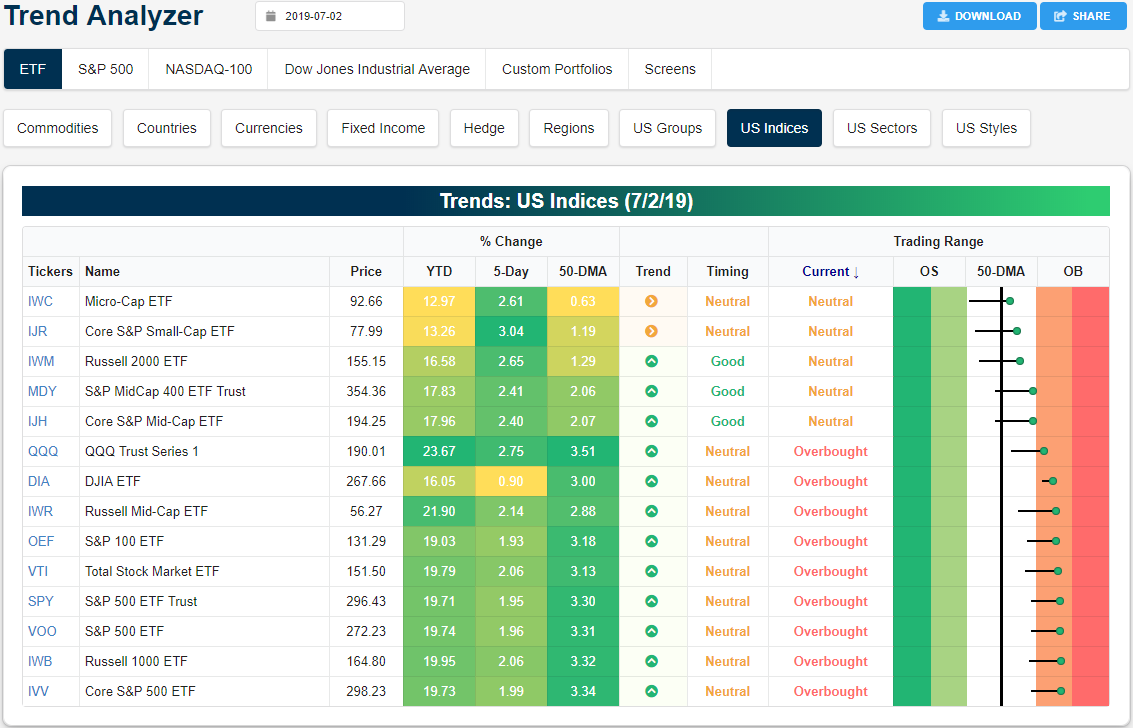
Gains have been strong across the board over the past week as the S&P 500 (SPY) finished at another all-time high yesterday. The only significant laggard has been the Dow (DIA) as it sits 0.9% higher from last Tuesday’s close. Otherwise, each of the major index ETFs has risen upwards of 3%. Small and mid caps have outperformed while the performance of large caps has been somewhat weaker. The Core S&P Small Cap (IJR) has done the best rising by 3.04%. The next best ETF is the Nasdaq (QQQ) with a 2.75% gain. In spite of these gains in the past week, there are actually fewer ETFs sitting at overbought levels than yesterday. Whereas there were 11 overbought major index ETFs at yesterday’s open, today there are only 9 as the S&P MidCap 400 (MDY) and Core S&P Mid-Cap (IJH) both moved to neutral on modest declines. Given their uptrends, this also gives them a good timing score in our Trend Analyzer tool.
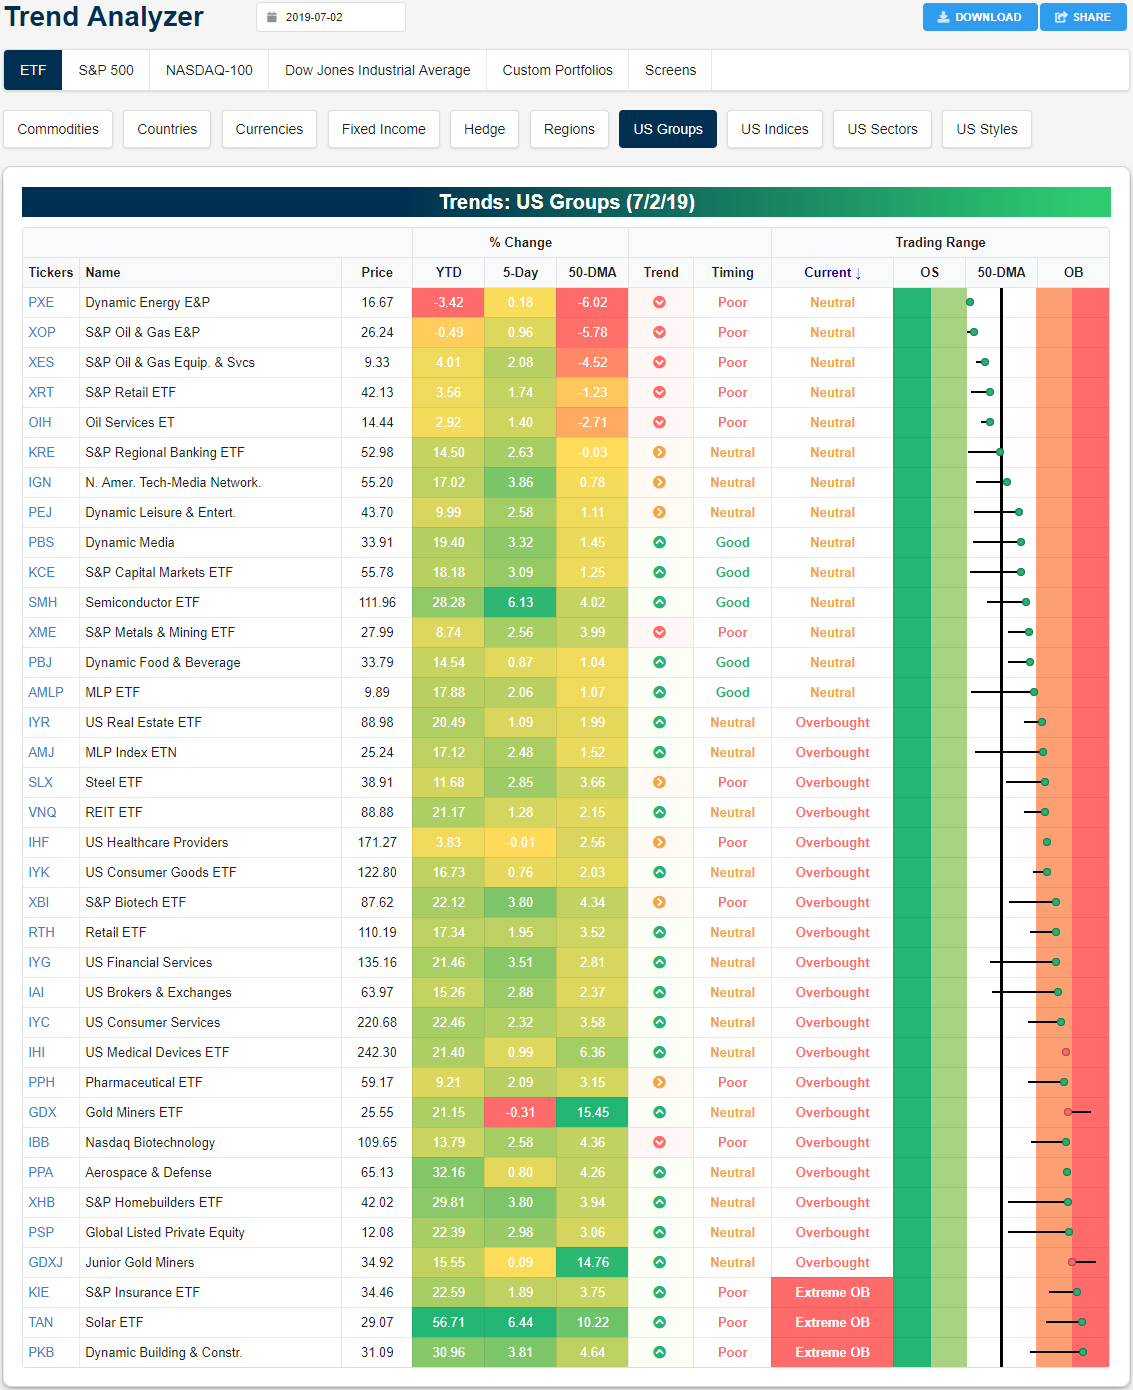
Looking at performance broken out by industry groups, the two best performers recently have been Semiconductors (SMH) and Solar (TAN). Both industries ripped over 6% higher in the past week. This brings SMH to be one of the top performing ETFs YTD. SMH also retook the 50-DMA in the past week but has yet to move into overbought territory, helping it to earn a good timing score. Meanwhile, solar has actually been the best-performing industry in 2019 by a wide margin as easing trade tensions have been a factor behind the rallies of both ETFs. TAN has now risen 56.71% YTD and is now trading at extremely overbought levels again.
While both of these ETFs have surged, most other industries have also moved higher as only the Gold Miners ETF (GDX) and US Healthcare Providers (IHF) are lower over the last week. The underperformance of GDX along with Junior Gold Miners (GDXJ) follows a surge where both become very extended from their 50-DMAs; both are still teetering on extremely overbought levels as well. While not in the red, with oil sliding, energy ETFs like the Dynamic Energy E&P (PXE) and S&P Oil & Gas E&P (XOP) have also been somewhat underperforming. These are currently the furthest below the respective 50-DMAs and the closest to oversold territory. Start a two-week free trial to Bespoke Institutional to access our interactive Trend Analyzer and much more.
Bespoke’s Global Macro Dashboard — 7/3/19
Bespoke’s Global Macro Dashboard is a high-level summary of 22 major economies from around the world. For each country, we provide charts of local equity market prices, relative performance versus global equities, price to earnings ratios, dividend yields, economic growth, unemployment, retail sales and industrial production growth, inflation, money supply, spot FX performance versus the dollar, policy rate, and ten year local government bond yield interest rates. The report is intended as a tool for both reference and idea generation. It’s clients’ first stop for basic background info on how a given economy is performing, and what issues are driving the narrative for that economy. The dashboard helps you get up to speed on and keep track of the basics for the most important economies around the world, informing starting points for further research and risk management. It’s published weekly every Wednesday at the Bespoke Institutional membership level.
You can access our Global Macro Dashboard by starting a 14-day free trial to Bespoke Institutional now!

Morning Lineup – Mixed Data on Jobs
Happy July 4th! US futures are indicating a higher open this morning ahead of the holiday-shortened session. Treasury yields are lower, and the latest data hasn’t really done much to halt that slide. Mortgage applications slid, Private Payrolls released by ADP were weaker than expected, and Jobless Claims were only slightly lower than forecasts. There’s still a lot more data left on the calendar, though. Factory Orders, Durable Goods, and the ISM Services report will all be released at 10 AM Eastern. Stay tuned.
Read today’s Morning Lineup to get caught up on news and stock specific events ahead of the trading day, as well as updates on the latest Services PMI data around the world.
Bespoke Morning Lineup – 7/3/19

As mentioned above, the ADP Private Payrolls report missed expectations this morning coming in at a level of 102K versus forecasts for 140K. This month’s weaker print follows an even weaker reading of 41K last month. That takes the two-month rolling total of growth in private payrolls growth to 143K, which is the weakest two-month rate of growth since April 2010. Two months may not necessarily make a trend, but Private Payroll growth has fallen out of the longer-term range that it was in.

Start a two-week free trial to Bespoke Premium to see today’s full Morning Lineup report. You’ll receive it in your inbox each morning an hour before the open to get your trading day started.
The Closer – Trends, Auto Sales, Home Improvement Collapse – 7/2/19
Log-in here if you’re a member with access to the Closer.
Looking for deeper insight on markets? In tonight’s Closer sent to Bespoke Institutional clients, we begin with a look at the trends in the 200-day moving averages of the S&P 500, WTI Crude Oil, the Russell 2000, and the 10-year. We then show the rarity of the S&P’s 200-day rising while other assets are not looking as optimistic. With little in economic data out today, we then show Eurozone and US auto sales and yesterday’s construction spending which continues to show collapsing home improvement.

See today’s post-market Closer and everything else Bespoke publishes by starting a 14-day free trial to Bespoke Institutional today!
B.I.G. Tips – Price Target Increases on the Way?
Most Heavily Shorted S&P 500 Stocks
Below is a list of the 29 stocks in the S&P 500 that have more than 10% of their share float sold short. Luxury retailer Nordstrom (JWN) currently tops the list with 22% of its float sold short. The stock is down 33.86% YTD and 55% from levels seen last November.
Tax-prep company H&R Block (HRB) is the second most heavily shorted stock with 20.55% of its float sold short. HRB is followed by sports retailer Under Armour (UAA), Snap-On (SNA), and Kohl’s (KSS). While JWN and KSS are both down big YTD, HRB, UAA, and SNA are all up nicely on the year.
There are plenty of other notables on the list, including Macy’s (M), Campbell Soup (CPB), TripAdvisor (TRIP), Gap (GPS), Western Union (WU), and Foot Locker (FL), but one common characteristic among many of them is that they are retailers.
On average, these stocks with 10%+ short interest as a percentage of float are up 8.5% on the year, which is well below the 17% gain that the S&P 500 has seen.
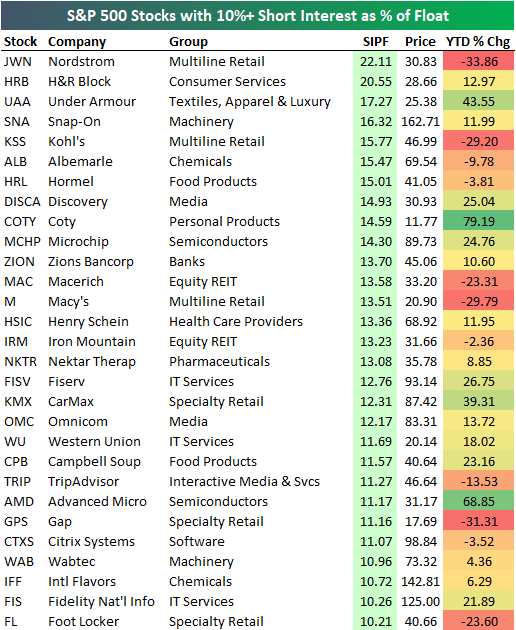
Below we have input the list of heavily shorted stocks into a custom portfolio that Bespoke members can create when they’re logged into our website. We’ve sorted the list by our algo-driven “Trend” and “Timing” scores. There are currently four stocks on the list that are in Bespoke “uptrends” with “good” timing scores — Under Armour (UAA), Intl Flavors & Fragrances (IFF), Campbell Soup (CPB), and Coty (COTY).
If you’re a Bespoke Premium or Bespoke Institutional member already, you can import this list of heavily shorted stocks into a custom portfolio by clicking here. We use these tools as starting points when we’re trying to find new long or short ideas, and our members can too! Start a two-week free trial to Bespoke Premium to build your own custom portfolios today.
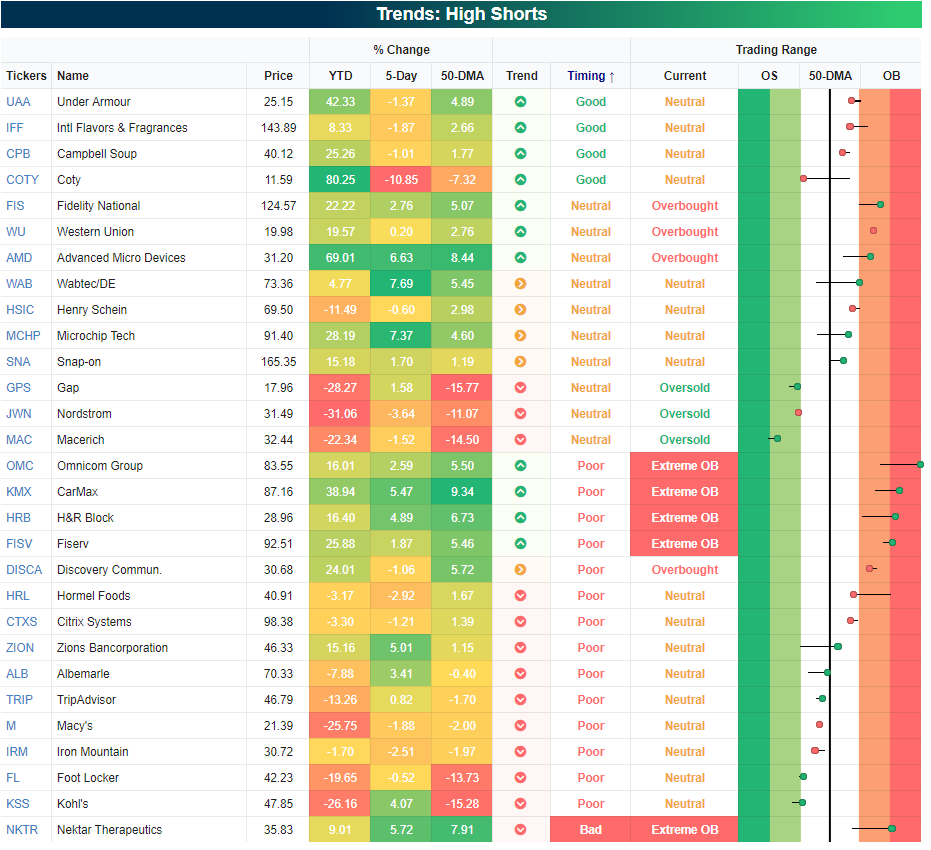
Chart of the Day – Breakouts to 52-Week Highs
Bespoke Stock Scores — 7/2/19
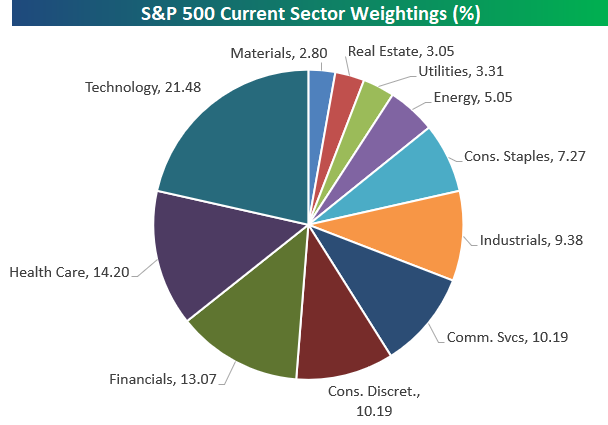
S&P 500 Sector Weightings: Mid-Year 2019
Below is an updated snapshot of S&P 500 sector weightings as of mid-year 2019. As shown, the Technology sector makes up the largest slice of the pie with a weighting of 21.48%. Health Care ranks as the second largest sector of the market at 14.20%, followed by Financials at 13.07%. The fact that technology and two service-oriented sectors making up nearly 50% of the index shows how much the US economy has shifted over the years. After the “big three” of Tech, Health Care, and Financials, we move down to Consumer Discretionary, Communication Services, and Industrials, which are all right around 10%. Consumer Staples has a weighting of 7.27%, and Energy is all the way down to 5.05% after years of losing share. Utilities, Real Estate, and Materials combine to add up to roughly 9% of the index, so these three sectors are basically immaterial at this point.
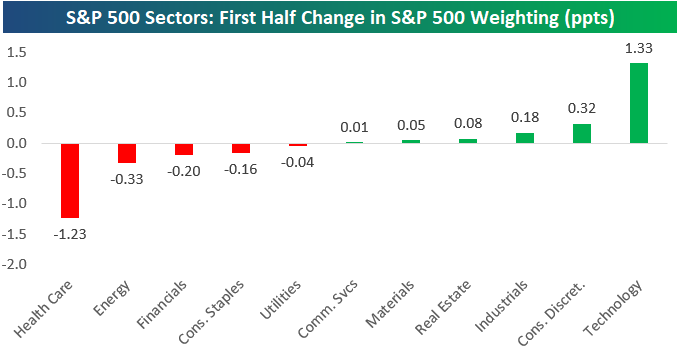
Below is a chart showing how much weightings changed in the first half of 2019. The Technology sector gained 1.33 percentage points while Health Care lost 1.23 percentage points, so the gap between the biggest sector (Tech) and the 2nd biggest sector (Health Care) widened by more than 2.5. Consumer Discretionary, Industrials, Real Estate, Materials, and Communication Services all gained share in the first half as well, while Energy, Financials, Consumer Staples, and Utilities all lost share along with Health Care. Start a two-week free trial to Bespoke Institutional for a closer look at S&P 500 sector weightings and access to ALL of our most actionable equity market research.
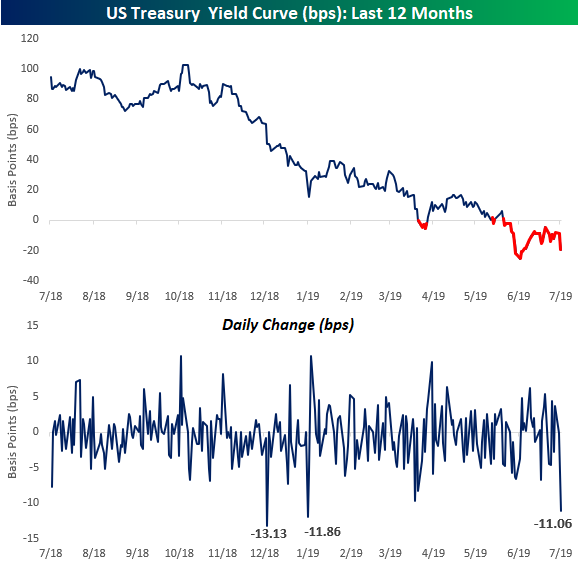
Yield Curve Craters
With the 10-year plummeting below 2% again and the 3-month yield spiking up by over 7 basis points (bps), which is its biggest one day gain since December 2017, the yield curve is cratering today. Today’s 11 bps move further into inverted territory is the biggest one-day move since January 2nd (see second chart). While not back at new lows, today marks the 29th day that the curve has now been inverted. In Fedspeak news, Cleveland Fed President Loretta Mester (who leans hawkish but isn’t a voter) just noted in a speech that she’s in no hurry to cut. She argues that “Cutting rates at this juncture could reinforce negative sentiment about a deterioration in the outlook even if this is not the baseline view, and could encourage financial imbalances given the current level of interest rates, which would be counterproductive.”
What would cause her to change her stance? “If I see a few weak job reports, further declines in manufacturing activity, indicators pointing to weaker business investment and consumption, and declines in readings of longer-term inflation expectations, I would view this as evidence that the base case is shifting to the weak-growth scenario.” A few weak job reports? In other words, she is in no hurry to take any action. Keep in mind, though, that as recently as late February, Mester was still of the view that the FOMC would need to be raising rates later on this year. Start a two-week free trial to Bespoke Institutional for full access to all of our research and interactive tools.