B.I.G. Tips – Top S&P 500 Charts 7/10/19
Bespoke’s Global Macro Dashboard — 7/10/19
Bespoke’s Global Macro Dashboard is a high-level summary of 22 major economies from around the world. For each country, we provide charts of local equity market prices, relative performance versus global equities, price to earnings ratios, dividend yields, economic growth, unemployment, retail sales and industrial production growth, inflation, money supply, spot FX performance versus the dollar, policy rate, and ten year local government bond yield interest rates. The report is intended as a tool for both reference and idea generation. It’s clients’ first stop for basic background info on how a given economy is performing, and what issues are driving the narrative for that economy. The dashboard helps you get up to speed on and keep track of the basics for the most important economies around the world, informing starting points for further research and risk management. It’s published weekly every Wednesday at the Bespoke Institutional membership level.
You can access our Global Macro Dashboard by starting a 14-day free trial to Bespoke Institutional now!

Bespoke’s Morning Lineup – Powell Delivers
Investors will have to contend with a ton of headlines related to the Federal Reserve over the next two days. Beginning today with Powell’s testimony in front of the House Financial Services Committee, we will also hear from Bullard at 1:30 and the Minutes from June’s meeting at 2 PM. Then tomorrow, another six Fed officials are on the calendar. Suffice it to say, that in the next 36 hours markets should have a much better idea of what the FOMC plans to do at its July 31st meeting, although the fact that futures are already pricing in 100% certainty of a cut suggests that markets are already pretty confident in their views.
Just released text of Powell’s testimony is being met with a positive reaction from the markets as the Chairman said that uncertainty continues to weigh on the outlook.
Read today’s Morning Lineup to get caught up on news and stock-specific events ahead of the trading day and a further discussion of overnight events in Asia and Europe.
Bespoke Morning Lineup – 7/10/19

Futures have seen a nice rebound in reaction to the just-released Powell comments, and one section of the equity market that could really use a lift is small caps. On a relative strength basis, small caps are right at their lowest level of performance versus the S&P 500 since the end of the Financial Crisis in 2009.

Start a two-week free trial to Bespoke Premium to see today’s full Morning Lineup report. You’ll receive it in your inbox each morning an hour before the open to get your trading day started.
The Closer – Small Caps Slide, Labor Market Rundown, Italian NPLs – 7/9/19
Log-in here if you’re a member with access to the Closer.
Looking for deeper insight on markets? In tonight’s Closer sent to Bespoke Institutional clients, we start off with a look at just how dramatic the underperformance of small caps relative to the S&P 500 has been recently. We delve a bit deeper into the potential reasons for this weakness. Turning to macroeconomic data, we then recap today’s release of JOLTS Job Openings which echoed some weakening that has been observed in other indicators like today’s NFIB small business data.

See today’s post-market Closer and everything else Bespoke publishes by starting a 14-day free trial to Bespoke Institutional today!
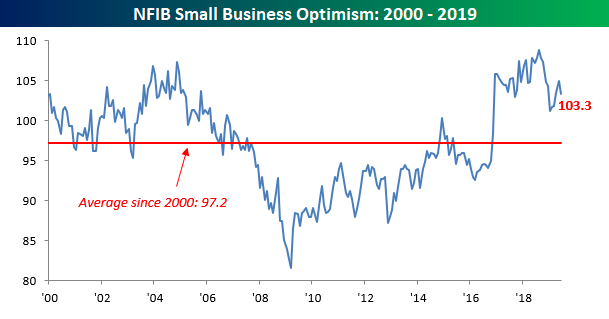
Small Business Optimism Takes a Pause
Small business optimism took a dip in June, ending a streak of four straight monthly increases. According to the NFIB, the headline small business optimism index fell from 105.0 down to 103.3. Despite the decline, the headline reading was better than expected. The key behind the pullback this month was most likely tied to the increased uncertainty created by the escalation in trade tensions between the US and China as well as the threat of tariffs on imports from Mexico. As the NFIB’s President summed things up, “Last month, small business owners curbed spending, sales expectations and profits both fell and the outlook for expansion dampened.” That’s definitely not a sign of confidence, although we would note that with the trade war back on hold and the threatened tariffs on Mexican imports not materializing, that should set the stage for a rebound in sentiment next month.
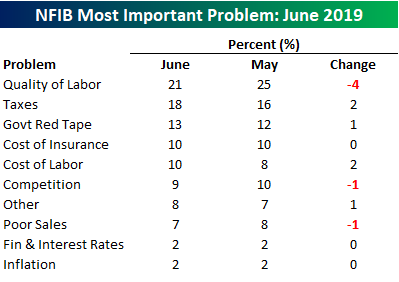
With respect to the issues that small businesses see as their biggest problems, Quality of Labor remains the biggest problem, although the percentage of businesses that cited it as a problem last month fell from 25% down to 21%. Issues that took up the slack were Taxes (increased from 16% up to 18%) and Cost of Labor (up to 10% from 8%). With regards to interest rates, only 2% of small businesses see interest rates as their biggest problem, so it’s not as though small businesses are having any trouble borrowing. Inflation is a very minor issue as well as it too was only cited by 2% of small business owners.
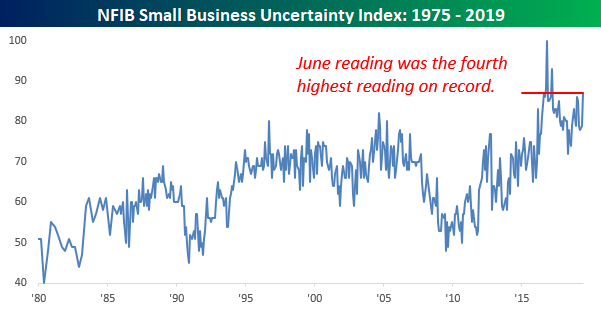
Above we mentioned that the threat of higher tariffs was lifting levels of uncertainty, and that is reflected in the NFIB Uncertainty index which saw its largest one-month increase since the 2016 election. At its current level of 87, the index has only been higher three times in the history of the index, and all three of those higher readings occurred during the period following Brexit and the 2016 election. Get more in-depth market analysis with a two-week free trial to Bespoke Premium.
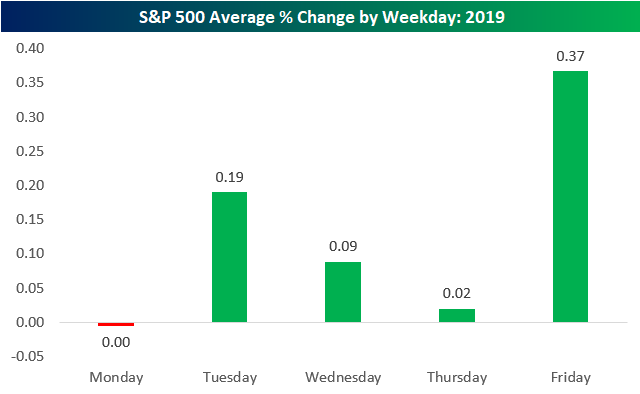
Fridays Still Leading
Below is a quick update on the S&P 500’s average performance by weekday so far in 2019 now that we are more than halfway through the year. As shown, Monday has been the only weekday to average a small decline, while Friday has been by far the best day of the week with an average gain of 0.37%. Tuesday has been the 2nd best day of the week with an average gain of 0.19%, followed by Wednesday at +0.09% and Thursday at +0.02%. So now you know! Get more in-depth market analysis with a two-week free trial to Bespoke Premium.
Bespoke Stock Scores — 7/9/19
Chart of the Day: Year 3 Of Election Cycle Going As Planned
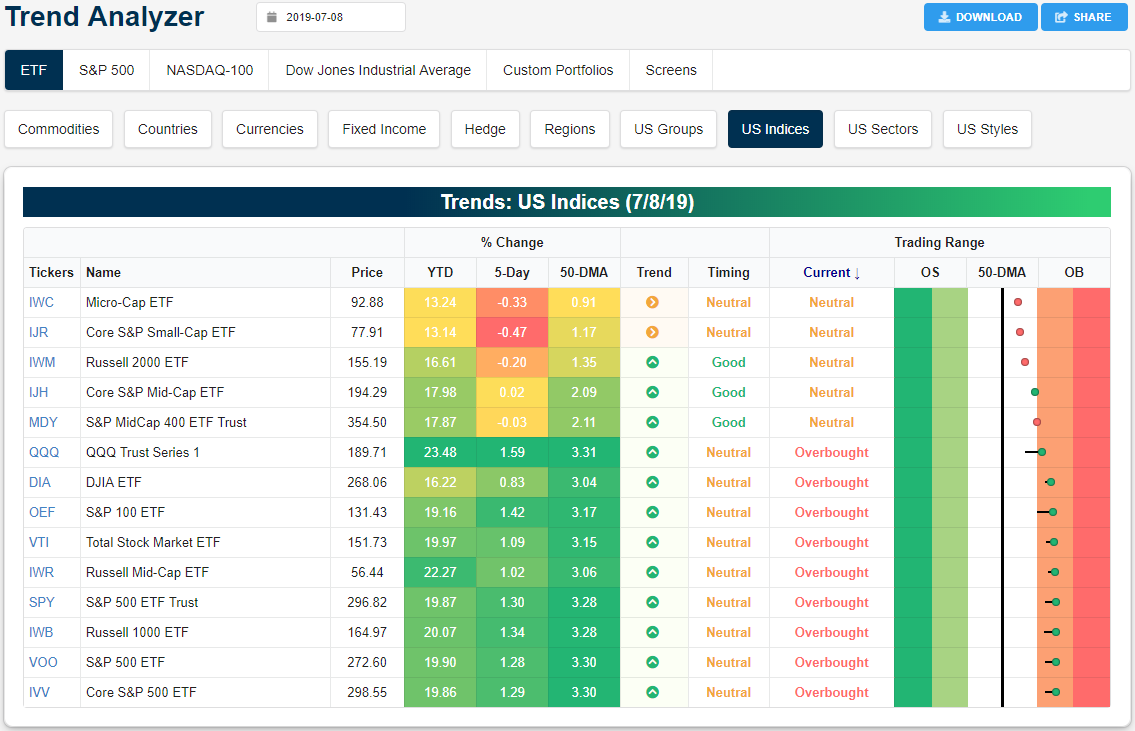
Trend Analyzer – 7/9/19 – Mid Caps Back to Neutral
Equities have continued to pull back off of their all-time highs from last week with further declines yesterday. Despite these declines, only small and mid-caps are in the red over the last five days. Whereas almost every major index ETF except for small-caps had been overbought, today there are nine overbought and another five that are neutral. Large caps remain overbought but have come off of near extreme levels. Meanwhile, mid-caps like the Core S&P Mid-Cap (IJH) and the S&P MidCap 400 (MDY) have moved back into neutral from overbought territory. These two ETFs are also about flat in the past week with each only having moved a few basis points. This is in stark contrast to the other mid-cap ETF in our Trend Analyzer, the Russell Mid-Cap (IWR), which has traded more in line with large caps. Currently, IWR is overbought and is dramatically outperforming other mid-caps as it has moved over 1% higher in the last week. As previously mentioned, small caps have yet to make it into overbought territory and are underperforming the rest of the market over the past week. Start a two-week free trial to Bespoke Institutional to access our interactive Trend Analyzer and much more.
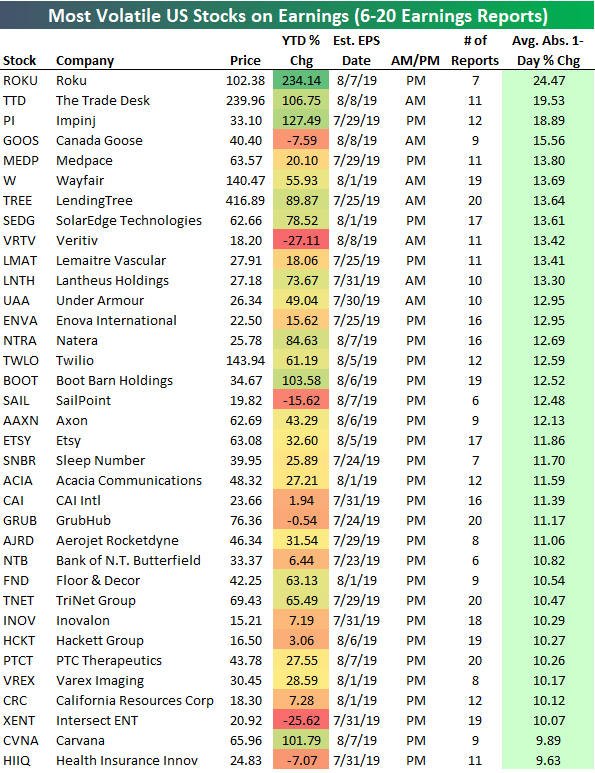
The Most Volatile Stocks on Earnings: Q2 2019
Below is a snapshot from our Earnings Explorer tool showing the number of publicly traded US companies that are set to report earnings over the next month. As shown, things don’t pick up until the second half of July and early August.
In terms of beat rates, coming into this earnings season, the rolling 3-month EPS beat rate stands at 63.09%, which is well above the long-term average beat rate of 59.37%. (The beat rate represents the percentage of companies that have beaten consensus analyst EPS estimates over the last 3 months.) The 3-month revenue beat rate is at just 56.49%, however, which is right inline with the historical average. You can keep track of numerous earnings-related stats on a daily basis using our Earnings Explorer tool. Try it out now with a two-week free trial to Bespoke Institutional.

As we do at the start of each earnings season, below we take a look at the most volatile stocks on earnings. When we look at earnings volatility, we mean how the stock typically moves on the first trading day following its quarterly earnings report. For stocks that report after the close, we’re looking at its price change on the next trading day. For stocks that report in the morning before the open, we’re looking at its price change on that trading day.
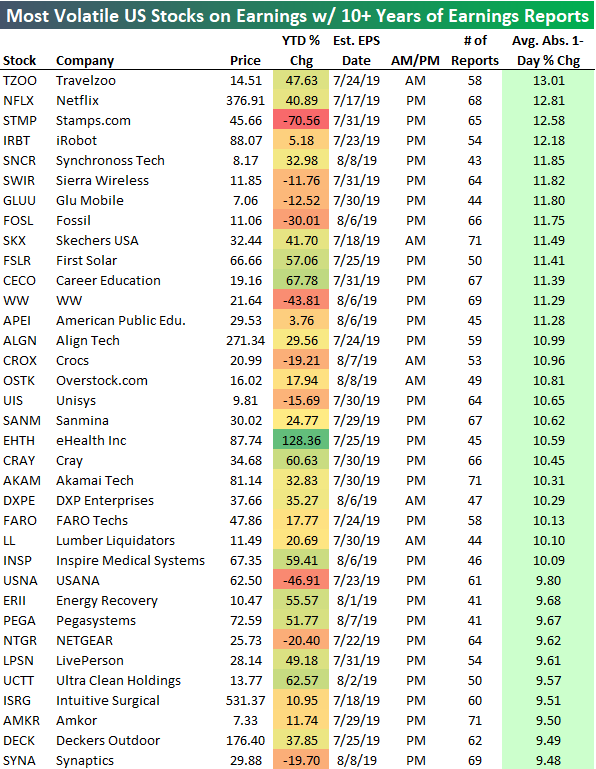
We’ve been keeping track of earnings reports and price reactions to earnings for 20+ years now, and we have a database accessible to subscribers that lets you pull up historical earnings results for nearly every US company going back to 2001. Using our database, below is a list of the stocks with at least 10 years of quarterly earnings reports (at least 40 reports) that react the most violently to earnings. Each of the stocks listed has historically averaged a move of +/-9.4%+ on its earnings reaction day.
The most volatile stock on earnings with at least 10 years of reports is Travelzoo (TZOO). Over time, the stock has seen an average one-day move of +/-13.01% when it reports earnings. TZOO reports before the open on 7/24 this season. Netflix (NFLX) ranks second with an average one-day move of +/-12.81%, followed by Stamps.com (STMP), iRobot (IRBT), and Synchronoss Tech (SNCR). Other notables on the list of biggest movers include Fossil (FOSL), First Solar (FSLR), Align Tech (ALGN), and Intuitive Surgical (ISRG).
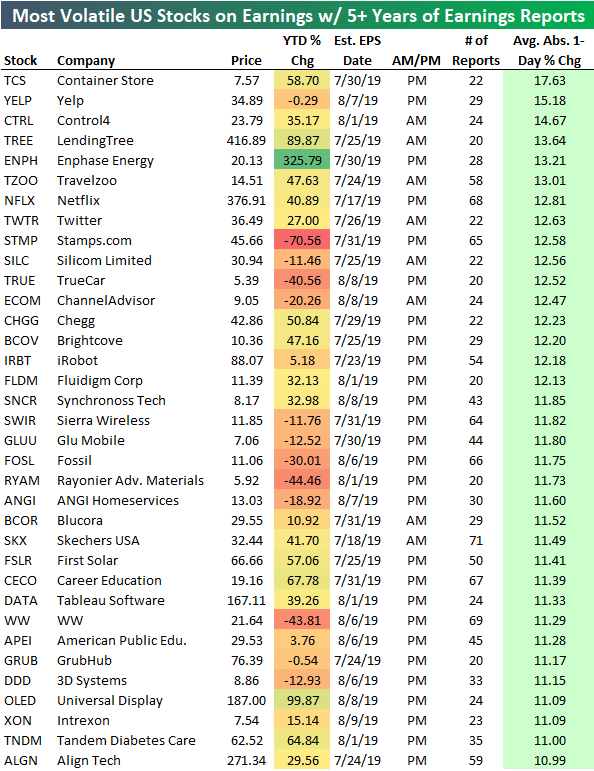
If we include companies that only have 5+ years of quarterly earnings results (20+ quarters), there are stocks with even more volatility. The Container Store (TCS) has 22 quarterly earnings reports, and the stock has averaged a one-day move of +/-17.63% on these days! Yelp (YELP) ranks 2nd with an average move of +/-15.18%, followed by Control4 (CTRL) at +/-14.67%, LendingTree (TREE) at +/-13.64%, and Enphase Energy (ENPH) at +/-13.21%.
Finally, below is a list of companies that have between 6 and 20 quarterly earnings reports. Roku (ROKU) has 7 quarterly reports since it went public, and it has averaged a one-day move of nearly 25% on its earnings reaction day! The Trade Desk (TTD) has averaged a one-day move of +/-19.53% on its 11 earnings reports, while Inpinj (PI) has averaged a move of +/-18.89% on its 12 quarterly reports. Canada Goose (GOOS), Medpace (MEDP), and Wayfair (W) all average one-day moves of 13.6% or more. Start a two-week free trial to Bespoke Premium or Bespoke Institutional for comprehensive earnings analysis and a full calendar of upcoming reports. CLICK HERE to sign up now.