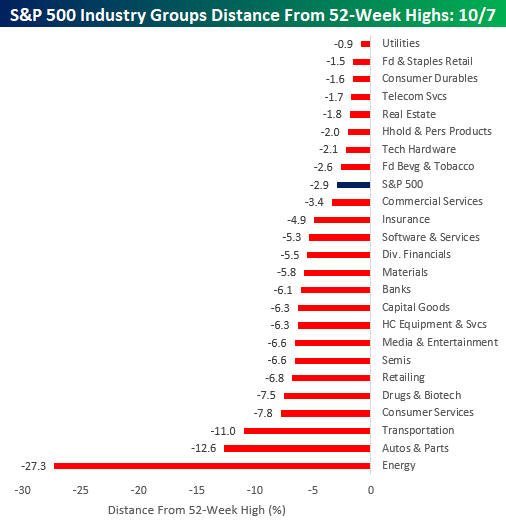
Industry Groups Distance From 52-Week Highs: Defensives on the Offensive
The S&P 500 ended up closing down about 0.50% today but still remains within 3% of its record high in July. The chart below shows where each of the S&P 500’s Industry Groups are trading with respect to their own 52-week highs. While the S&P 500 is less than 3% from its high, the majority of Industry Groups are down at least 5% from their own highs. Leading the way to the downside, Energy has been the clear loser with a decline of 27.3%. Behind Energy, just two other groups (Transportation and Autos & Parts) — which are both cyclical in nature — are down over 10%. In terms of Industry Groups that have held up the best, they are mostly defensive in nature with Utilities, Food & Staples Retail, Consumer Durables, Telecom Services, and Real Estate all trading within 2% of their respective highs. Start a two-week free trial to Bespoke Institutional to access all of our research and our popular interactive Chart Scanner and Trend Analyzer tools.
Apple (AAPL) Back in the “Trillion Dollar” Club, Closing In on Microsoft (MSFT)
After falling nearly 40% from its high point to its low point in the fourth quarter of 2018, Apple (AAPL) has come roaring back in 2019. Earlier today the stock got within one percent of making a new all-time closing high. You can see the action in the five-year chart for Apple below. (Click here to view an interactive chart of AAPL.) Start a two-week free trial to Bespoke Institutional to access all of our research and our popular interactive Chart Scanner and Trend Analyzer tools.

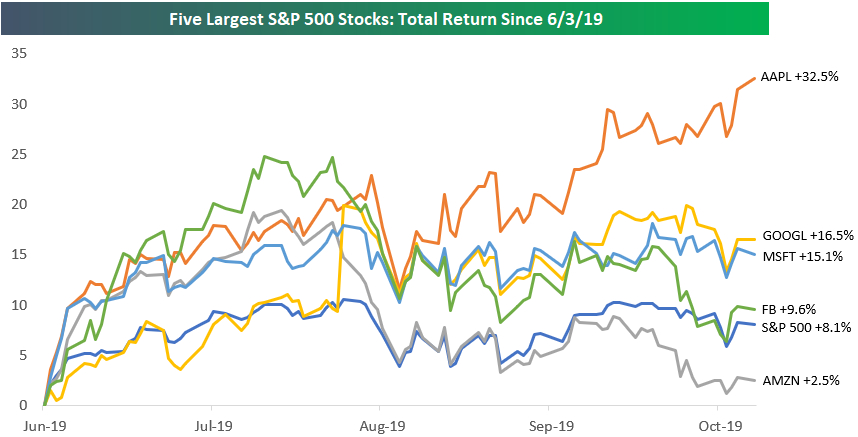
Apple (AAPL) has been the big winner of the mega caps over the last few months. Below is a chart showing the total return of the five largest S&P 500 stocks since the S&P made its most recent closing low on June 3rd. As shown, Apple has gained 32.5%, which is more than double the next biggest winner — Alphabet (GOOGL) at +16.5%. Microsoft (MSFT) is up 15.1%, while Facebook (FB) is up 9.6% and Amazon (AMZN) is up just 2.5%.
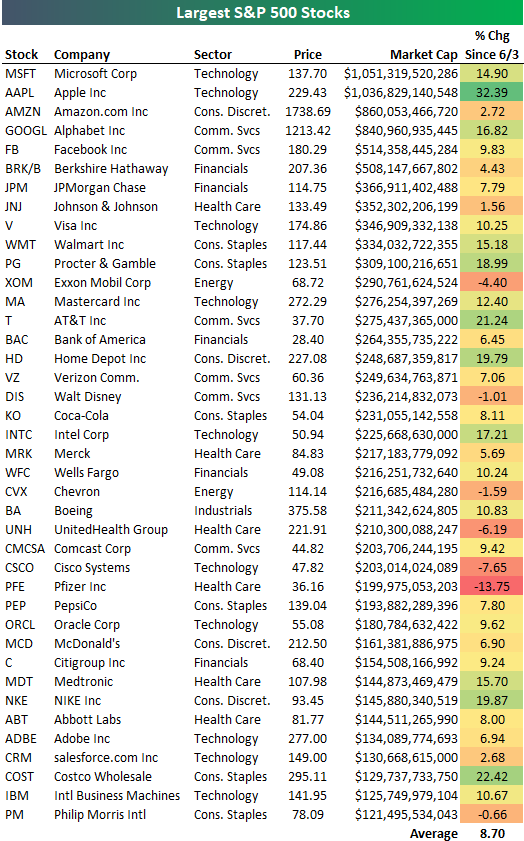
Apple’s (AAPL) recent gains have put the company back in the “trillion dollar market cap” club as well. Right now the club only has two members — MSFT and AAPL. While Microsoft (MSFT) still holds the title of “World’s Largest Company,” Apple is now hot on its heels.
Amazon (AMZN), Alphabet (GOOGL), Facebook (FB) and Berkshire (BRK/B) are the only other companies with market caps above $500 million, and then you have JP Morgan (JPM), Johnson & Johnson (JNJ), Visa (V), and Walmart (WMT) rounding out the top ten.
Dividend Stock Spotlight: Paychex (PAYX)
Stocks got a shot in the arm at the end of last week thanks to the Nonfarm Payrolls report. As we discussed in Friday’s Bespoke Report, although the headline number missed expectations, the report’s data showed strength in other labor market metrics such as the employment-population ratio and wage growth. With its business closely tied to the labor market as a payroll and HR solutions provider, the second-largest payroll accounting firm behind only Automatic Data Processing (ADP), Paychex (PAYX) outperformed on the day with a 2.17% rally. More significantly, this rally helped to lift PAYX out of a downtrend that has been in place since June. It was also the first time that the stock closed in overbought territory (at least one standard deviation above its 50-day moving average) since June.
In addition to the more positive technical set-up, PAYX has an attractive dividend that currently yields 2.98%. That is a much larger yield than other stocks in the Software and Services industry group, averaging 1.7%, and the broader S&P 500. The yield for PAYX’s closest comp, Automatic Data Processing (ADP), is nearly a full percentage point lower at 1.99%. Though they have much smaller market caps, other comparables including Paycom Software (PAYC) and Paylocity (PCTY) do not pay a dividend. In terms of security, PAYX has a long history of paying a dividend going back to 1988 and has paid shareholders for each quarter consecutively over the past five years. The dividend has grown 63% (from $0.38 in 2014 to $0.62 last quarter) in this time. The first two quarters of 2013 did not see a dividend declared but this was the only time this happened in the past three decades. The payout ratio is currently 84.15%, which is somewhat high but in line with the average for the ratio over the past ten years. The next payout is expected to be declared on October 10th at $0.62 per share.

Moving back to technicals, below are price charts of PAYX’s competitors. While PAYX managed to break its downtrend on Friday, none of these did and they’re still well off their recent highs. Start a two-week free trial to Bespoke Institutional to access all of our research including our interactive tools.

Chart of the Day: Is the Smart Money Buying or Selling?
Today’s Chart of the Day is now available for members.
One of the many breadth measures we monitor is the intraday performance of the S&P 500. We can do this by creating an intraday composite chart of the S&P over any time period. Basically this shows the average path that the S&P has taken throughout the trading day over various time frames. The “smart money indicator” suggests that the more thought out institutional money trades at the end of the trading day, while the more reactionary ‘dumb’ money trades at the open. Thus, late-day rallies are weighted positively by the smart money indicator while early morning rallies are weighted negatively. Conversely, early morning weakness is not a negative with the smart money indicator but late-day weakness is.
The S&P is down 2.5% from its July 26th closing high, but the smart money indicator has really been moving over this time period. We highlight the big move in today’s Chart of the Day. To read this report and access everything else Bespoke’s research platform has to offer, start a two-week free trial to Bespoke Premium. You won’t be disappointed!

Semis Em-Bull-dened
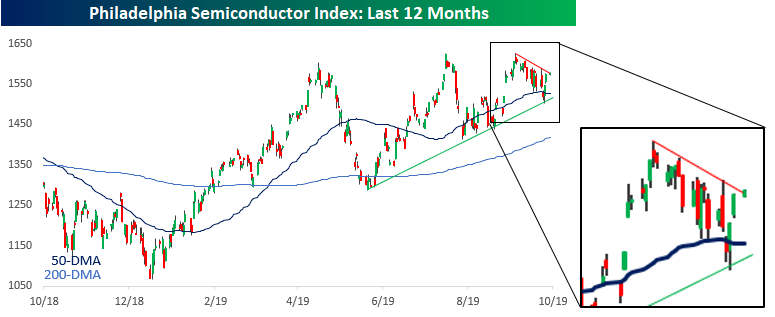
For much of the last several years, semiconductors have been a leading group of the broader market to both the upside and downside. Therefore, it shouldn’t come as too much of a surprise that the S&P 500 has rallied off its earlier lows after the semis opened the day right around the unchanged level and have rallied from there. The chart of the Philadelphia Semiconductor Index (SOX) over the last year also bodes well for the overall equity market. Since its late May lows, the SOX has carved out a solid uptrend line with a series of higher lows, and while you have to squint closely, it has also made two higher highs relative to its high in April. Also, just today the group is looking like it is close to breaking its short-term downtrend that has been in place since the most recent marginal new high in early September. If that short-term downtrend breaks, the rally in the broader market will likely continue to have legs. Start a two-week free trial to Bespoke Institutional to access all of our research and our popular interactive Chart Scanner and Trend Analyzer tools.
September 2019 Headlines
Bespoke’s Morning Lineup – 10/7/19
See what’s driving market performance around the world in today’s Morning Lineup. Bespoke’s Morning Lineup is the best way to start your trading day. Read it now by starting a two-week free trial to Bespoke Premium. CLICK HERE to learn more and start your free trial.

Bespoke Brunch Reads: 10/6/19
Welcome to Bespoke Brunch Reads — a linkfest of the favorite things we read over the past week. The links are mostly market related, but there are some other interesting subjects covered as well. We hope you enjoy the food for thought as a supplement to the research we provide you during the week.
While you’re here, join Bespoke Premium for 3 months for just $95 with our 2019 Annual Outlook special offer.
Red Meat
Eat Less Red Meat, Scientists Said. Now Some Believe That Was Bad Advice. by Gina Kolata (NYT)
The latest in a long back-and-forth debate over nutritional science and the right amount of red meat to eat, with a side of internecine scientific fighting. [Link; soft paywall]
Are Burgers Really That Bad for the Climate? by Justin Fox (Bloomberg)
How much carbon does your burger habit cost? It turns out the answer is a little bit complicated, and highly sensitive to the various assumptions that get made. [Link; soft paywall]
New York Real Estate
New York City Apartment Prices Hit Four-Year Low by Josh Barbanel (WSJ)
The median sales price for apartments in New York fell 32% in the third quarter, driven by an increase in transfer taxes for higher-end units that came into effect in July. [Link; paywall]
NYC housing prices in near ‘free fall,’ conditions mirror recession era following tax hikes by Brittany De Lea (Fox 5 New York)
The increase in the New York City “mansion tax” moved the maximum taxable rate up to 3.9% from 1%; tax amounts increase as sales prices do over $1mm. That relatively small tax change appears to have driven a massive price response, at least so far as QoQ data goes. [Link]
The Middle Class
The Middle-Class Crunch: A Look at 4 Family Budgets by Tara Siegel Bernard and Karl Russell (NYT)
A view at a range of middle class families with monthly take-homes ranging from $48k-$116k. Note: median family income in 2018 was $63k. [Link; soft paywall]
The Seven-Year Auto Loan: America’s Middle Class Can’t Afford Its Cars by Ben Eisen and Adrienne Roberts (WSJ)
Longer amortizations have come to the US auto market, meaning a more manageable monthly payment…but longer repayment and more risk. [Link; paywall]
Food For Thought
How billionaire Ray Dalio helped launch McDonald’s Chicken McNugget by Emmie Martin (CNBC)
Did you know that the Chicken McNugget wouldn’t exist without the founder of Bridgewater Associates? By matching buyer demand and seller supply, the hedge fund manager allowed for the mass market in fried, boneless poultry nuggets. [Link]
Biggest U.S. Egg Producer Plunges as Supplies Soar and Prices Drop by Lydia Mulvany (Bloomberg)
Egg producers are switching to cage-free varieties, but as customers switch to the more hen-friendly varieties, there hasn’t been any decline in traditional types of eggs. [Link; soft paywall]
Private Markets
Everything Is Private Equity Now (Bloomberg)
Outside ownership by a fund that has experience bringing operations into a more efficient place can be good for businesses and the economy, but like any medicine too much of a good thing is a problem. [Link; soft paywall]
All Revenue is Not Created Equal: The Keys to the 10X Revenue Club by Bill Gurley (Above the Crowd)
This relatively straightforward checklist gives a rundown of when a business is likely to be worth 10x its revenues and when it isn’t. [Link]
The Great Public Market Reckoning by Fred Wilson (AVC)
Is all of the chaos in the transition from private markets to public markets for VC-backed investments simply a question of margins? [Link]
Internet Stuff
Remember Wrinkles the Clown, the viral boogeyman for hire? This new documentary shows his dark side by KC Ifeanyi (Fast Company)
A strange video went viral, as part of a marketing stunt for a very creepy clown that was offering a strange service to parents. But there’s even more weirdness to this uniquely Florida story. [Link]
Fat Bear Week Is Back by Brian Kahn (Gizmodo)
For bears, pigging out over the summer isn’t a function of gluttony, but pure survival. Ursine eaters are in the process of hitting their peak weights, ready to hibernate through the winter, and Katmai National Park and Preserve is keeping track of which predator packs on the pounds best. [Link]
Closing Time
Why are Rural Hospitals Closing? By Emily Wavering Corcoran (Federal Reserve Bank of Richmond)
An investigation into the 155 rural hospitals that have shut their doors over the last 15 years, concentrated in large states and those that did not expand Medicaid with the ACA. [Link]
As Steelmaker Shuts Plant, Governor Points to Tariffs by Jeremy Hill (Bloomberg)
A Louisiana recycled steel operation filed bankruptcy after shutting down its operations this week. The company uses imported scrap metal to make its products, which has left it badly exposed to tariffs on steel imports. [Link; soft paywall]
Autonomous Vehicles
Waymo Valuation Slashed on Autonomous Vehicle Tech Delays by Gerrit De Vynck (Bloomberg)
A private valuation of the Waymo division of Google has been cut from $175bn to $105bn thanks to “a series of hurdles relating to commercialization and advancement”. [Link; soft paywall]
Fixed Income
Why the U.S. Yield Curve Reliably Predicts U.S. Recessions by Richard M. Salsman (AIER)
A very basic walk-through of the logic behind yield curve inversion and its forecasting power in the US economy. [Link]
Investing
Charles Schwab on the Lessons He’s Learned Over a Lifetime of Investing by Robert Hackett (Fortune)
A profile on the discount brokerage legend, who has led the charge in democratizing the financial markets for discount brokerage clients. [Link]
Central Banking
The education of Jerome Powell: How the Fed chair is adapting to pressure from Wall Street and Trump by Heather Long and Tory Newmyer (WaPo)
As Chair Powell has gotten more press conferences under his belt, he’s worked hard to improve his communication style and avoid some of the past mistakes he’s made. [Link]
Early French and German central bank charters and regulations by Ulrich Bindseil (ECB Occasional Paper Series)
Some original scholarship that provides translations and analysis of six early central bank charters and related regulations for early European central banks. [Link; 94 page PDF]
‘Keep de Rates dem Low’—Jamaica Sets Inflation Fight to Reggae Beat by Robbie Whelan (WSJ)
Reggae is the latest weapon deployed by the Bank of Jamaica in its fight against inflation, a unique approach to public education. [Link; paywall]
Read Bespoke’s most actionable market research by joining Bespoke Premium today! Get started here.
Have a great weekend!
Bespoke 2020 Special
Bespoke Investment Group has been providing investors with clear, actionable analysis since our founding in 2007, and we’re currently working hard on our biggest and most important report of the year — The Bespoke Report 2020 Market Outlook and Investor Toolkit.
It’s not hard to describe the contents of this report because it simply has it all. This report prepares you with everything you need to know for the year ahead, and it’s a must-read for all investors.
How can you gain access to our annual Bespoke Report? It’s easy. Join one of our three membership levels now with our “2020” special offer and the report is included. What is the “2020” special? You’ll get one month of any membership level for just $20, then you’ll get 20% off the regular monthly rate going forward. Join now because this special is only available for a limited time! Choose an option below to sign up now. Click here if you’re looking for more details on what’s included with each membership level.
Bespoke 2020 Special — Bespoke Newsletter
Bespoke 2020 Special — Bespoke Premium
Bespoke 2020 Special — Bespoke Institutional

The Bespoke Report — 10/4/19
This week’s Bespoke Report newsletter is now available for members.
Stocks bounced big late in the week after the details of the Employment Situation Report helped a bid in equities that started Thursday. Big drops in equity markets in response to ISM numbers early in the week were mostly clawed back. So which should matter more, the soft ISM surveys or the hard data on jobs? We give a definitive answer, as well as discussing a range of other economic and market details. To read the Bespoke Report and access everything else Bespoke’s research platform has to offer, start a two-week free trial to one of our three membership levels. You won’t be disappointed!