UK and German Equities Break Down
Whereas major US equity indices have yet to distinctively see any significant breakdown below recent support, the same cannot be said for European indices. Both the UK’s FTSE 100 Index and Germany’s DAX Index have fallen sharply from their recent highs at the end of July. This week’s declines have caused key support levels to break, and the uptrends that were in place over the past six months are now completely gone. Start a two-week free trial to Bespoke Institutional to access our interactive Security Analysis tool, Chart Scanner, and much more.
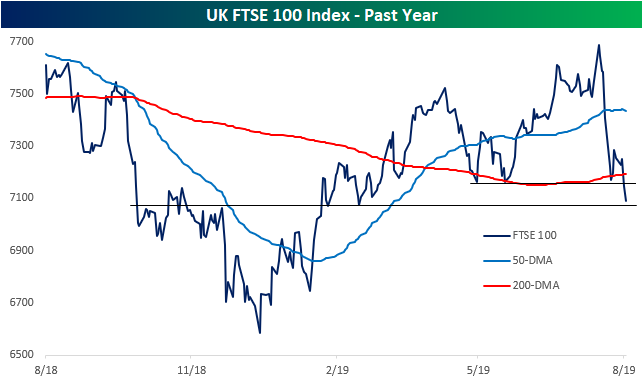
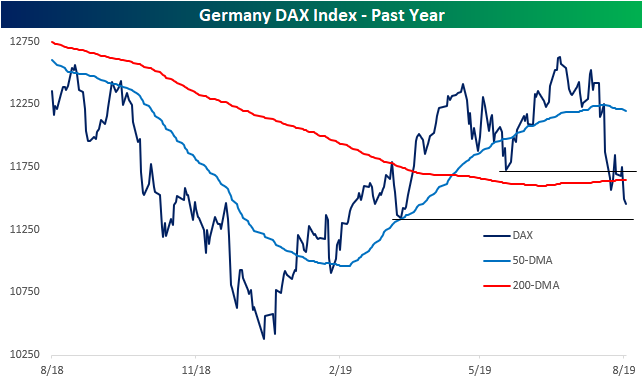
Chart of the Day: As Goes Walmart (WMT)?
Trend Analyzer – 8/15/19 – Extreme Readings
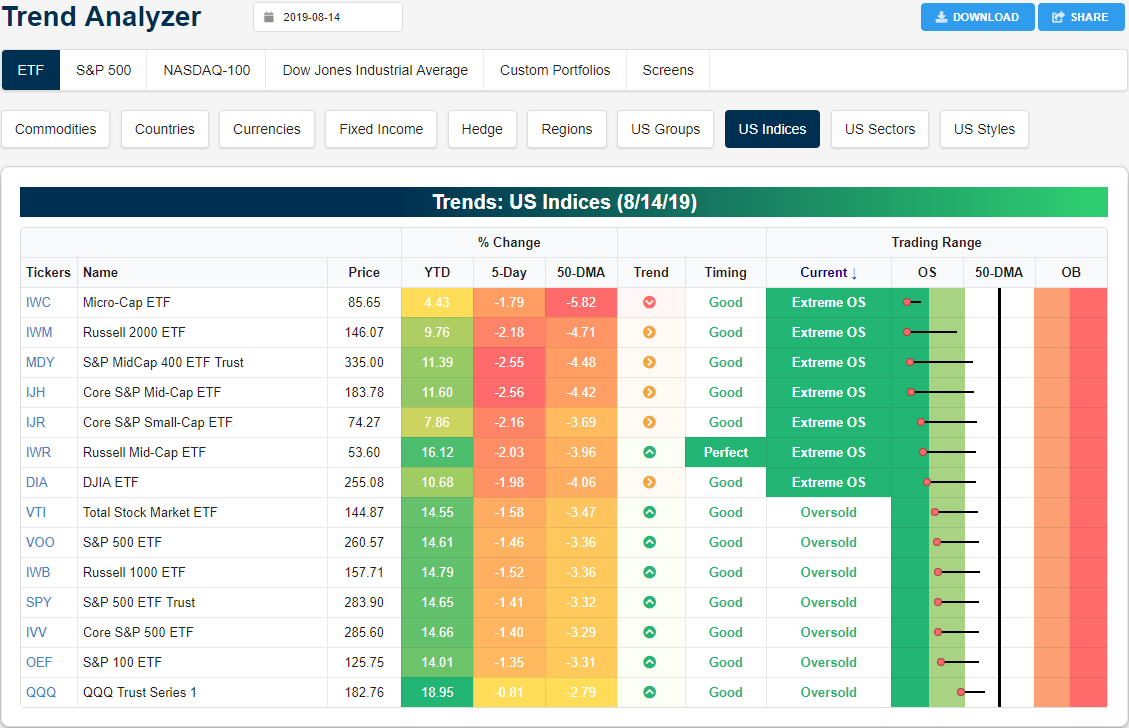
In what has been a very volatile week so far, yesterday’s big move lower has left the major US index ETFs wholly oversold. Despite falling over 3% in yesterday’s session, the Nasdaq (QQQ) is actually the least oversold and down the least over the past week. On the other hand, small and mid-caps in addition to the Dow (DIA) have been the worst performers and have all fallen over 2 standard deviations below their 50-DMAs. This is after most of the major index ETFs were in neutral territory one week ago. This large move lower within each ETFs’ respective trading range can be seen through the large tails to the right in our Trend Analyzer tool.
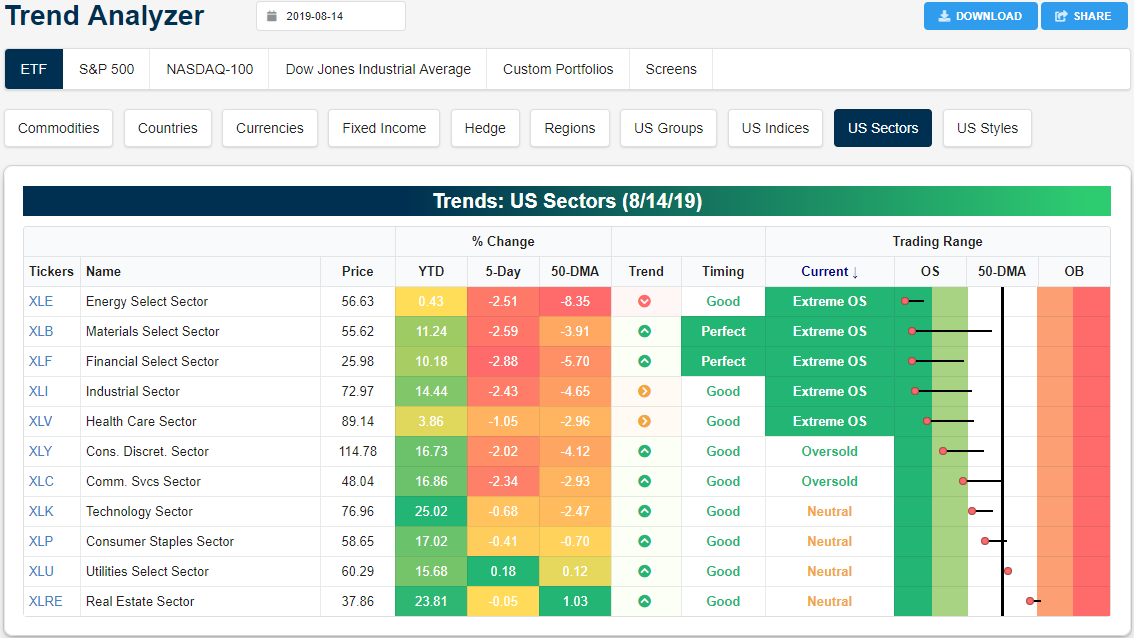
Breaking up the past week’s move lower by individual sectors, defensives like Real Estate (XLRE), Utilities (XLU), and Consumer Staples (XLP) have fallen the least with XLU even moving modestly higher. Health Care (XLV) and Technology (XLK) have also held up relatively well considering the other sectors have all fallen over 2%. While XLK has yet to move into oversold territory, XLV is sitting at extremely oversold levels on these declines. In total, seven of the eleven sectors are oversold; five of which to an extreme degree. Only XLU and XLRE are above their 50-DMA’s. In fact, XLRE is sitting pretty extended relative to other sectors at 1% above its 50-day moving average. Start a two-week free trial to Bespoke Institutional to access our Trend Analyzer and much more.
The Bespoke 50 Top Growth Stocks — 8/15/19
Every Thursday, Bespoke publishes its “Bespoke 50” list of top growth stocks in the Russell 3,000. Our “Bespoke 50” portfolio is made up of the 50 stocks that fit a proprietary growth screen that we created a number of years ago. Since inception in early 2012, the “Bespoke 50” has beaten the S&P 500 by 125.8 percentage points. Through today, the “Bespoke 50” is up 232.0% since inception versus the S&P 500’s gain of 106.2%. Always remember, though, that past performance is no guarantee of future returns. To view our “Bespoke 50” list of top growth stocks, please start a two-week free trial to either Bespoke Premium or Bespoke Institutional.

Bespoke’s Morning Lineup — WMT Strong
Even though the S&P 500 fell 19.8% from peak to trough in late 2018, and even though the index was up 20%+ YTD in early July, take a look at the two data points below. Yesterday’s 2.92% decline left the S&P at nearly the exact same level it was at one year ago.
S&P 500 close on 8/14/19: 2,840.60
S&P 500 close on 8/14/18: 2,839.96
See what’s driving market performance around the world in today’s Morning Lineup. Bespoke’s Morning Lineup is the best way to start your trading day. Read it now by starting a two-week free trial to Bespoke Premium. CLICK HERE to learn more and start your free trial.

Consumer Debt Update
Yesterday the New York branch of the Federal Reserve released its quarterly assessment of consumer credit growth, which includes both mortgage and non-mortgage debt. We discussed the release in full detail in The Closer (link) but also show highlights below.
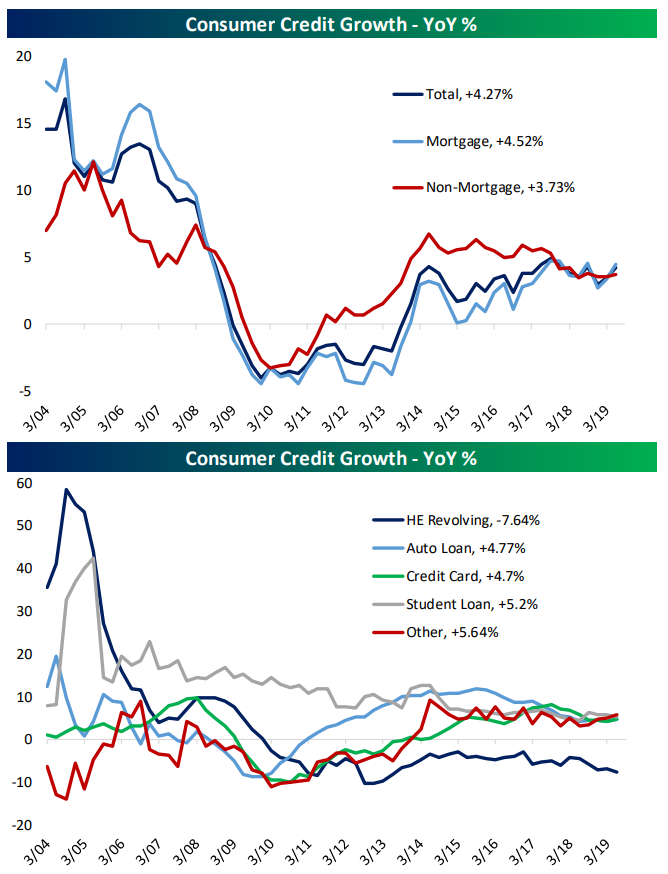
As shown in the chart below, growth of total outstanding balances is dominated by mortgage debt, which accounts for just shy of 68% of the total. Mortgage debt is rising 4.5% YoY, an entirely sustainable pace, while non-mortgage debt is only rising about 3.7% YoY. Home equity line of credit lending continues to collapse, dropping 7.6% YoY in Q2, while auto and credit card debt is rising around 4.7% YoY. Finally, student loan balances are rising 5.2% YoY, above the lowest levels of the past 15 years but near to them. Start a two-week free trial to Bespoke Institutional to access The Closer and the rest of Bespoke’s suite of Institutional products.
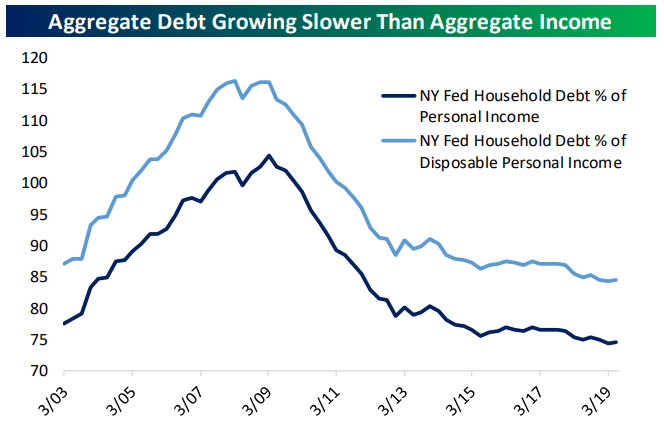
Debt levels continue to rise and have grown for 20 straight quarters, but most of that is a function of economic growth. As shown in the chart below, relative to personal income or disposable personal income, mortgage + non-mortgage consumer debt balances are only one quarter removed from the lowest levels in the survey’s history.
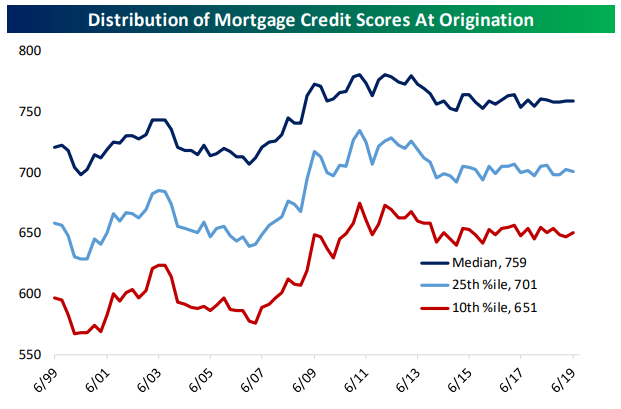
While debt growth and the type of debt outstanding is fodder for concern, it’s worth keeping in mind that the credit scores of loans made to mortgage or auto loan borrowers are high relative to history. While that doesn’t ameliorate all concerns about debt loads, it’s a very different picture from the pre-crisis years when debt loads surged thanks to huge lending to sub-prime borrowers.

Finally, a look at delinquency. Late payments are rising for some types of loans but falling for others. Student loan delinquency rates of ~10% haven’t moved much in recent years, but credit card and “other” (installment, etc) loans have also seen a modest uptick. Auto loan delinquency rates have risen since 2014, but may be peaking out thanks to the increase in lending standards that kicked in when delinquencies started rising.
The Closer – Equities Plunge, WeWork S1’d, EIA Data, Fund Flows Carnage- 8/14/19
Log-in here if you’re a member with access to the Closer.
Looking for deeper insight on markets? In tonight’s Closer sent to Bespoke Institutional clients, we compare the price action of the S&P 500 so far in 2019 to what things looked like in 1998. We then show what performance looks like following other moves of down 1% one day, then up 1%, and finally down 2% the next day. After that, we evaluate WeWork’s fundamentals before turning to weekly EIA and ICI Fund Flow data.

See today’s post-market Closer and everything else Bespoke publishes by starting a 14-day free trial to Bespoke Institutional today!
Chart of the Day: Bonds Extended; Curve Inversions
Fixed Income Weekly – 8/14/19
Searching for ways to better understand the fixed income space or looking for actionable ideas in this asset class? Bespoke’s Fixed Income Weekly provides an update on rates and credit every Wednesday. We start off with a fresh piece of analysis driven by what’s in the headlines or driving the market in a given week. We then provide charts of how US Treasury futures and rates are trading, before moving on to a summary of recent fixed income ETF performance, short-term interest rates including money market funds, and a trade idea. We summarize changes and recent developments for a variety of yield curves (UST, bund, Eurodollar, US breakeven inflation and Bespoke’s Global Yield Curve) before finishing with a review of recent UST yield curve changes, spread changes for major credit products and international bonds, and 1 year return profiles for a cross section of the fixed income world.
In this week’s report we discuss the rabid buying of fixed income assets we’ve seen of late.

Our Fixed Income Weekly helps investors stay on top of fixed income markets and gain new perspective on the developments in interest rates. You can sign up for a Bespoke research trial below to see this week’s report and everything else Bespoke publishes free for the next two weeks!
Click here and start a 14-day free trial to Bespoke Institutional to see our newest Fixed Income Weekly now!
Bespoke’s Global Macro Dashboard — 8/14/19
Bespoke’s Global Macro Dashboard is a high-level summary of 22 major economies from around the world. For each country, we provide charts of local equity market prices, relative performance versus global equities, price to earnings ratios, dividend yields, economic growth, unemployment, retail sales and industrial production growth, inflation, money supply, spot FX performance versus the dollar, policy rate, and ten year local government bond yield interest rates. The report is intended as a tool for both reference and idea generation. It’s clients’ first stop for basic background info on how a given economy is performing, and what issues are driving the narrative for that economy. The dashboard helps you get up to speed on and keep track of the basics for the most important economies around the world, informing starting points for further research and risk management. It’s published weekly every Wednesday at the Bespoke Institutional membership level.
You can access our Global Macro Dashboard by starting a 14-day free trial to Bespoke Institutional now!
