Sentiment Back to Normal
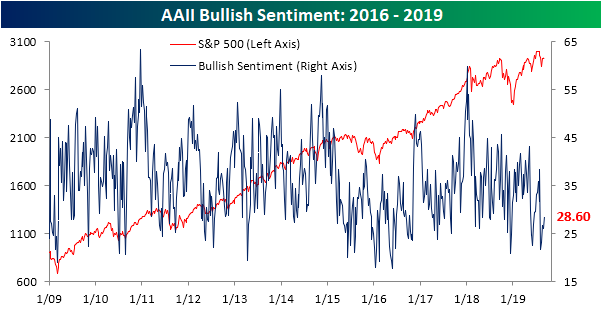
Bullish investor sentiment as measured by AAII’s sentiment survey rose 2.5 percentage points to 28.64% this week. While this is an improvement, bullish sentiment is still in the 18th percentile of the data over the past decade. We must also note that the survey would not have captured any benefit from today’s news on the trade front and the technical breakout of stocks and other assets like crude oil. Save a tweet or a headline reversing what appears to be optimism given today’s positive price action, we’ll likely see a bigger jump in bullish sentiment next week.
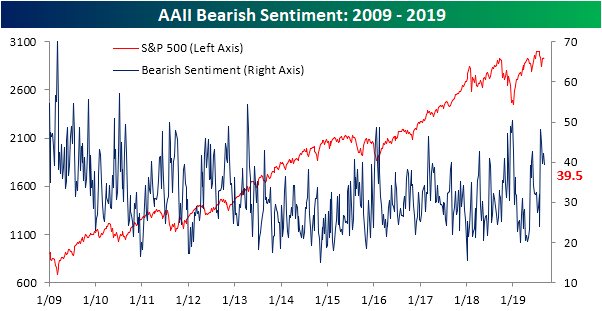
Bulls borrowed from the bears this week as bearish sentiment fell from 42.2% last week to 39.5%. As with bullish sentiment, this is not necessarily a dramatic improvement as it is still higher than 83% of weeks over the past 10 years. Bearish sentiment also remains the predominant sentiment level among investors as the bull-bear spread is still fairly wide at -10.87 percentage points. Granted, that is the narrowest spread since the last week of July when it was only 28 bps in favor of bears.
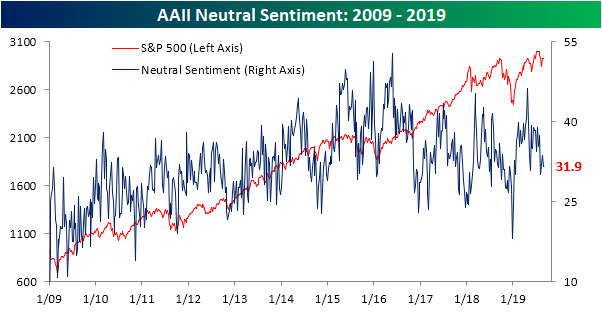
The bulk of the loss in bearish sentiment went to bulls, but a small portion also went to the neutral camp as the percentage of investors reporting as neutral grew to 31.9%. While bullish sentiment is still several percentage points below its historical average and the opposite applying to bearish sentiment, neutral sentiment has been pulling back to its historical average over the past few months. Where it currently sits at 31.9%, it is only 0.33% from that average. Start a two-week free trial to Bespoke Institutional to access our interactive economic indicators monitor and much more.
ISM Services Shows Little Pressure in Inflation
Following Tuesday’s ISM Manufacturing report, we noted the extremely low reading in the monthly ISM Commodities Survey, which measures the number of commodities rising and falling in price. After today’s report for the Non-Manufacturing sector, that trend remained in place. In this morning’s report, respondents noted price increases in just 6 commodities and decreases in 4. That net reading of +2 is the weakest reading since January. Combining the results of both reports, in August we saw a total of just 8 commodities up in price and 15 lower. That reading of negative 7 was the lowest since February 2016, while the three-month moving average of -4.0 was the lowest since April 2016.
As we noted on Tuesday, low readings in the commodities survey usually track the direction of inflation readings pretty closely and would imply that the current y/y reading of 1.8% in CPI will see downward pressure in the months ahead. For example, in the eight prior months where the three-month moving average in the combined reading was between zero and negative five, the average y/y reading in CPI was +0.45% while the median level was +0.65%. Start a two-week free trial to Bespoke Institutional to access our interactive economic indicators monitor and much more.
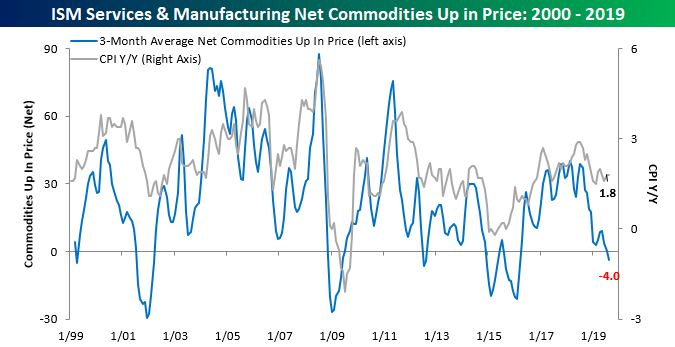
Chart of the Day: Down Goes Energy
ISM Non Contraction Index
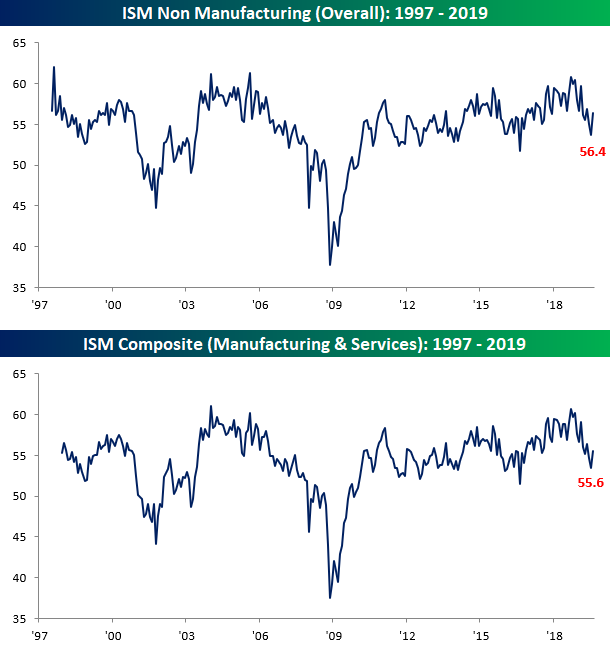
Just two days after one of the weakest ISM Manufacturing reports in years, Thursday’s release of the ISM Non-Manufacturing report for the month of August was a complete 180 from its Manufacturing counterpart. While economists were expecting the headline index to rise from 53.7 in July up to 54.0, the actual reading was considerably higher at 56.4. While it’s only the highest reading since May, the fact that it increased at all was a surprise to many. On a combined basis and accounting for each sector’s share in the overall economy, the Composite ISM for August rose from 53.4 up to 55.6 for its biggest monthly gain since February.
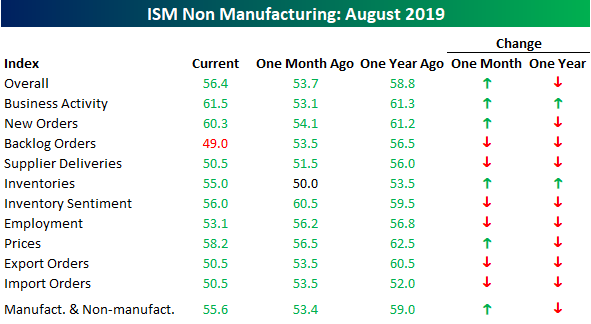
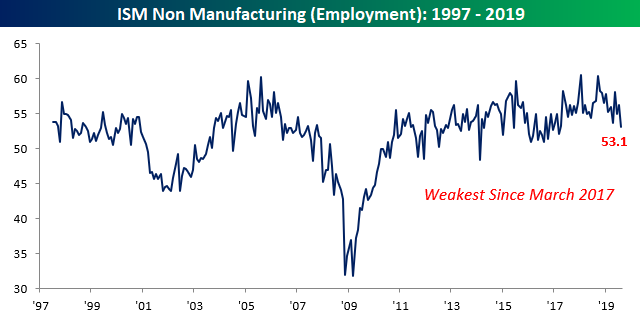
In terms of the breadth of this month’s report, it wasn’t particularly strong, but it wasn’t bad either. On a m/m basis, just four components increased while six declined. On a y/y basis, though, things were much weaker as just two components (Business Activity and Inventories) were higher this August than last. The biggest gainers on a m/m basis were Business Activity and New Orders, while on the downside Backlog Orders, Inventory Sentiment, and Employment saw the largest declines. In the case of Business Activity, that component’s 8.4 m/m increase was the largest since February 2008. Ahead of Friday’s Non-Farm Payrolls report, though, the decline in the Employment component is especially notable as its level is now the lowest since March 2017. Start a two-week free trial to Bespoke Institutional to access our interactive economic indicators monitor and much more.
No New Lows Despite 100 Week Streak For Claims
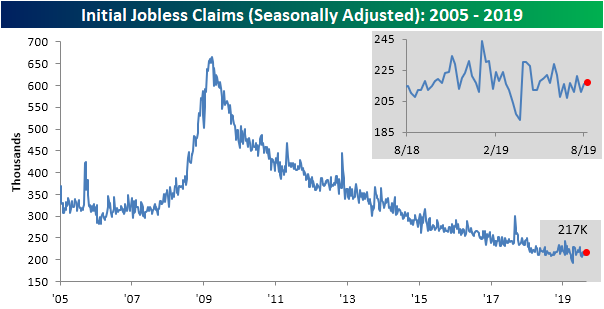
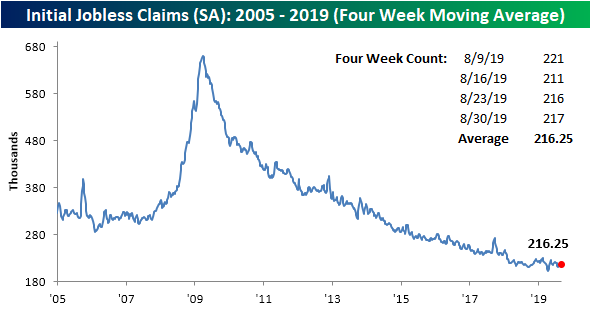
This week’s reading on initial jobless claims was expected to come in unchanged from last week at 215K. Instead, the indicator disappointed slightly with last week’s number being revised up to 216K and this week’s data showing 217K new jobless claims filed. In terms of the seasonally adjusted data, claims continue to remain in the middle of the past year’s range. Even though they were also flat over the past year (visible in the inlaid chart below), claims have in fact still been at very healthy levels. The streak of consecutive weeks at or below 300K has now grown to 235 weeks. This week also marked the 100th straight week of claims coming in at or below 250K! As has been the case for some time now, claims may not be improving or degrading at any significant rate, but the labor market is still holding up just fine.
The four-week moving average reinforces this point as it has also been flat for the past year and a half outside of the spike lower in April. This week, the moving average ticked up to 216.25K as the lower reading of 211K from the first week of August rolled off the average to be replaced with this week’s higher 217K. Again, as with the weekly seasonally adjusted data, the moving average is still at healthy levels relative to history even though the pace of improvements has slowed. Fortunately, looking ahead to next week, there is a good chance the moving average can make a move lower as the recent high of 221K will come off the average.
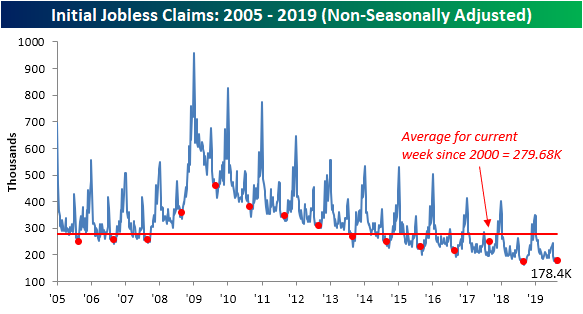
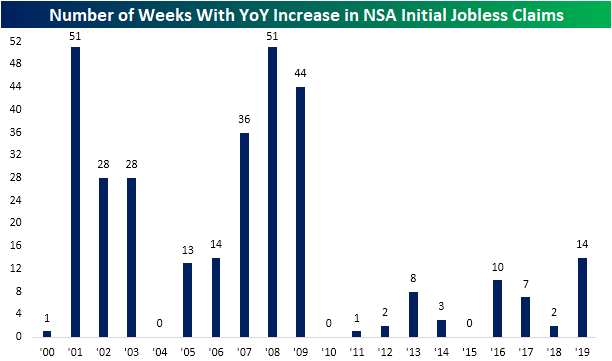
As we discussed last week, the end of August and beginning of September typically see the smallest average week-over-week changes in non-seasonally adjusted initial jobless claims data despite the yearly low typically coinciding around this time of year as well. That continues to hold true this week as the NSA data only rose by 1.5K compared to the average absolute move of 8K. This week’s reading of 178.4K is still well below the average for the current week since 2000, but it was 4.8K higher than the comparable week last year. The only other year of the cycle that the current week saw a YoY increase was in 2017 when it saw an unusual 32.9K increase YoY. Looking ahead to next week, the comparable week last year marked the lowest level in NSA data of the cycle at 162.6K. It would be a promising sign to see this low taken out, but given the higher frequency of YoY increases this year (second chart below), it is questionable if we will see that happen. Start a two-week free trial to Bespoke Institutional to access our interactive economic indicators monitor and much more.
The Bespoke 50 Top Growth Stocks — 9/5/19
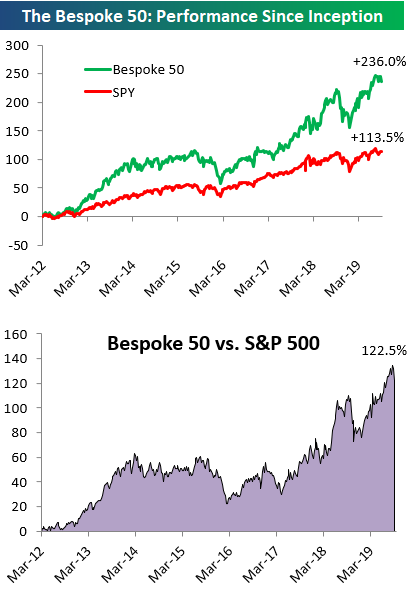
Every Thursday, Bespoke publishes its “Bespoke 50” list of top growth stocks in the Russell 3,000. Our “Bespoke 50” portfolio is made up of the 50 stocks that fit a proprietary growth screen that we created a number of years ago. Since inception in early 2012, the “Bespoke 50” has beaten the S&P 500 by 122.5 percentage points. Through today, the “Bespoke 50” is up 236.0% since inception versus the S&P 500’s gain of 113.5%. Always remember, though, that past performance is no guarantee of future returns. To view our “Bespoke 50” list of top growth stocks, please start a two-week free trial to either Bespoke Premium or Bespoke Institutional.
Bespoke CNBC Appearance (9/4)
Bespoke co-founder Paul Hickey appeared on CNBC’s Power Lunch on Wednesday to discuss markets heading into September. Please click the image below to view the appearance.

Bespoke’s Morning Lineup – Who Said Talk is Cheap?
See what’s driving market performance around the world in today’s Morning Lineup. Bespoke’s Morning Lineup is the best way to start your trading day. Read it now by starting a two-week free trial to Bespoke Premium. CLICK HERE to learn more and start your free trial.

The Closer – Cross-Asset Recap, Trade, Beige, Fund Flows – 9/4/19
Log-in here if you’re a member with access to the Closer.
Looking for deeper insight on markets? In tonight’s Closer sent to Bespoke Institutional clients, we begin with a recap of price action in the S&P 500, VIX and credit spreads, EMFX, the USD, and precious metals. We then look at the US trade balance, including a look at trade between the US and China. We finish with a review of today’s Beige Book release and ICI fund flows.

See today’s post-market Closer and everything else Bespoke publishes by starting a 14-day free trial to Bespoke Institutional today!
Fixed Income Weekly – 9/4/19
Searching for ways to better understand the fixed income space or looking for actionable ideas in this asset class? Bespoke’s Fixed Income Weekly provides an update on rates and credit every Wednesday. We start off with a fresh piece of analysis driven by what’s in the headlines or driving the market in a given week. We then provide charts of how US Treasury futures and rates are trading, before moving on to a summary of recent fixed income ETF performance, short-term interest rates including money market funds, and a trade idea. We summarize changes and recent developments for a variety of yield curves (UST, bund, Eurodollar, US breakeven inflation and Bespoke’s Global Yield Curve) before finishing with a review of recent UST yield curve changes, spread changes for major credit products and international bonds, and 1 year return profiles for a cross section of the fixed income world.
In this week’s report we discuss the extreme level of oversold readings for global bond yields.

Our Fixed Income Weekly helps investors stay on top of fixed income markets and gain new perspective on the developments in interest rates. You can sign up for a Bespoke research trial below to see this week’s report and everything else Bespoke publishes free for the next two weeks!
Click here and start a 14-day free trial to Bespoke Institutional to see our newest Fixed Income Weekly now!