Lowest Jobless Claims Since the 60’s
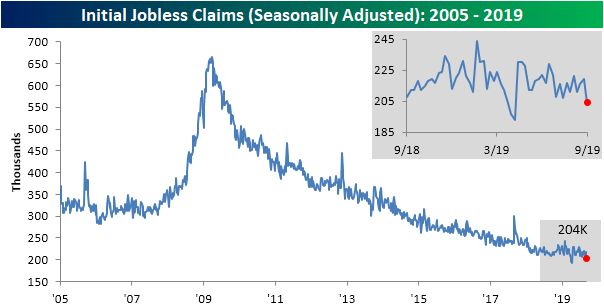
After Friday’s weaker than expected Nonfarm Payrolls report, today’s initial jobless claims release is setting a different tone for labor data. Initial jobless claims were expected to see a modest decline to 215K this week after rising for two straight weeks. Instead, claims came in well below estimates falling to 204K. Not only was this well below last week’s upwardly revised 219K (the largest week-over-week decline since May 10th’s 16K decline) and forecasts, but it was also the lowest print since April’s 193K. Important to note, those April lows were the lowest readings in around 50 years. Although that low from only a few months ago was not taken out, jobless claims still appear healthy with this week’s data bringing it back below the past few months’ range. The overall claims reading is also now more within tangible reach of those aforementioned 50-year lows. Furthermore, SA jobless claims have now spent 236 consecutive weeks at or below 300K and 101 weeks at or below 250K; both the longest streaks on record.
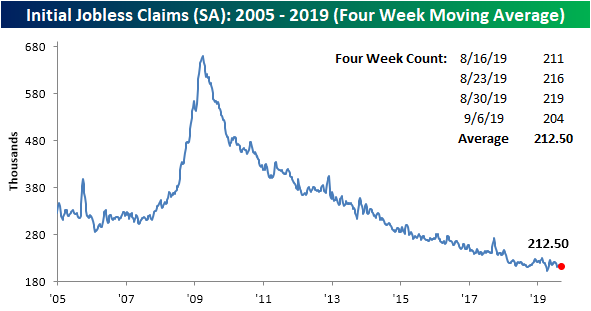
As we mentioned in a note last week, today’s release was likely to see a move lower in the four-week moving average because a recent high of 221K from early August would be rolling off the count. Between that and the exceptionally low number this week, the four-week moving average experienced a 4.25K decline which was its largest decline since mid-July (-5.5K). We would caution though that one week does not necessarily make a trend. The average now sits at 212.5K, which is an improvement from August, but it is also not yet any sort of dramatic new low as with other reads on this indicator. The moving average is now back to where it was only in late-July/early August. Additionally, the moving average is actually 0.75K higher than it was for the current week last year.
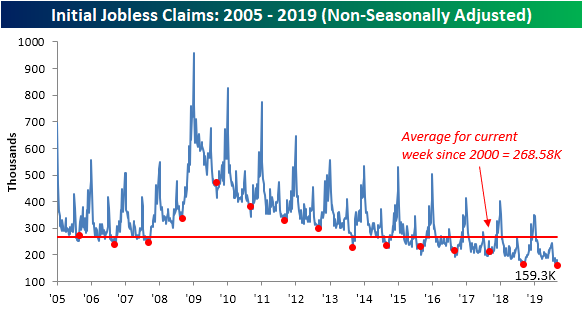
We have mentioned in recent weeks that due to seasonal effects we usually see the yearly low in NSA claims at this time of year. As a result, this would give a good read on how this year’s lows stack up to prior years. The NSA number did not disappoint, dropping to 159.3K. Not only was this 3.3K lower than the comparable week last year, but was also the lowest reading for any given week of the current cycle. Even more impressive, this was the lowest reading for the NSA data in just under 50 years. The last time NSA initial jobless claims were at or below 159.3K was back on October 18th, 1969 when the number was 155K. That was also only a month after the indicator’s all-time low of 133K. Start a two-week free trial to Bespoke Premium for our most actionable investment ideas.
Bespoke’s Morning Lineup – ECBuying
See what’s driving market performance around the world in today’s Morning Lineup. Bespoke’s Morning Lineup is the best way to start your trading day. Read it now by starting a two-week free trial to Bespoke Premium. CLICK HERE to learn more and start your free trial.

Small Cap Surge
Small caps have been serial underperformers versus the large-cap S&P 500 over the last 12+ months, but they’re having their day in the sun this week. Not only has the small-cap Russell 2,000 risen more than 1% for three consecutive trading days to start the week, but the index has also outperformed the S&P 500 by more than one percentage point on each of the last three days.
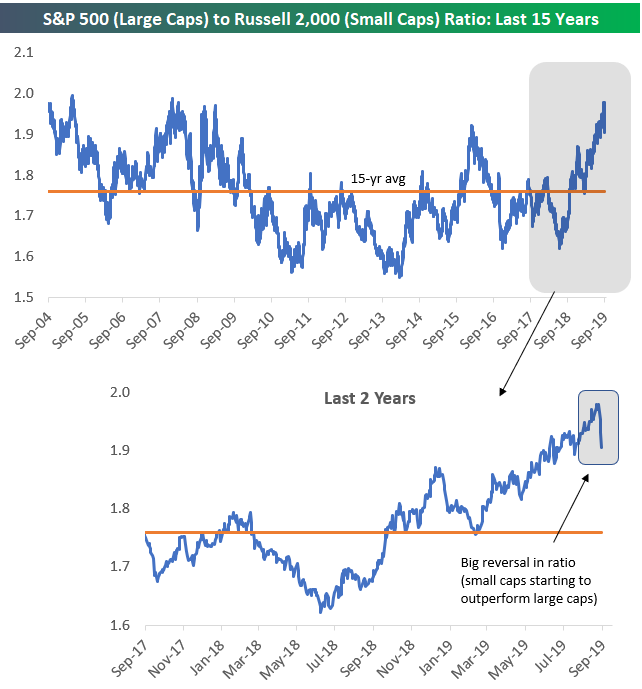
If this is the start of a longer-term small cap resurgence, there is certainly a lot of runway left. Below is a chart of the ratio between the S&P 500 and the Russell 2,000 over the last 15 years. When the line is rising, the S&P is outperforming the Russell. When the line is falling, the Russell is outperforming the S&P.
As you can see in the chart, the S&P has been outperforming the Russell for the last year, and the ratio got extended to the very top of its 15-year range at the start of September. Since peaking earlier this month, however, the ratio has fallen dramatically as small caps have started to outperform. Even after the recent small-cap outperformance, the ratio remains well above its long-term average. Start a two-week free trial to Bespoke Premium for our most actionable investment ideas.
The Closer – Real Yield Run, Russell Reverts, Corporate Data, Election Odds – 9/11/19
Log-in here if you’re a member with access to the Closer.
Looking for deeper insight on markets? In tonight’s Closer sent to Bespoke Institutional clients, we begin with a look at the rip higher in real yields and the Russell 2000. Turning to macroeconomic data, we review today’s PPI data which showed disinflation in Health Care. Next, we get a read on industrial production through Fastenal’s (FAST) monthly sales data. We also show the slowing capex of FAANG stocks before reviewing this week’s EIA data. We finish with what betting sites are showing for the presidential election.

See today’s post-market Closer and everything else Bespoke publishes by starting a 14-day free trial to Bespoke Institutional today!
Chart of the Day: Three Banner Days for Small Caps
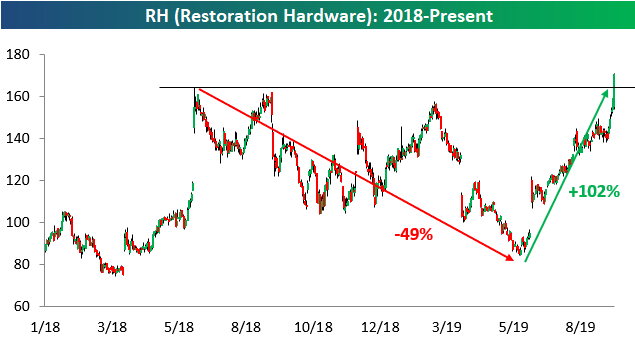
Restoration Restored
After quadrupling in price from early 2017 through June 2018, high-priced furniture maker Restoration Hardware (RH) lost HALF of its value from June 2018 to June 2019.
As most investors are well aware, in order to make back a 50% loss, you need a 100% gain, and that is exactly what RH has done over just the last three months.
All of the stock’s losses were fully “restored” today after the company reported a blow-out triple play after the close last night. The stock beat consensus EPS estimates by 50 cents ($3.20 vs. $2.70), beat consensus revenue estimates by $9 million, and raised forward guidance for 2020. Following the triple play earnings report, RH was volatile in after hours and pre-market trading, but it has been flying higher since today’s open, causing a significant breakout to new all-time highs. The health of “luxury” retail has been questioned in recent months, but RH’s skyrocketing share price over the last 90 days is painting a pretty rosy picture for the group. Start a two-week free trial to Bespoke Premium for our most actionable investment ideas.
Wacky Wednesday Moves
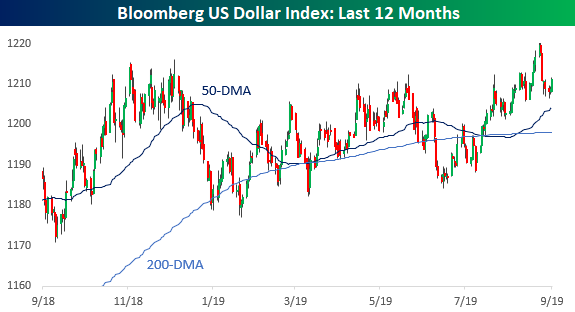
There’s been a number of eyebrow-raising moves in the market this week, and while some of the more extreme moves have subsided today, we’re still seeing some big ones. Take the performance of the dollar and stocks tied to the dollar. From its highs last week through yesterday, the Bloomberg US Dollar Index was down over 1%, but today the greenback is getting a bit of a respite from the selling with a rally of 0.2%.
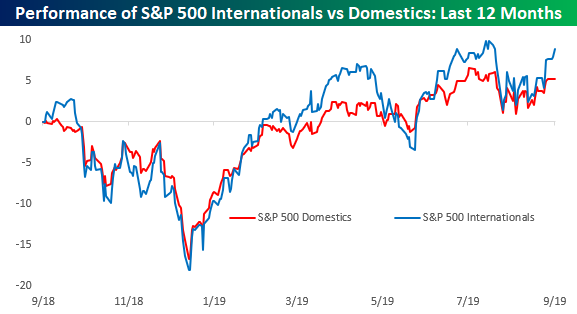
As you would expect, the Dollar Index’s pullback has benefited companies that derive the bulk of their sales outside of the United States. From last week’s peak through the close yesterday, our index of S&P 500 stocks that generate more than half of their sales outside of the US rallied over 3.6%, while our index of S&P 500 companies that generate more than 90% of their sales domestically was up just 1.6%.
With the dollar rallying today, one would expect our index of Internationals to be down or, at the very least, underperforming. As shown in the chart below, though, the Internationals are both up today and handily outperforming their domestically focused peers. In fact, while the Internationals are up nearly a full percent today, the S&P 500 is up less than half of one percent while the Domestics are actually down fractionally. Not what you would expect on a down day for the dollar.Start a two-week free trial to Bespoke Premium to access our International Revenues Database so you can track the revenue exposure of individual companies in the Russell 1000.
Activision Blizzard (ATVI) Not Playing Around
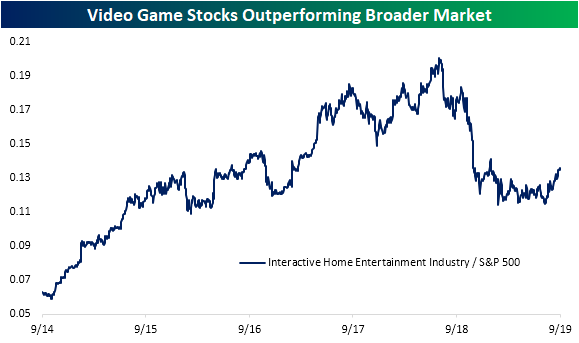
Rotation into recent underperformers has been discussed at length this week, but video game stocks are just one more example of this dynamic. Video game stocks like Activision Blizzard (ATVI), Electronic Arts (EA), and Take-Two Interactive (TTWO) saw a rough finish to 2018, and unlike other parts of the market, they never managed to retake their previous highs. Although it has been a slow climb back in 2019, the S&P 500 GICS Level 4 Interactive Home Entertainment Sub-Industry which is comprised entirely of these three major video game stocks has begun to rise more rapidly. In fact, the industry has started to outperform the broader market (S&P 500) since the end of July with this outperformance accelerating more recently, as shown in the chart below.
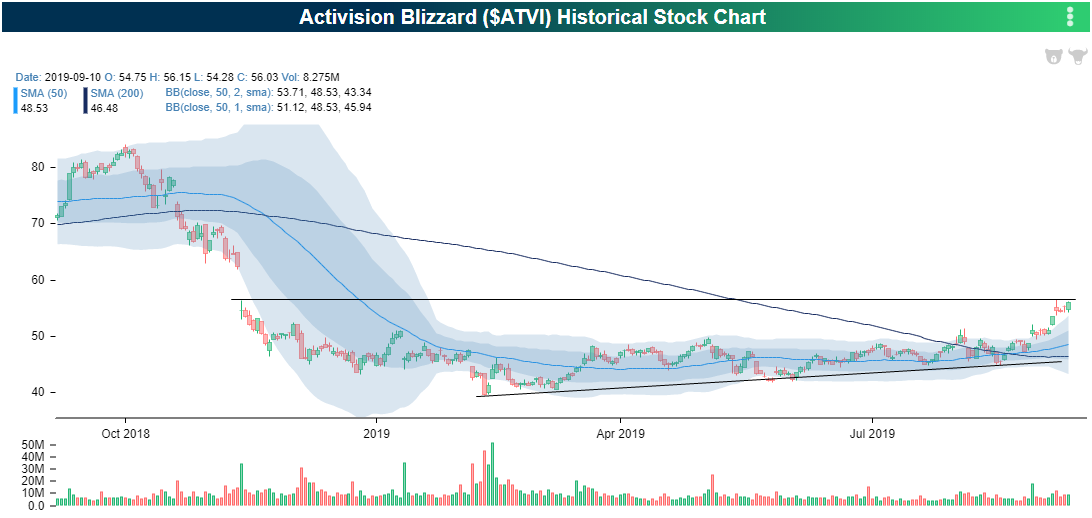
Perhaps the most notable of these stocks has been ATVI. Late last year, the stock saw a massive gap down followed by nearly a year of moving sideways with some marginally higher lows. In the past week, though, ATVI has surged nearly 10%, breaking out of this range, and reaching resistance where the stock gapped down to last year. There is plenty of room to run to the upside if the stock manages to break above this critical resistance level.
The yield on the dividend is far from high at just 0.66%, but Activision Blizzard has been paying a consistent and growing annual dividend since 2010; increasing on average over 10% per year in this time. While the opportunity to catch the annual $0.37 per share dividend has passed as the stock went ex-dividend back in March (as it has almost every year), the company is forecasted to raise next year’s dividend up to $0.40.
Looking forward, the company has plenty of catalysts that could prove beneficial to both the stock price as well as earnings. For starters, the company has some seasonal strength as consumers purchase their games heading into the holiday season; Q4 revenues have generally been the annual peak for the company. Additionally, the fall is usually when the company releases some of its biggest franchises. For example, the company’s newest installment of World of Warcraft was just released in the past few weeks with a warm reception and another major title, Call of Duty, is scheduled to come out in October.
Fixed Income Weekly – 9/11/19
Searching for ways to better understand the fixed income space or looking for actionable ideas in this asset class? Bespoke’s Fixed Income Weekly provides an update on rates and credit every Wednesday. We start off with a fresh piece of analysis driven by what’s in the headlines or driving the market in a given week. We then provide charts of how US Treasury futures and rates are trading, before moving on to a summary of recent fixed income ETF performance, short-term interest rates including money market funds, and a trade idea. We summarize changes and recent developments for a variety of yield curves (UST, bund, Eurodollar, US breakeven inflation and Bespoke’s Global Yield Curve) before finishing with a review of recent UST yield curve changes, spread changes for major credit products and international bonds, and 1 year return profiles for a cross section of the fixed income world.
In this week’s report we discuss equity market exposure to interest rates across both the aggregate market and for the leveraged community alone.

Our Fixed Income Weekly helps investors stay on top of fixed income markets and gain new perspective on the developments in interest rates. You can sign up for a Bespoke research trial below to see this week’s report and everything else Bespoke publishes free for the next two weeks!
Click here and start a 14-day free trial to Bespoke Institutional to see our newest Fixed Income Weekly now!
Bespoke’s Morning Lineup – Drifting Higher
See what’s driving market performance around the world in today’s Morning Lineup. Bespoke’s Morning Lineup is the best way to start your trading day. Read it now by starting a two-week free trial to Bespoke Premium. CLICK HERE to learn more and start your free trial.