Dividend Stock Spotlight: Phillips 66 (PSX)
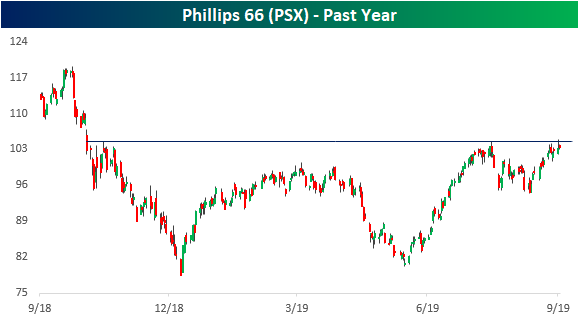
Crude oil, and as a result the energy sector, surged yesterday in response to attacks in Saudi Arabia which has damaged the country’s oil production. Crude rose over 14% while the Energy sector (XLE) rose 3.36%. Taking a more granular look at the sector, S&P 500 stocks across the GICS Level 4 sub-industries saw varied responses to the news. Drilling in addition to Exploration and Production companies were up the most, rising 14.3% and 7% respectively, while the Refining and Marketing industry, although still higher, only rose around 14 bps. Although this sub-industry did not explode higher on this news, Phillips 66 (PSX) in particular is looking attractive. Not only is the company’s 9.4 P/E below the median for the sub-industry (12.2) and sector (13.6), but PSX is also eyeing a nice technical breakout. Mid-summer and again in the past few weeks, PSX has stopped short of resistance around $105 which can be traced back to a short rally at the end of last year. in the past couple of days, it has come back up to these levels after putting in a higher low at the end of August.
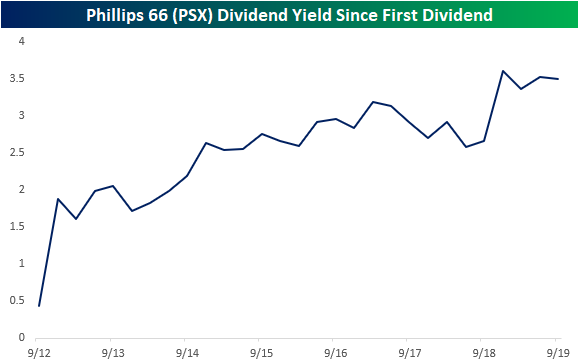
Even as the stock looks to breakout, at 3.5%, the current dividend yield is still near its highest level since PSX first began paying a dividend in 2012. This yield is also higher than the yield on the average S&P 500 energy stock which is currently at 3.05%. This dividend has been steadily growing at a rate of 13.8% over the past five years. The company has continued room to grow this dividend as the payout ratio is only at 28.67% and debt to equity only sits at 46.59%. For comparison, the average of these two ratios for all S&P 500 energy stocks is 73.64% and 58.4%, respectively. In other words, in addition to having technicals and valuation with potential, PSX also has a safe and sizable dividend to boot. Start a two-week free trial to one of our premium membership options to receive Bespoke’s most actionable stock market research.
Energy Dominates Yesterday’s Biggest Movers
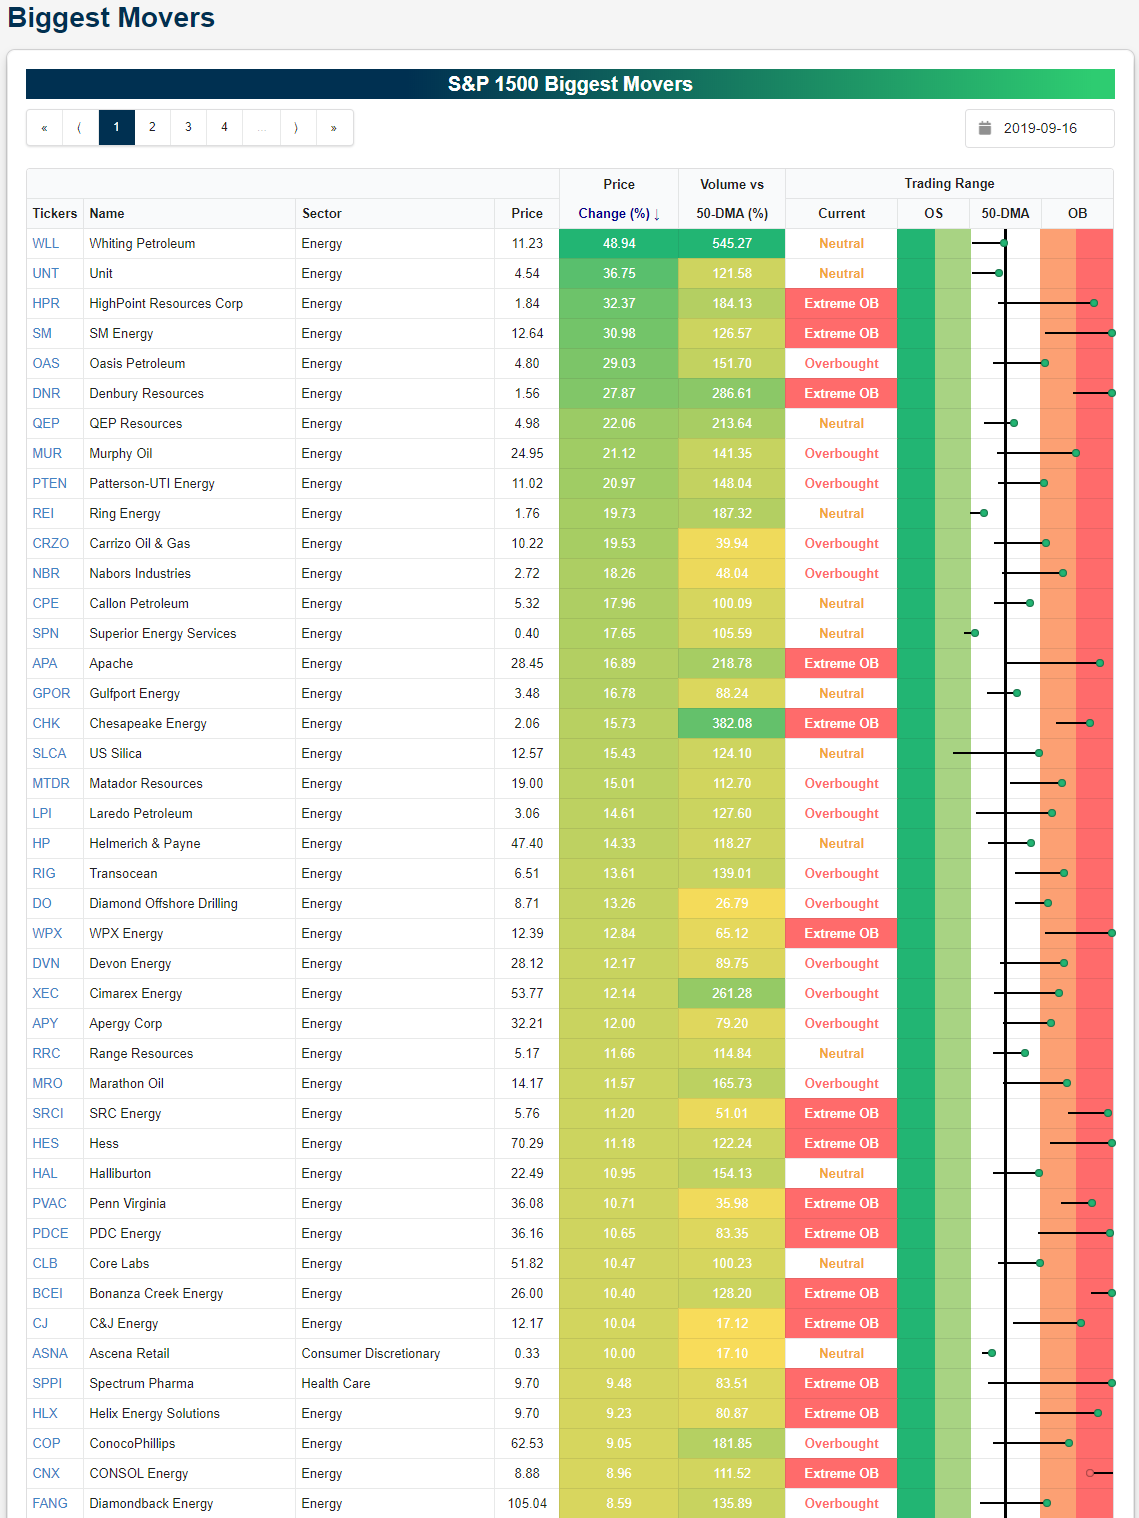
After crude oil surged over 14% yesterday, energy stocks unsurprisingly dominated the list of biggest movers as shown below. Of the S&P 1500’s stocks, Whiting Petroleum (WLL) gained the most yesterday with a nearly 50% gain. Volumes for WLL were also over 5 times higher than the average over the past 50 days.
While no other stock saw quite as large of a rally as WLL, 18 other stocks actually outperformed oil’s 14% gain on the day. Three of these rose over 30% and four rose over 20%. A large number also finished the day over 10% higher from Friday. For the most part, these were substantial moves within the individual stocks’ ranges as seen by the long tails in the Trading Range section of the tool shown below. Several finished the day in extreme overbought territory over two—for some over three—standard deviations above their 50-DMAs, but there are others that actually didn’t even manage to move back above their 50-DMAs even with these monster gains. WLL is one of these which finished just under half a percent below its 50-day. Start a two-week free trial to Bespoke Institutional to access our Biggest Movers tool, Trend Analyzer, Chart Scanner, and much more.
Bespoke Morning Lineup – Still Sorting Things Out
See what’s driving market performance around the world in today’s Morning Lineup. Bespoke’s Morning Lineup is the best way to start your trading day. Read it now by starting a two-week free trial to Bespoke Premium. CLICK HERE to learn more and start your free trial.

The Closer – Breadth, Decile Destroyed, GM Strike, Empire Manufacturing – 9/16/19
Log-in here if you’re a member with access to the Closer.
Looking for deeper insight on markets? In tonight’s Closer sent to Bespoke Institutional clients, we begin with a look at how breadth stacks up to the recent run-up in equities. We then show the evolution of our decile analysis based on YTD performance before showing the surge in crude oil in the context of EUR. Next, we review the GM strike and the historical implications on the market. We also show the remarkable uptick in strikes recently. We finish with a rundown of today’s Empire Manufacturing data..

See today’s post-market Closer and everything else Bespoke publishes by starting a 14-day free trial to Bespoke Institutional today!
Retail to Oil Ratio Drops Dramatically
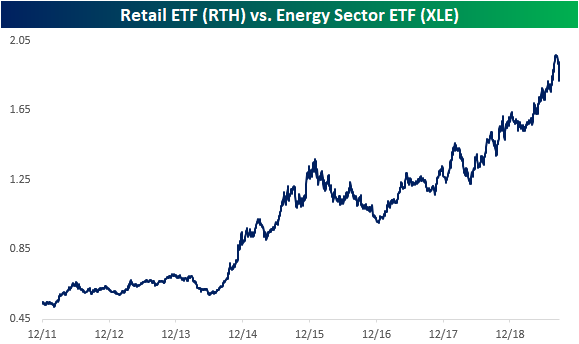
Crude oil’s 10%+ jump today had a negative impact on consumer-related areas of the equity market. Given the concern that higher oil prices will be a drag on global activity, the RTH Retail ETF fell more than 1.3% on a day when the S&P 500 was down just 30 basis points. Below is a historical chart of the ratio between RTH and the oil commodity ETF — USO. When the line is rising, the retail sector is outperforming oil, and vice versa for a falling line. This ratio has been trending higher throughout the decade, and it just recently hit a new high. But today that ratio fell out of bed as USO jumped and RTH fell. In fact, the steep drop in the ratio is the largest one day decline on record going back to 2011 when RTH first began trading. Similarly, with RTH down over 1.25%, USO is also outperforming in terms of percentage gain by the widest margin ever.

By that same vein, the ratio between retail and the energy sector (XLE) has also seen its largest single-day decline to date. Ironically, this is after the line went nearly vertical following retails’ massive run in August (around the time of earnings for these companies). This ratio has now pretty much given up that entire move upwards.
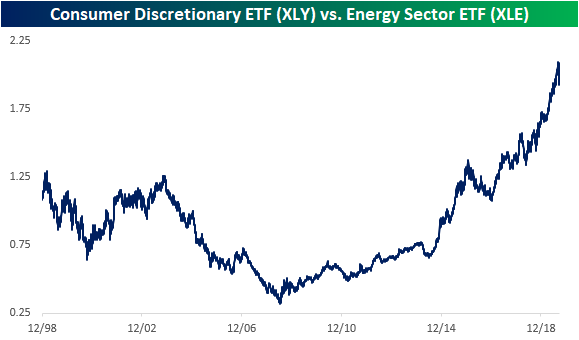
Even taking a broader scope, comparing the entire consumer discretionary sector to the energy sector, this ratio has also seen its largest single-day decline ever. But even though oil and energy are drastically outpacing other assets today, for most of the past several years that has not been the case.
It has been more than a decade since oil and the energy sector were long-term market leaders. Only time will tell if today’s huge drop in these ratios from record levels is the start of another extended period of outperformance for Energy. Start a two-week free trial to Bespoke Institutional to access our Security Analysis tool, Trend Analyzer, and much more.
Big Days Happen in….
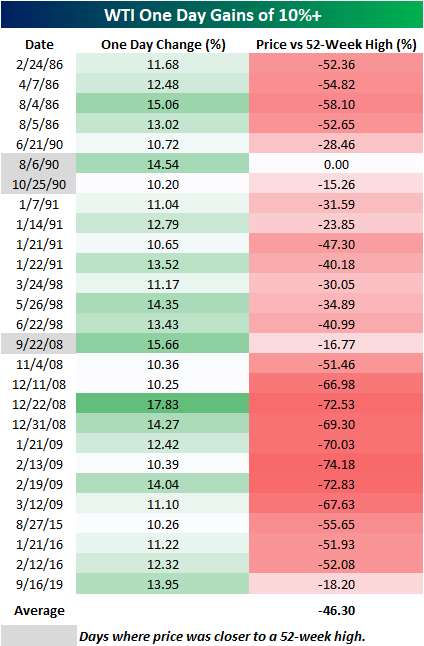
Crude oil rocketed higher today as WTI rallied just under 14% versus Friday’s close in what was the largest one-day gain since 2/19/09. There’s an old saying on Wall Street that big days happen in bear markets, and in the equity market that has tended to be the case as some of the largest percentage gains in stock market history were all during major bear markets. Looking at the largest one-day moves in crude oil shows a similar story as well.
The table below shows every one day gain of 10%+ in WTI going back to 1983, and for each day we have also shown how far crude oil was trading from its 52-week high after the one day gain of 10%+. In the case of today’s gain, WTI prices are still more than 18% below their 52-week high, and while that may sound like a lot, there have only been three other days of the 26 prior ones shown where crude oil rallied more than 10% and finished the day closer to a 52-week high than it did today (gray shaded dates). In fact, of all the days listed below, the average spread between WTI’s closing price on the day of the big gain and its 52-week high was over 46%! Talk about being in the hole! Start a two-week free trial to one of our three membership levels to receive Bespoke’s most actionable ideas.
This Week’s Economic Indicators – 9/16/19
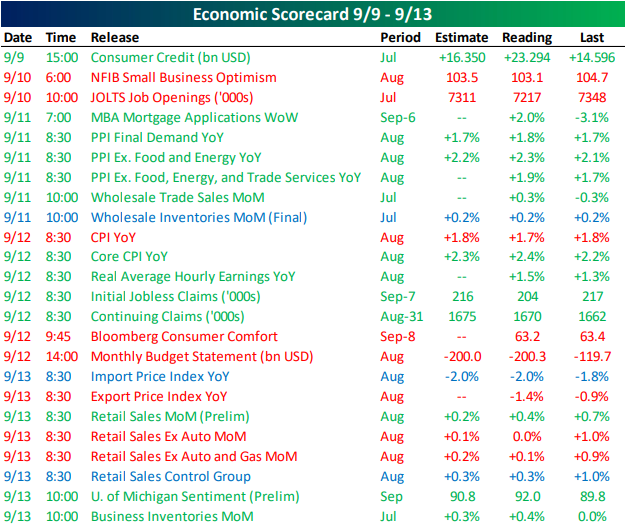
Last week was a solid one in economic data as a majority of US releases improved from the previous period or were better than forecasts were predicting. The only release on Monday was data on consumer credit for July which was much stronger than expected thanks to credit card spending. Tuesday’s JOLTS report and NFIB Small Business Optimism were both forecasted to weaken from the prior month’s release. Actual results were even weaker than these expectations. Despite the weaker JOLTS report, other labor data improved with NFIB data showing a record percentage of businesses reporting quality labor hard to find and NSA jobless claims at a 50-year low. Last week also saw multiple inflation releases including PPI, CPI, and export/import prices. While PPI was stronger than expected across the board, headline CPI was 0.1% below expectations, but core CPI remains solid at 2.4% (above forecasts of 2.3%). Export and import prices, on the other hand, remain in negative territory. Retail sales, released Friday, beat on the headline number but missed when removing auto and gas sales.
Turning to this week, it is another light start to the week with only Empire Manufacturing released today. The gauge on New York state manufacturing fell to 2.0 which is below both expectations (4.0) and the August reading (4.8). Still to come in manufacturing data this week is the Philadelphia Fed’s index (scheduled for Thursday) and Industrial Production tomorrow. As with the New York Fed’s index, the Philly Fed’s data is also expected to show weaker manufacturing activity in September which contrasts the stronger forecasts for Tuesday’s manufacturing data. A number of housing data points are also penciled in for this week including NAHB Homebuilder Sentiment, weekly mortgage applications, starts and permits, and existing home sales.
Following last week’s rate decision from the ECB, which saw rates cut in addition to a resumption of quantitative easing, on Wednesday markets will get an update on US monetary policy with the FOMC’s rate decision. The market is anticipating a second straight 25 bps cut to the lower and upper bound. Fed Chair Powell will also have a presser half an hour after the release of this rate decision. Although these Fed developments are likely to overshadow economic data, this week will also see the release of the Leading Index for August as well as the second quarter’s current account and the Fed’s Z.1 Financial Flows Report.
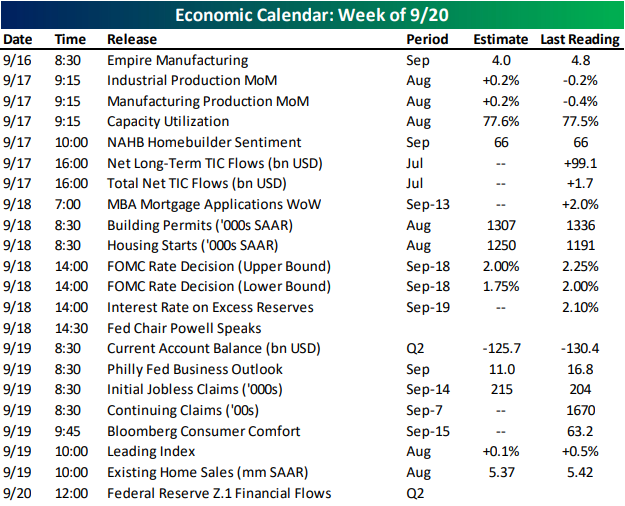
Chart of the Day: Energy Ownable After Oil Upthrust?
Weaker Than Expected Empire Manufacturing Report
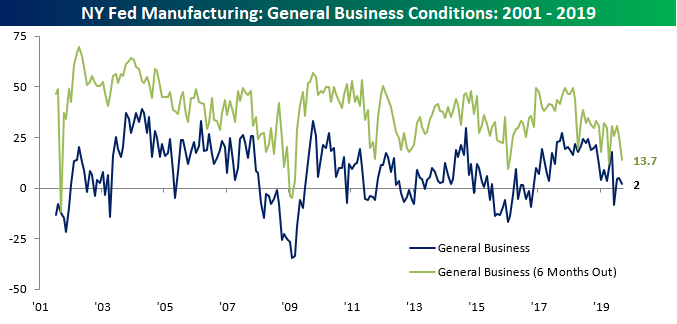
Economists were expecting a bit of weakness in the September Empire Manufacturing report, but the actual reading came in a bit weaker than those forecasts. The release of the headline General Business conditions index dropped 2.8 points from 4.8 down to 2.0. While the index of present General Business conditions only fell slightly, expectations for the next six months were notably weaker falling from 25.7 down to 13.7. While both of these indices are well off their highs from the last year or two, they also aren’t at levels that at this point would be considered dangerous for the economy.
The table below breaks down this month’s report by each of the survey’s sub-indices. As far as present conditions are concerned, New Orders and Shipments both declined, but every other category for present conditions increased, and only one (Unfilled Orders) is contracting. Looking out towards the future, though, sentiment is not nearly as positive. As shown on the right side of the table, the only two indices that increased this month were Prices Paid and Prices Received. So manufacturers are expecting weaker growth and higher inflation. That’s never a good mix!
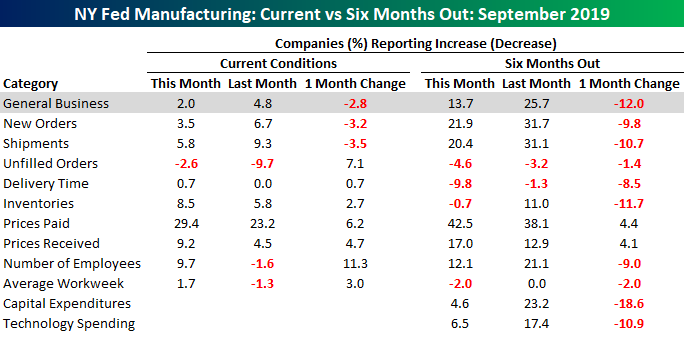
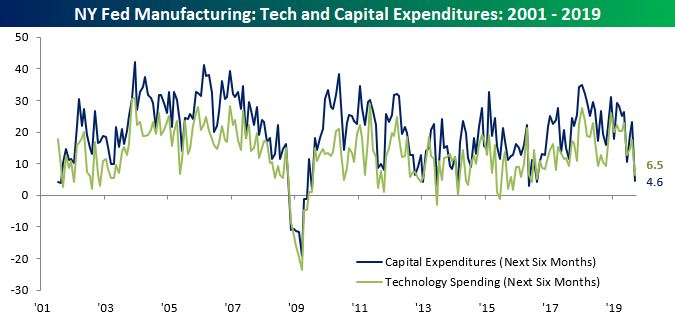
One notable aspect of the table above is the large drops in expectations for Capital Expenditures and Technology Spending. The index that tracks plans for Technology spending fell 10.9 points from 17.4 down to 6.5 in what was the largest monthly drop since May 2016. Plans for Capital Expenditures were even worse as that index fell 18.6 points from 23.2 down to 4.6. For that index, it was the third-largest decline in the report’s history dating back to 2001 and the largest monthly decline since May 2016. Here again, though, while these declines are pretty steep, they aren’t at levels that in the past have been considered recessionary. Then again, back at the onset of the recession in December 2007, both of these levels were higher then than they are now. Start a two-week free trial to one of our three membership levels to receive Bespoke’s most actionable ideas.
Bespoke’s Morning Lineup — Could Be Worse
See what’s driving market performance around the world in today’s Morning Lineup. Bespoke’s Morning Lineup is the best way to start your trading day. Read it now by starting a two-week free trial to Bespoke Premium. CLICK HERE to learn more and start your free trial.
With attacks on Saudi Arabian oil facilities disrupting more than 5% of global supply and oil prices surging by nearly 10%, one would have thought we would be in for a rough day in the equity market. While the opening bell still hasn’t even rung yet, US equity futures are indicating only a modest decline, so it could be worse.
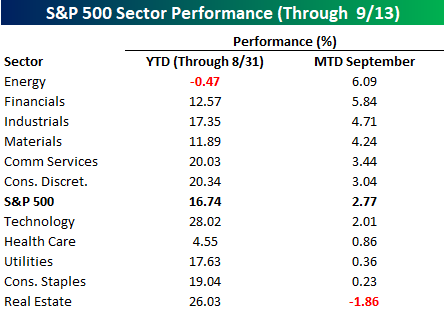
One sector that will benefit from the flaring tensions in the Middle East is the Energy sector. In pre-market trading, the Energy sector ETF (XLE) is trading up close to 5%. Interestingly enough, did anyone notice that heading into this weekend, the Energy sector was the best performing sector so far this month after being the worst performer YTD through the end of August (table below)?