Fixed Income Weekly – 9/18/19
Searching for ways to better understand the fixed income space or looking for actionable ideas in this asset class? Bespoke’s Fixed Income Weekly provides an update on rates and credit every Wednesday. We start off with a fresh piece of analysis driven by what’s in the headlines or driving the market in a given week. We then provide charts of how US Treasury futures and rates are trading, before moving on to a summary of recent fixed income ETF performance, short-term interest rates including money market funds, and a trade idea. We summarize changes and recent developments for a variety of yield curves (UST, bund, Eurodollar, US breakeven inflation and Bespoke’s Global Yield Curve) before finishing with a review of recent UST yield curve changes, spread changes for major credit products and international bonds, and 1 year return profiles for a cross section of the fixed income world.
In this week’s report we continue to discuss the repo market amidst extreme volatility this week.

Our Fixed Income Weekly helps investors stay on top of fixed income markets and gain new perspective on the developments in interest rates. You can sign up for a Bespoke research trial below to see this week’s report and everything else Bespoke publishes free for the next two weeks!
Click here and start a 14-day free trial to Bespoke Institutional to see our newest Fixed Income Weekly now!
B.I.G. Tips – Housing Breaks Out
We’ve just published our recap of the latest stronger than expected Housing Starts and Building Permits reports. If you’d like to see our analysis of the report and what it means for the economy and the stocks of homebuilders, start a two-week free trial to Bespoke Premium. You won’t be disappointed!

Bespoke’s Global Macro Dashboard — 9/18/19
Bespoke’s Global Macro Dashboard is a high-level summary of 22 major economies from around the world. For each country, we provide charts of local equity market prices, relative performance versus global equities, price to earnings ratios, dividend yields, economic growth, unemployment, retail sales and industrial production growth, inflation, money supply, spot FX performance versus the dollar, policy rate, and ten year local government bond yield interest rates. The report is intended as a tool for both reference and idea generation. It’s clients’ first stop for basic background info on how a given economy is performing, and what issues are driving the narrative for that economy. The dashboard helps you get up to speed on and keep track of the basics for the most important economies around the world, informing starting points for further research and risk management. It’s published weekly every Wednesday at the Bespoke Institutional membership level.
You can access our Global Macro Dashboard by starting a 14-day free trial to Bespoke Institutional now!

Bespoke’s Morning Lineup – “Fed” is the Word
See what’s driving market performance around the world in today’s Morning Lineup. Bespoke’s Morning Lineup is the best way to start your trading day. Read it now by starting a two-week free trial to Bespoke Premium. CLICK HERE to learn more and start your free trial.

The Closer – Repo Rundown: Why Funding Has Gotten Funky – 9/17/19
Log-in here if you’re a member with access to the Closer.
Looking for deeper insight on markets? In tonight’s Closer sent to Bespoke Institutional clients, we begin with a look at the pauses in the recent runs of small caps, high yield energy, and crude oil. We then review today’s release of industrial production before explaining what’s been going on with the New York Fed’s open market operations given the action in repo markets.

See today’s post-market Closer and everything else Bespoke publishes by starting a 14-day free trial to Bespoke Institutional today!
B.I.G. Tips – Fed Days September 2019
We’ve just published our regular pre-Fed report ahead of an expected rate cut from Chair Powell tomorrow. If you’d like to see our analysis of Fed expectations for tomorrow and beyond, and how the stock market typically reacts to rate cuts, start a two-week free trial to Bespoke Premium. You won’t be disappointed!
Manic Market Moves
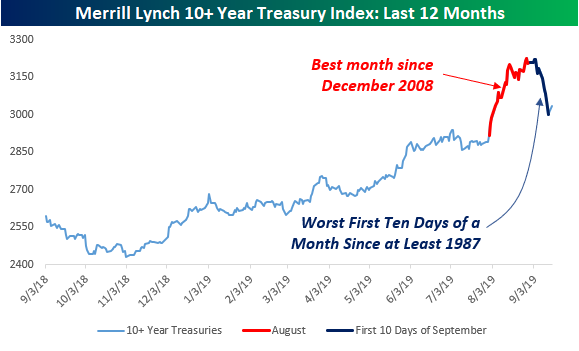
We’ve seen a lot of crazy moves in the market over the last couple of weeks. From the massive rotation into value stocks from momentum last week to the moves in oil yesterday and today, it’s really hard to tell how the underlying trend in markets is going to play out. With all this uncertainty, you may be tempted to park some cash in treasuries until things settle down. The only problem with that strategy is that moves in the treasury market have been just as chaotic.
While risk-free rates are still at incredibly low levels relative to history, it masks the fact that long-term US Treasuries are having a horrible start to the month. Using the Merrill Lynch 10+ Year US Treasury Index as a proxy, in the first ten trading days of September, long-term US Treasuries fell 6.5% for their worst opening ten-trading day start to a month since at least 1987 (when daily data begins). In the span of about six weeks, long-term treasuries have seen their best monthly gain in nearly 11 years followed by their worst start to a month in at least 30 years. Perfectly rational. Start a two-week free trial to Bespoke Institutional to access our interactive economic, earnings, and seasonality tools.
Homebuilder Sentiment Reaches 11-Month High
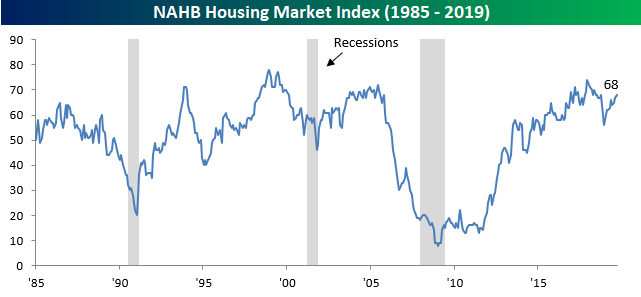
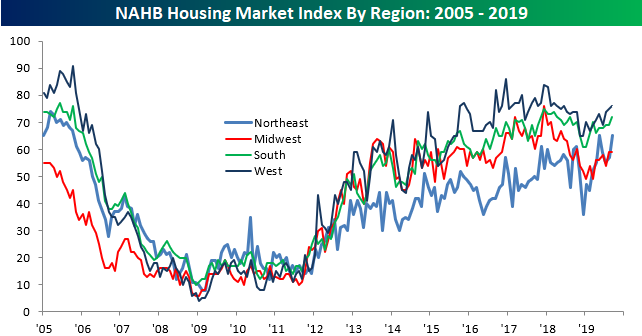
Treasury yields have started to move higher from the record low levels reached in August, but sentiment among homebuilders remains strong as even at these levels interest rates are making housing much more affordable. The latest release of sentiment from the National Association of Homebuilders (NAHB) came in stronger than expected, rising from 67 up to 68 versus estimates for a reading of 66. At the current level of 68, sentiment is the highest it has been since last October, just before the market swooned in Q4.
Looking at the internals of this month’s report, strength was pretty broad-based. In terms of the headline index’s components, Future Sales was the only one that declined, and the magnitude of that drop was only modest. Present Sales increased from 73 up to 75, while Traffic was unchanged right at the neutral mark.
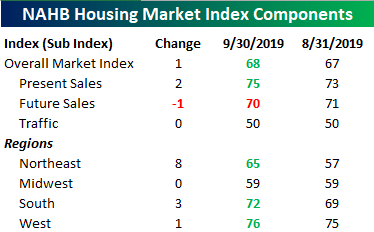
The chart below shows the regional breakdown of homebuilder sentiment going back to 2005. Sentiment in the Midwest was unchanged at 59 and is now the region of the country where sentiment is the weakest. That tag previously belonged to the Northeast, but after this month’s 8 point jump, sentiment in that region of the country is tied for its highest level since the Financial Crisis. Sentiment in the South and West saw smaller improvements in sentiment this month, but builders in those regions are still much more optimistic than they are in the Midwest and Northeast. Start a two-week free trial to Bespoke Institutional to access our interactive economic tools.
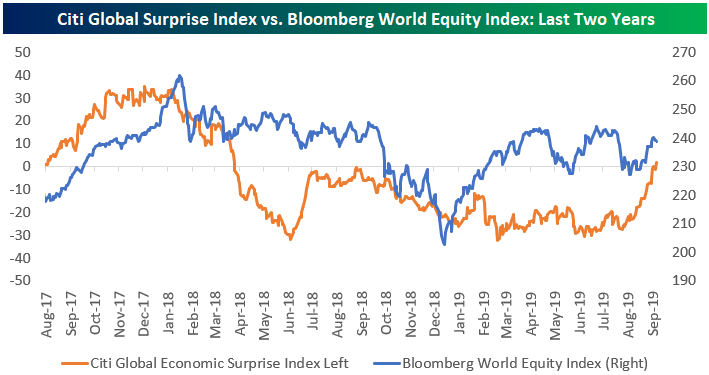
Citi Global Surprise Breaks Record Streak of Days in Negative Territory
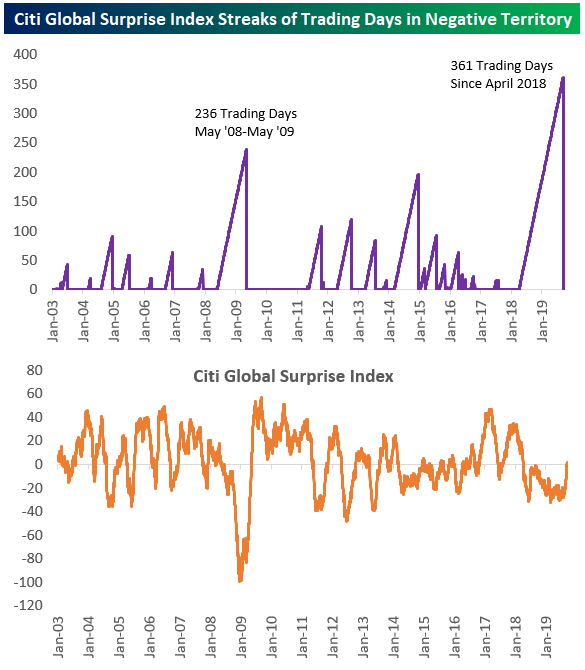
The Citi Global Surprise index measures the pace at which economic indicators around the world are coming in better than expected compared to economist estimates. As an example of how weak the global economy has been over the last 18 months, the Citi Global Surprise index was in negative territory for a record 361 trading days from April 2018 through last Thursday. But just in time for what will likely be another rate cut from the Fed this week, the Global Surprise index broke its record streak on Friday by closing in positive territory.
As shown below, not even during the Financial Crisis did the surprise index remain negative for so long. Back in 2008 and 2009, however, the Surprise index got much more negative than it did at any point during the streak that just ended. Start a two-week free trial to Bespoke Institutional to access our Biggest Movers tool, Trend Analyzer, Chart Scanner, and much more.
Below is a chart comparing the Citi Global Surprise index to the Bloomberg World equity market index over the last two years. The two don’t track each other very closely. In mid-2018, the Surprise index saw a spike similar to the one we’ve seen over the last couple of months, but that spike was followed by a very weak fourth quarter for the global stock market. The Surprise index didn’t predict the Q1 2019 bounce-back for stocks either.