Best and Worst Performing Sectors on Earnings
More than 2,000 companies have now reported their Q2 earnings results since early July, including 422 S&P 500 companies. Below we show the average one-day price change for stocks on their earnings reaction days broken out by sector and whether the stock is in the S&P 500 or not.
The average S&P 500 stock that has reported has gained 0.44% on its earnings reaction day this season, while the average non-S&P 500 stock has averaged a gain of 0.51%. While these two numbers are very close to each other, the performance numbers differ significantly when looking at individual sectors.
For example, the average non-S&P 500 Technology stock that has reported has gained 0.95% on its earnings reaction day this season, while the average S&P 500 Tech stock has actually fallen 0.60%. Tech has been the worst sector in the S&P 500 this season when it comes to stock price reactions. Investors have been “selling the news” for large-cap Tech, but they’ve been buyers of Tech at lower market cap levels.
The same is true for Financials, Energy, and Consumer Discretionary. S&P 500 stocks in these three sectors have averaged declines on their earnings reaction days this season, but non-S&P 500 stocks in these sectors have averaged gains. Non-S&P 500 Consumer Discretionary stocks have gained an average of 1.34% on their earnings reaction days, which is the second best of any sector.
On the flip side, Utilities, Health Care, Real Estate, and Materials stocks in the S&P 500 have averaged gains on their earnings reaction days, while non-S&P 500 stocks in these sectors have averaged declines.
The only two sectors where investors have been big buyers on earnings regardless of market cap is Industrials and Consumer Staples. Stocks in these two sectors have seen huge gains this earnings season. The average Industrials stock in the S&P 500 has gained 2.42% on its earnings reaction day, while the average Consumer Staples stock in the S&P 500 has gained 2.62%. Non-S&P 500 Industrials and Consumer Staples stocks have gained 0.78% and 1.90%, respectively, on their earnings reaction days.

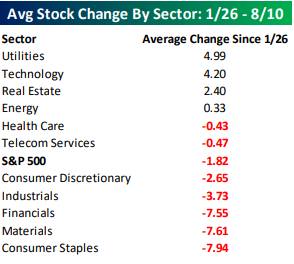
Sector Performance Breakdown Since the 1/26 Peak
The waiting game for new highs in the S&P 500 continues. Even though the S&P hasn’t moved much at the index level since January 26th, many of its components have seen big moves. The table below summarizes the average performance of individual S&P 500 components grouped according to sector since the 1/26 closing high. Leading the way higher, Utilities has been the best sector with an average gain of just under 5%, but right on the sector’s heels is Technology where stocks are up an average of 4.2%. Besides these two sectors, the only two other sectors where the average stock is up since 1/26 are Real Estate and Energy. To the downside, in three sectors (Consumer Staples, Materials, and Financials), the average stock is down over 7%. That’s quite a big decline given that the S&P is within 2% of record highs.
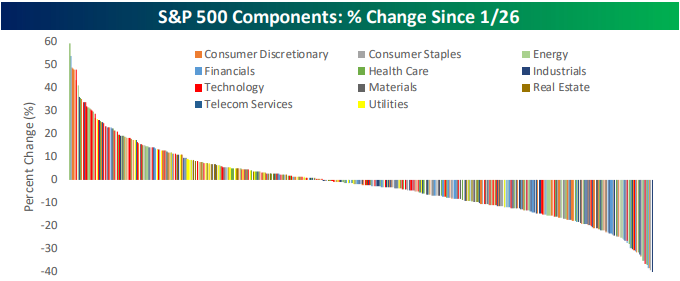
The chart below shows the return of individual S&P 500 stocks since 1/26 color coded according to sector. Among the 500 individual components in the index, there are a number of big winners and big losers which have each moved over 25%.
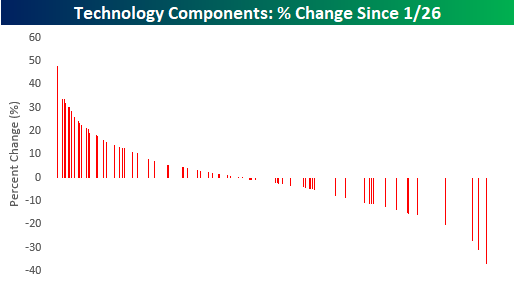
While it nearly impossible to distinguish between each color bar in the chart above, we did it that way for a reason. Below we only show the returns of stocks in the Technology sector from the chart above. Even though Tech hasn’t been the absolute best performer over that period, because of the large number of stocks in the sector and the fact that most of them have seen positive returns, the sector has had a major positive impact.
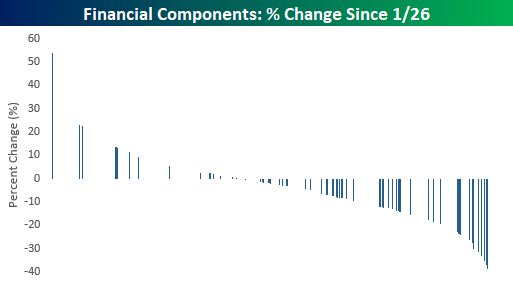
For Financials, it’s the exact opposite. While stocks in the sector are only the third worst in terms of average performance, because there are so many stocks in the sector and they are mostly lower, the Financials have been a major drag.
Rest of World Weakness
As the dollar strengthens and the S&P 500 sits comfortably above its 50-day moving average, international equity market ETFs remain stuck in the mud. Below is a snapshot of regional ETFs from our Trend Analyzer tool. These are ETFs that US investors purchase to gain exposure to the rest of the world, and ownership of them in 2018 has certainly acted as a drag on portfolios.
Aside from a couple global ETFs in the snapshot that have US exposure, the entire list is in the red. They’re in the red on a year-to-date basis, over the last week, and they’re below their 50-day moving averages.
Our “Bespoke Trend” reading is a proprietary algorithm that determines whether a stock or ETF is in a long-term uptrend, downtrend, or sideways trend, and 16 of the 22 ETFs in the screen below are in long-term downtrends. In addition, 13 of 22 ETFs have moved lower into oversold territory over the last week, meaning they’re more than one standard deviation below their 50-day moving averages.
For those in the asset allocation business, it’s probably a good time to add a little exposure to international equities and lower exposure to US equities.

Bespoke Brunch Reads Linkfest — 8/12/18
Welcome to Bespoke Brunch Reads — a linkfest of the favorite things we read over the past week. The links are mostly market related, but there are some other interesting subjects covered as well. We hope you enjoy the food for thought as a supplement to the research we provide you during the week.
Mega Tech
Apple’s $1 Trillion Milestone Reflects Rise of Powerful Megacompanies by Matt Phillips, NY Times
Social Problems
Tech giants are still stumbling in the social world they created, AP
Inside Twitter’s Struggle Over What Gets Banned by Cecilia King and Kate Conger, NY Times
A Generation Grows Up in China Without Google, Facebook or Twitter by Li Yuan, NY Times
Socialism Problems
America might be ready for democratic socialism. It’s not ready for the bill. by Brian Riedl, Vox.com
Straw Problems?
The Summer of Plastic-Straw Bans: How We Got There by Corrine Ramy and Bob Tita, WSJ
Infrastructure
How 2,000-year-old roads predict modern-day prosperity by Christopher Ingraham, Washington Post
The quest to redesign NYC’s garbage cans by Kelsey Campbell-Dollaghan, Fast Company
Impacts
We May Never Understand the Ocean-Wide Damage Done by Industrial Whaling by Peter Brannen, The New Yorker
Markets and Trading
End of pension fund tax break looms over Treasury market by Joe Rennison, Financial Times
Winton’s David Harding on Turning Away From Trend Following by Rob Mannix, Risk.net
Vanguard Warns of Worsening Odds for the Economy and Markets by Jeff Sommer, NY Times
Online Stock Trading Has Serious Security Holes by Brian Barrett, Wired
Intrigue
Behind Hollywood’s McDonald’s-Monopoly Article Bidding War by Chris Less, Vulture
A Strike is Looming
Baseball’s Best Players Should Be a Lot Richer by Owen Poindexter, Slate
Ponder
Unknown Unknowns: The Problem of Hypocognition by Kaidi Wu and David Dunning, Scientific American
The Bespoke Report – The Calm Breaks
Best Sector This Earnings Season — Consumer Staples?
As noted in our prior post, the average stock that has reported earnings this season has gained 0.52% on its earnings reaction day. Below we break down the average earnings reaction day change by sector this season.
As shown, Consumer Staples stocks that have reported have averaged a huge gain of 2.09% on their earnings reaction days this season. Coming into this quarter, Consumer Staples was one of the most beaten down sectors of the year, so it looks as if investors got a little too bearish. Industrials and Consumer Discretionary stocks are also averaging big gains on their earnings reaction days, while Technology stocks are outperforming as well.
Not all sectors are seeing gains in reaction to earnings reports. Five of eleven sectors have seen their stocks average declines on their earnings reaction days this season. Real Estate, Health Care, and Materials stocks have been the weakest, but with average declines of just -0.20% or less, the declines haven’t been that painful.

Stocks Reacting Positively to Earnings
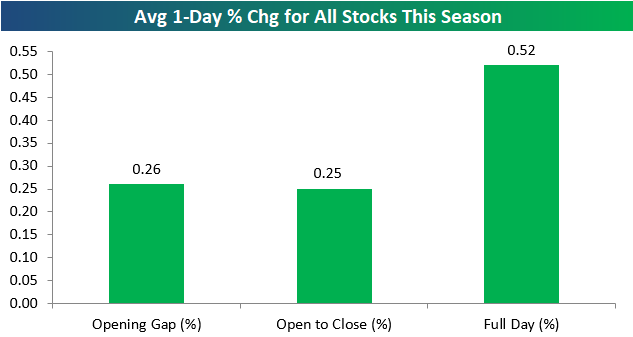
The second quarter earnings reporting period has actually been the most bearish for stock price reactions throughout history. It’s the only quarter of the year where stocks have historically averaged a decline (-0.09%) on their earnings reaction days going back to 2001. As shown below, though, this Q2 is shaping up very positively. The average stock that has reported this season has gained 0.52% on its earnings reaction day. (For a stock that reports after the close, its earnings reaction day is the next trading day. For a stock that reports before the open, its earnings reaction day is that trading day.)
Notably, investors have bid up stocks in after-hours and pre-market trading after they’ve reported, and they’ve bid them up more during regular trading hours. Also shown in the chart below, the average stock that has reported this season has opened higher at the start of the trading day by +0.26%, and then it has averaged a further gain of 0.25% from the open of trading to the close. (The combination of the opening gap of 0.26% and the open to close move of 0.25% results in a full day change of +0.52%).
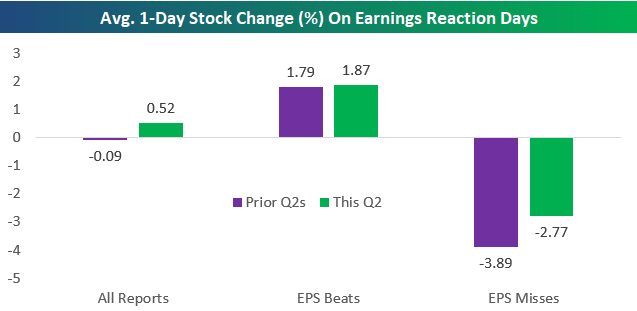
During prior Q2 reporting periods, the average stock that has reported has fallen 0.09% on its earnings reaction day. In addition, the average stock that has beaten EPS estimates has gained 1.79% on its Q2 earnings reaction day, while the average stock that has missed EPS estimates has fallen 3.89% on its Q2 earnings reaction day.
This season, earnings beats are performing slightly better than they normally do, while earnings misses are falling less. As shown in the chart below, the average EPS beat this season has risen 1.87% on its earnings reaction day, while the average EPS miss has only fallen 2.77%. Compared to prior Q2s, smaller declines for EPS misses this season is the big story.
Guidance Readings Down But Still Positive
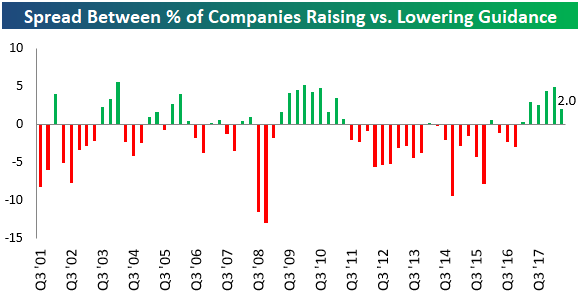
Just as earnings and revenue beat rates have dipped a bit this quarter, our guidance spread has also dipped. Below is a chart showing the spread between the percentage of companies raising guidance minus lowering guidance each quarter going back to 2001. This season, the guidance spread stands at +2 percentage points, so more companies are raising guidance than lowering guidance. As you can see in the chart, though, the spread is lower this season than it has been in the prior four quarters, indicating that companies aren’t quite as optimistic now as they’ve been at prior points over the last year.
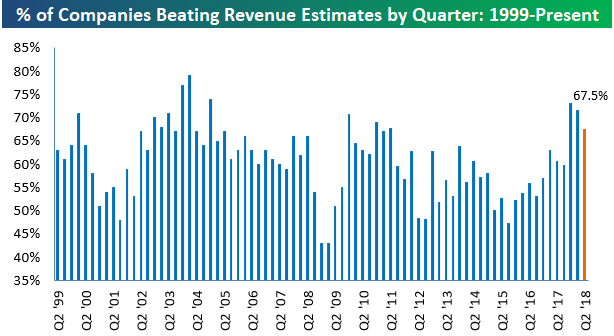
Top and Bottom Line Beat Rates Strong But Down a Bit From Prior Quarters
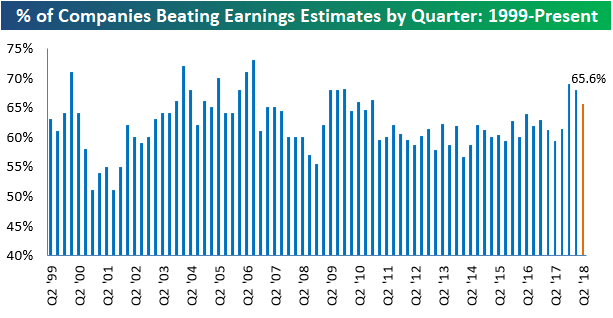
More than 2,000 companies have now reported their Q2 earnings results, and as we show below, 65.6% of companies have beaten bottom-line consensus analyst EPS estimates. The 65.6% EPS beat rate this season is above the average of just over 60% that we’ve seen going back to 1999, but it’s definitely down from the stronger readings seen over the prior two quarters.
The top-line revenue beat rate is also down versus the prior two quarters. As shown below, this season we’ve seen 67.5% of companies beat top-line consensus revenue estimates.
Even though the top and bottom line beat rates are above their long-term averages, we have seen a slowdown from the extremely high readings seen over the prior two quarters.
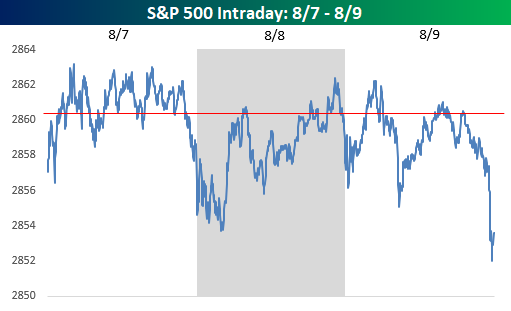
The Closer — False Alarm?
Log-in here if you’re a member with access to the Closer.
What is it with 2,860 this week. After a strong day on Monday, it seemed as though getting back to the January highs would be a mere formality for the S&P 500, but in the last three days, it hasn’t even been able to trade and close above 2,860.
In tonight’s Closer sent to Bespoke Institutional clients, we look at how equities perform after the VIX closes at a six-month low for the first time in at least six months. We also look at prior periods where the S&P 500 went at least six months between new highs to see how common it was for the index to make a run for new highs, only for it to end up being a false alarm.
See today’s post-market Closer and everything else Bespoke publishes by starting a 14-day free trial to Bespoke Institutional today!