Earnings Season Begins
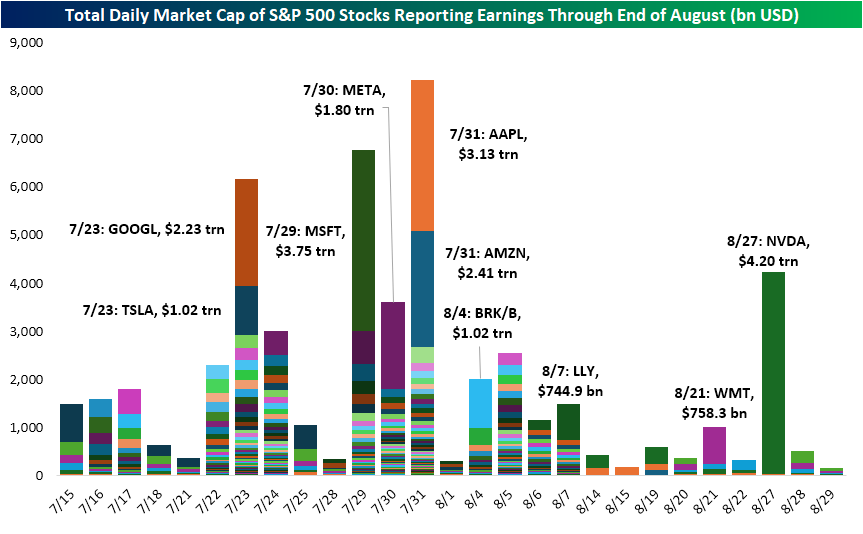
The first of the big banks have reported this morning which means that earnings season is off to the races. For S&P 500 members, Thursday will be the busiest day this week with 17 stocks reporting, and early next week is when the earnings slate really takes off with a total of 44 stocks reporting Tuesday and 47 on Wednesday. As shown below, in addition to having a higher number of stocks reporting, part-way through next week will also account for a significant portion of S&P 500 market cap reporting. On Wednesday (7/23), the first of the mega-caps are up as Alphabet (GOOGL) and Tesla (TSLA) account for nearly half of the over $6 trillion in market cap reporting that day. Most of the rest of the mega-caps will report in the following week with Microsoft (MSFT) starting things off on Tuesday, July 29, with Meta Platforms (META) the next day (7/30), and Apple (AAPL) and Amazon (AMZN) out the day after that (7/31). While Wal-Mart (WMT) has historically marked the unofficial end of earnings season, nowadays it’s NVIDIA (NVDA) that caps things off. WMT is set to report on 8/21, while NVDA is six days later on 8/27.
As noted previously, this week’s earnings are dominated by big banks and financial centers. In the chart below, we show the share of stocks from each sector that are reporting each day through the end of August. As shown, the next few days are predominately Financials with Industrials also accounting for a steady share of results (hovering around low double digits). The following few weeks until mid-August (which is the peak of earnings season) has a much greater variety in sectors reporting results whereas the tail end of August is predominately Tech names.
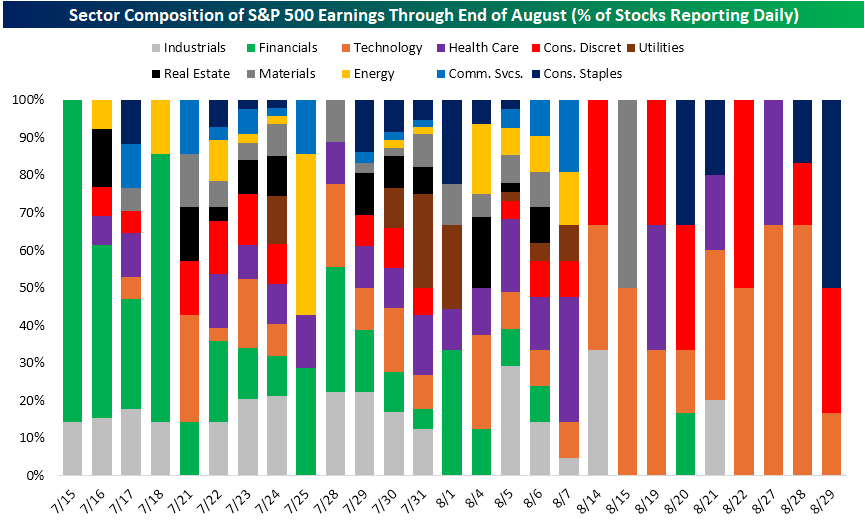

Chart of the Day: Longshots Update
Bitcoin, IBIT Trounce Stocks
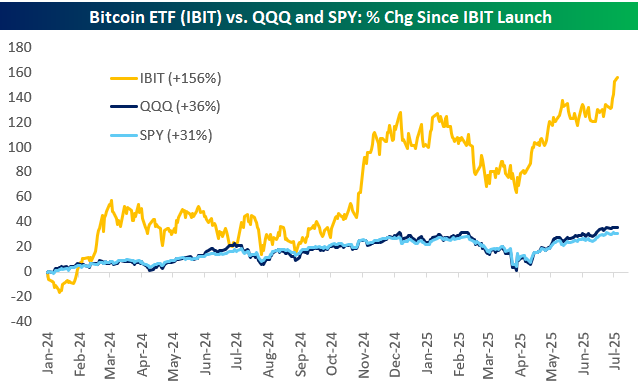
The iShares Bitcoin ETF (IBIT) has been the fastest-growing ETF of all time, eclipsing $70 billion in assets in less than 18 months and currently up to $85 billion. That’s already big enough to rank it in the top 20 or so of the largest “mega-ETFs” in the US.
Since its closing price on launch day back on January 11th, 2024, IBIT is up 156%. That compares to gains of 36% for the Nasdaq 100 ETF (QQQ) and 31% for the S&P 500 ETF (SPY).
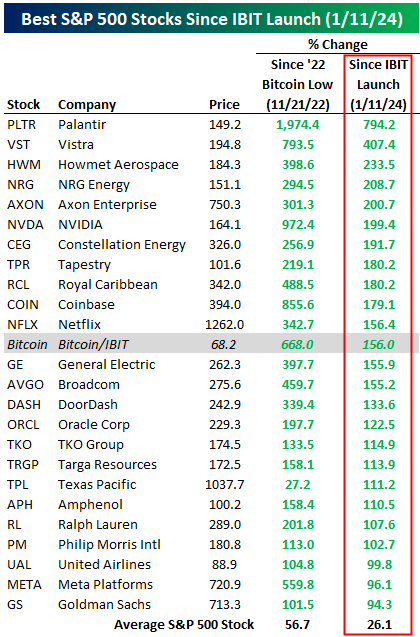
Compared to current S&P 500 stocks, IBIT’s gain of 156% since it launched on 1/11/24 would rank 12th in terms of performance. There are eleven stocks in the index up even more than that, led by Palantir’s (PLTR) gain of 794%. Other big winners since IBIT launched include Vistra (VST), Howmet Aerospace (HWM), Axon (AXON), NVIDIA (NVDA), Tapestry (TPR), Royal Caribbean (RCL), Coinbase (COIN), and Netflix (NFLX). There are 21 stocks in the S&P up more than 100% since IBIT’s launch in early 2024, while the average stock in the index is up 26.1%.
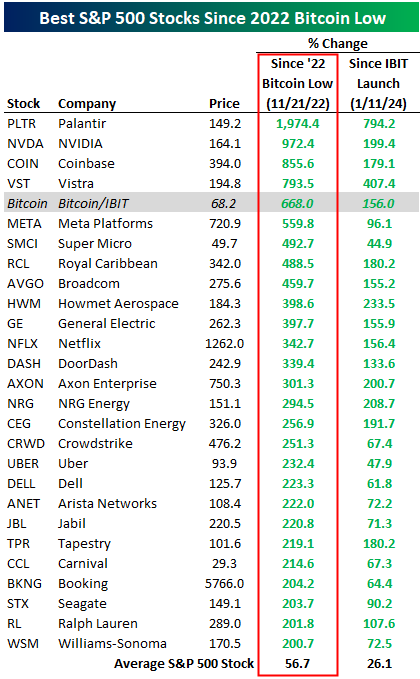
Bitcoin prices were in the mid-$10,000s back in November 2022. Since its low point during that month, Bitcoin is up 668%. We also looked to see how that gain compares to the best-performing S&P 500 stocks over the same time frame. As shown below, just four stocks in the index are up more than Bitcoin since its 2022 low: Palantir (PLTR) — up nearly 2,000%, NVIDIA (NVDA) — up nearly 1,000%, Coinbase (COIN), and Vistra (VST). Another four stocks are up more than 400% over the same time frame: Meta (META), Super Micro (SMCI), Royal Caribbean (RCL), and Broadcom (AVGO).
Bespoke’s Morning Lineup – 7/15/25 – And They’re Off
See what’s driving market performance around the world in today’s Morning Lineup. Bespoke’s Morning Lineup is the best way to start your trading day. Read it now by starting a two-week trial to Bespoke Premium. CLICK HERE to learn more and start your trial.
“The first step towards getting somewhere is to decide that you are not going to stay where you are.” – J.P. Morgan

Below is a snippet of commentary from today’s Morning Lineup. Start a two-week trial to Bespoke Premium to view the full report.
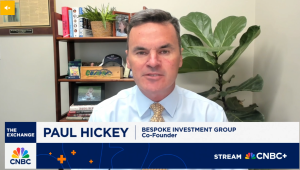
To view yesterday’s CNBC segment on “The Exchange” where we discussed sentiment leading up to the Q2 earnings season, please click on the image below.
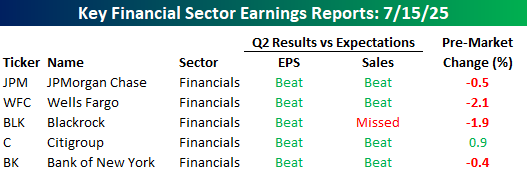
It’s taken long enough, but the Q2 earnings season is finally here, with several large banks, including J.P. Morgan Chase (JPM), reporting this morning. Of the reports we’ve seen so far, the results have generally been good, with five companies beating EPS forecasts and four topping consensus forecasts for sales. In response to the positive reports, though, four of the five stocks are trading lower. The magnitude of the declines has been very modest, and it’s still early, but the negative reactions could be a signal that investors have high expectations heading into earnings season.
While investors are taking a sell-the-news reaction to this morning’s results, futures for the S&P 500 and Nasdaq are both higher heading into this morning’s CPI report. The positive tone in futures stems from an announcement from Nvidia (NVDA) that it would resume sales of its H20 chips in China. In Europe this morning, markets are little changed, with the STOXX 600 up 0.2% while equities were mostly higher in Asia overnight.
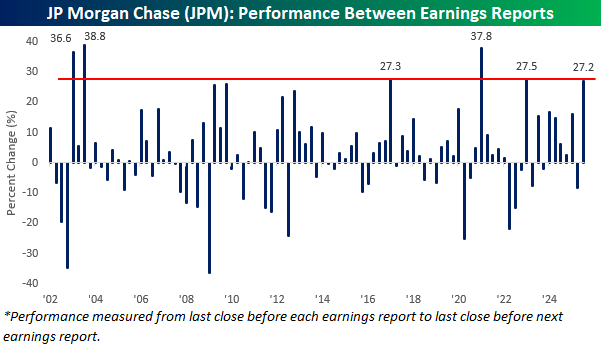
In yesterday’s CNBC segment, we discussed how the expectations bar is higher heading into this earnings season than it was last earnings season. To illustrate, let’s look at JP Morgan Chase (JPM). The chart below shows JPM’s performance from the close before one earnings report to the close before the next. Heading into today’s report, JPM had rallied 27.2% since the close before its last earnings report, and that ranks as the sixth-best performance between earnings reports since at least 2002 and the best since the three months leading up to its January 2023 earnings report. During Covid, JPM rallied 37.8%, and there were two quarters following the dot-com bust when the stock also rallied by more than 35%.
Just because JPM has rallied a lot leading up to this quarter’s report doesn’t mean it has to decline in the three months following its next earnings report. That being said, the stock’s median performance following periods when it had big gains leading up to one earnings report is lower than its performance following all other earnings reports. Of the nine prior periods when the stock rallied more than 20% in the three months between earnings reports, JPM’s median performance between its next two earnings reports was a decline of 1.0% with positive returns 44% of the time. For all other periods when the stock was up less than 20% since its last earnings report, the median performance between its next two reports was a gain of 3.4% with positive returns 65% of the time.
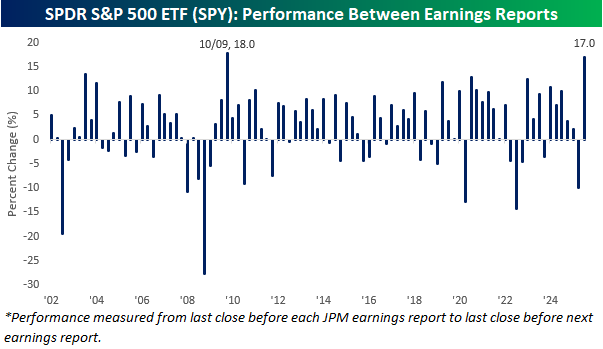
Since JPM typically reports very early on in earnings season, the chart below shows the performance of the SPDR S&P 500 ETF (SPY) between JPM reports since 2002. While the last three months have been the sixth-best period between earnings reports for JPM, in the case of SPY, its 17.0% has been the second-best. The only period between JPM reports that SPY performed better was leading up to its October 2009 report, when it rallied 18.0%. Based solely on the performance of SPY between JPM reports, the bar is higher heading into this current earnings season (with SPY up 17% over the last three months) compared to the 9.9% decline in the three months leading up to last April’s report. That decline was the sixth worst since at least 2002.
The Closer – For Cause, Freight, Positioning – 7/14/25
Log-in here if you’re a member with access to the Closer.
Looking for deeper insight into markets? In tonight’s Closer sent to Bespoke Institutional clients, we kick off with commentary surrounding the prospects of administration officials ousting Fed Chair Powell (page 1) followed by a dive into price action in breakevens (page 2). next, we recap the latest freight activity data from Cass (page 3) before closing with a look at aggregated positioning figures (page 4).
See today’s full post-market Closer and everything else Bespoke publishes by starting a 14-day trial to Bespoke Institutional today!
Chart of the Day: Still Waiting
Bespoke’s Morning Lineup – 7/14/25 – Letters
See what’s driving market performance around the world in today’s Morning Lineup. Bespoke’s Morning Lineup is the best way to start your trading day. Read it now by starting a two-week trial to Bespoke Premium. CLICK HERE to learn more and start your trial.
“Any fool can make something complicated. It takes a genius to make it simple.” – Woody Guthrie
Below is a snippet of commentary from today’s Morning Lineup. Start a two-week trial to Bespoke Premium to view the full report.
The President’s letter-writing campaign to global trading partners continued over the weekend with notifications sent to Mexico and the EU informing them that if no trade deals are reached before August 1st, they will face tariffs of 30% on all products sold into the US. When these types of rates were first announced in April, they nearly pushed the S&P 500 into a bear market. This morning, S&P 500 futures are down just fractionally and within a couple of percentage points of all-time highs. Investors are betting that tariff rates at these levels will never go into effect, and while 30% is the unlikely long-term figure, the lack of concern today is the opposite of the panic three months ago.
Along with the weakness in US futures, European stocks are also trading down fractionally. Germany, the largest exporter in the EU, is leading the way down with a decline of 1%. Overnight, in Asia, most markets were also fractionally lower, so it’s not just US investors who are yawning at the latest batch of letters from the President.
The most action this morning is once again in the crypto pace as Bitcoin continues its march to record highs and traded well over $120K. Ether has also been getting in on the act with a 2% rally this morning and back above $3K.
Besides tariffs, the upcoming week will be an important one on the economic front with the release of June CPI (Tuesday) and PPI (Wednesday). Economists have been waiting (and waiting) for tariffs to push inflation readings higher, but those concerns have yet to manifest themselves in the official numbers.
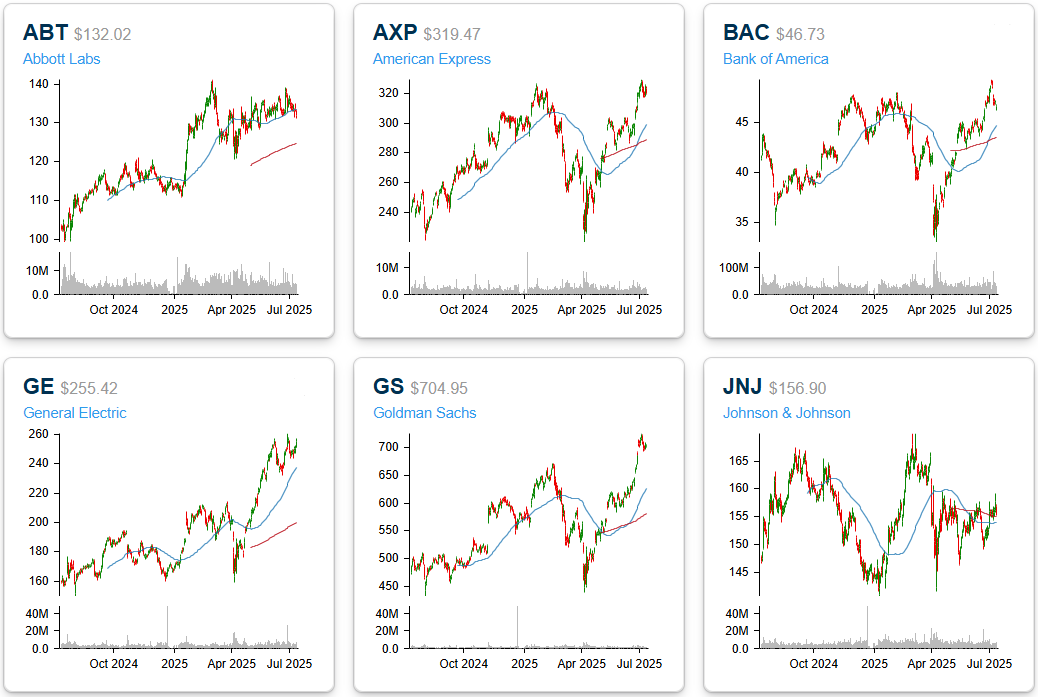
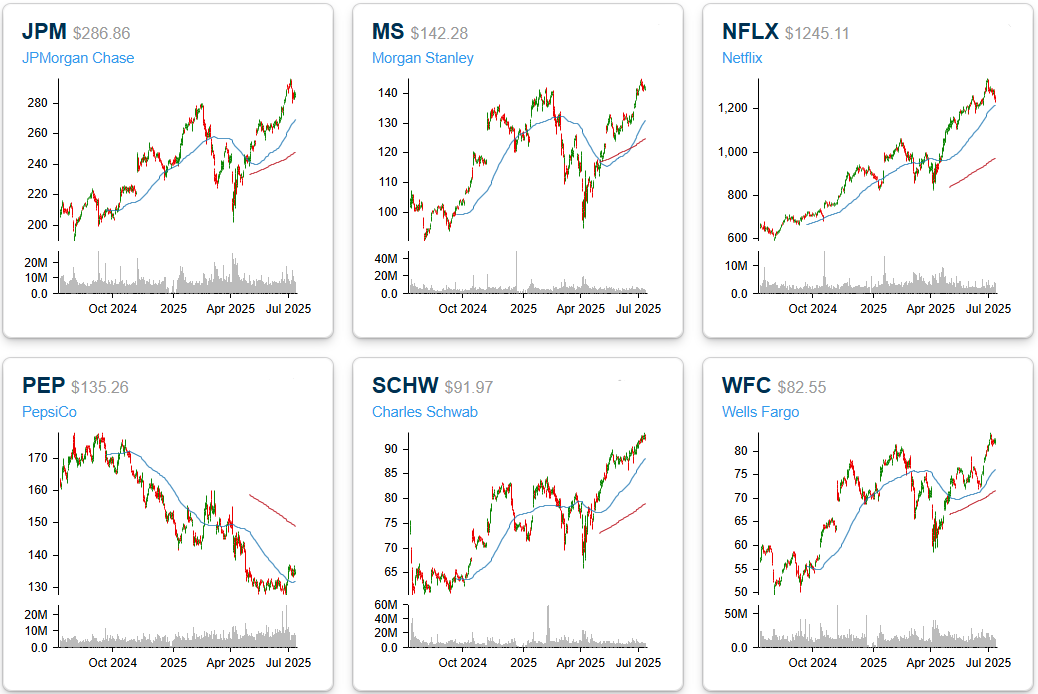
Tariffs are driving headlines this morning, but earnings (which will ultimately at least be partly impacted by tariffs) will start grabbing headlines beginning this week as Q2 earnings season gets underway. The major banks and brokers will be the main area of focus for the week. Still, other notable non-financial sector stocks reporting include Johnson & Johnson (JNJ) on Wednesday, and then Netflix (NFLX), General Electric (GE), Abbot Labs (ABT), and Pepsi (PEP) on Thursday.
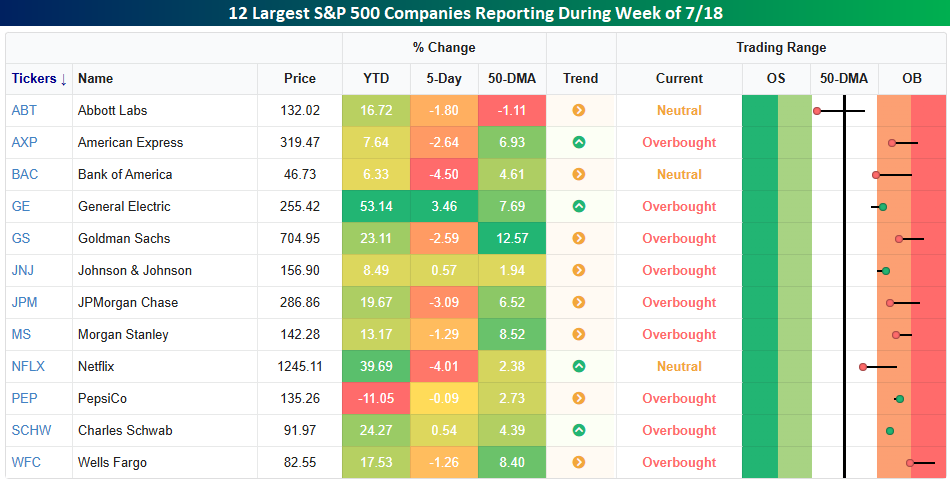
The S&P 500 finished last week down by 0.3%, but of the 12 largest S&P 500 companies scheduled to report, eight of them underperformed the S&P 500 last week, indicating that some investors took profits after the strong runs they had over the last three months. That can be considered a modest positive as it suggests investors aren’t being overly complacent ahead of their respective reports. They have still mostly performed well over the last three months, though. As shown in the snapshot below, nine of the twelve stocks shown finished the week at overbought levels (1+ standard deviation above their 50-DMA), and only ABT is below its 50-DMA.
Below we show one-year charts of each of the twelve largest stocks scheduled to report earnings this week. Except for JNJ and PEP, all twelve are either at or not far from 52-week highs. Goldman Sachs (GS) is one name that has seemingly gone parabolic over the last three months. Despite trading down 2.6% last week, the stock is still up over 40% since its last earnings report in April, which ranks as the three strongest performances between earnings reports for the stock on record.
Brunch Reads – 7/13/25
Welcome to Bespoke Brunch Reads — a linkfest of some of our favorite articles over the past week. The links are mostly market-related, but there are some other interesting subjects covered as well. We hope you enjoy the food for thought as a supplement to the research we provide you during the week.
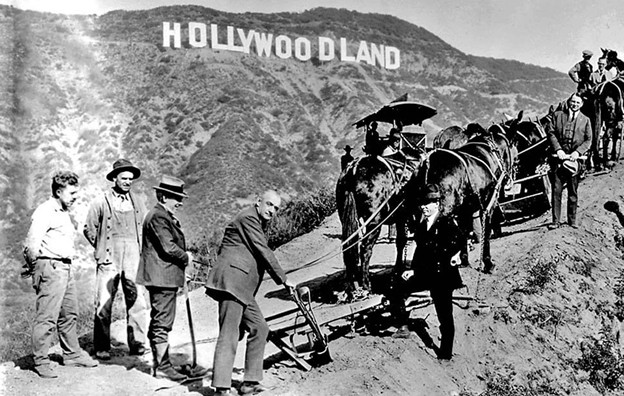
Sign of the Times: The Hollywood Sign was first dedicated on July 13, 1923, not as a tribute to cinema or celebrity, but as an advertisement for a real estate development called “Hollywoodland” in the hills above Los Angeles. The sign’s 45-foot-tall letters were outfitted with thousands of lightbulbs that blinked in sequence, first “Holly”, then “wood”, and finally “land.” The dedication marked the completion and unveiling of the development and its upscale hillside homes. The sign was originally intended to last just 18 months, but here we are 102 years later, and the Hollywood sign is still a hallmark of the LA skyline, which took on new meaning as the city grew into the epicenter of American filmmaking. The sign would eventually lose its “land” and was then rebuilt in 1978 with the help of celebrities and donors. That rededication, unlike the first, was much more ceremonial.
Environmental
Britain and Europe need to get serious about air conditioning (Financial Times)
Europe’s resistance to air conditioning is starting to look outdated as summers grow hotter and deadlier. Cooling isn’t just a comfort issue. It’s a matter of health, productivity, and even survival, especially as heat-related deaths soar in countries with little cooling infrastructure. With solar power booming and modern heat pumps offering low-emission solutions, clinging to anti-AC norms may be doing more harm than good, especially for lower-income households. [Link]
Continue reading our weekly Brunch Reads linkfest by logging in if you’re already a member or signing up for a trial to one of our two membership levels shown below! You can cancel at any time.

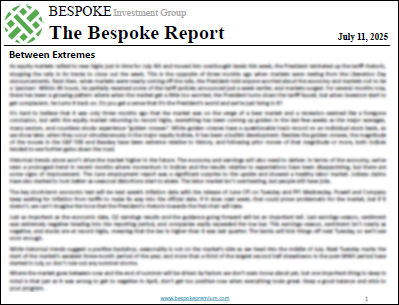
The Bespoke Report – 7/11/25 – Between Extremes
To read our weekly Bespoke Report newsletter and access everything else Bespoke’s research platform offers, start a two-week trial to Bespoke Premium. In this week’s report, we cover everything happening across financial markets as the market digests some tremendous three-month gains..

Market Pricing Of August 1 Tariff Implementation
Looking to keep track of global markets and cross-asset price action? Every morning in The Morning Lineup we provide commentary on developments since the prior US close, covering major macro catalysts, geopolitics, economic data, local market price action, earnings, and more. This morning we talked about the implicit market pricing of odds that the latest round of tariff announcements will be implemented on August 1. An excerpt from this morning’s note is below. The Morning Lineup is included in our Premium subscription tier. Sign up for a complimentary trial now!
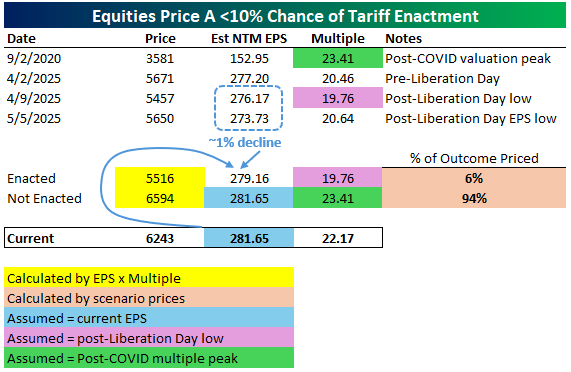
US equity index futures legged lower in the wake of the 35% Canada tariff and 15-20% universal tariff but only by about 75 bps. They then gained back more than half of that selloff before falling again as Europe started trading to hit session lows down 84 bps versus the pre-headline level. Regardless of that small selloff, markets are clearly not pricing much in the way of risk premium that these tariffs actually go into effect. To estimate how much exactly is being priced, we can use S&P 500 EPS estimates, multiples, and prices to create a couple of scenarios and see how those relate to current prices.
We assume two scenarios: one where recent announcements are enacted into law as paid tariffs, and one where they are not. Since the recent wave of announcements is generally in-line with Liberation Day levels (and in some cases like Brazil is significantly worse), we assume that the post-Liberation Day valuation low is the correct multiple for that scenario. We also assume that the forward EPS multiple that number is based on would fall roughly 1% (which is what happened to forward EPS estimates in the wake of the Liberation Day announcement). Taken together, the 19.76x forward multiple and 1% decline in EPS estimates versus current gets to a 5516 level for the S&P 500.
In our second scenario, we assume current forward EPS are valued at the same multiple as the post-COVID valuation peak (23.41x versus 22.17x current). That implies a 6594 S&P 500 price. Given the market currently trades around 6240, we can back out how each scenario is priced in probability terms. As shown below, current market prices imply a 94% chance of no enactment for the current wave of tariffs. Of course, we are making a number of assumptions in this analysis, but we think they’re defensible. The key takeaway here is that the market is pricing very low odds of full enactment for the current wave of tariffs. At the very least, that creates asymmetry to the downside as far as payoff goes. That is one reason we advocated a relatively cheap hedging strategy in The Closer last night (link).