Morning Lineup – Yields Busting Out
Global bond yields have been on the rise all night and all morning continuing the trend that started in US Treasuries yesterday. Equity futures are trading lower in reaction, and semis will be an area to watch again as Deutsche Bank is the latest in the chorus of sell-side firms to cut numbers on the group. Despite the uptick in negative analyst commentary, the Philadelphia Semiconductor index has traded up for five straight days. If the sector can squeeze out a sixth straight day of gains in spite of the negative commentary, that could signal a turn for the group.
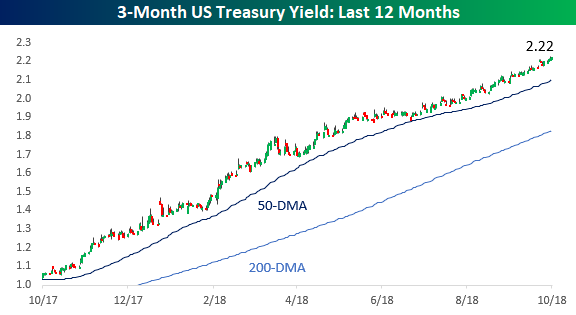
As mentioned above, interest rates are the main focus today. At the short end of the curve, the 3-month Treasury yield continues to move steadily higher hitting a level of 2.22% this morning.
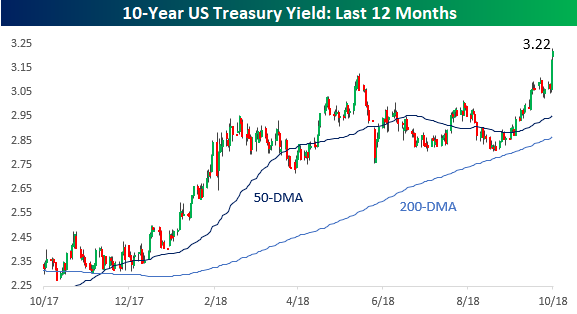
There’s been nothing ‘steady’ about yields at the longer end of the curve, though, as the 10-year yield broke out to 3.22%- its highest yield since 2011!
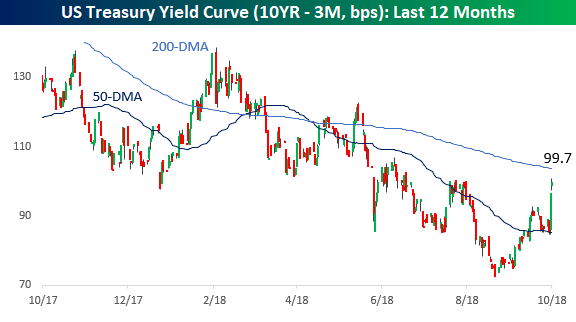
With that breakout in the long end of the curve, the yield curve has spiked from its recent lows in the 70-bps range to just under 100 bps today.
Start a two-week free trial to Bespoke Premium to see today’s full Morning Lineup report. You’ll receive it in your inbox each morning an hour before the open to get your trading day started.

Divergent Start to October
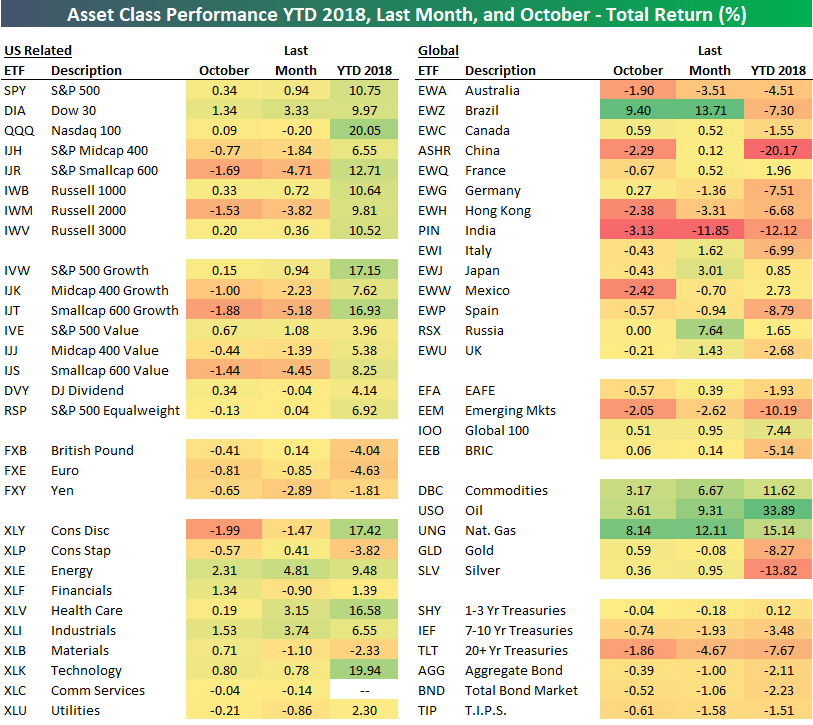
Below is a snapshot of asset class performance to start the month of October. We also include performance over the last month and year-to-date.
The month has gotten off to a pretty strange start, with equity ETFs going in different directions. Small-cap ETFs have gotten hit very hard, while large-caps are in the green. Both consumer sectors are in the red, with Consumer Discretionary (XLY) off by 2% already. On the upside, Energy (XLE), Financials (XLF), and Industrials (XLI) have seen a wave of buying.
Outside of the US, Brazil (EWZ) is already up 9% in October, while India (PIN) is down more than 3%. Prior to September, India had been performing relatively well this year, but an 11.85% drop over the last month has sunk the country’s equity market deep into the red. China (ASHR), Hong Kong (EWH), and Mexico (EWW) are all down more than 2% this month already as well.
Commodities ETFs are on fire, especially energy-related ones. Oil (USO) is up 3.6% month-to-date, while natural gas (UNG) is up 8%. Finally, Treasury ETFs have fallen quite a bit so far in October as interest rates have broken out higher.
The Closer — Bonds Breaking, Hawkish Talk, Brazilian Polls Firming — 10/3/18
Log-in here if you’re a member with access to the Closer.
Looking for deeper insight on markets? In tonight’s Closer sent to Bespoke Institutional clients, we discuss the rip higher in bond yields today. While investors may focus on the outright levels of yields, more impressive was the steepening of the curve as yields moved up. We also review hawkish Fed speakers that helped precipitate the move as well as a discussion of weekly EIA petroleum market data. Finally, we chart the consolidation of Brazilian polling behind two specific candidates ahead of Sunday’s election.

See today’s post-market Closer and everything else Bespoke publishes by starting a 14-day free trial to Bespoke Institutional today!
Bespoke Consumer Pulse Report — September 2018
Bespoke’s Consumer Pulse Report is an analysis of a huge consumer survey that we run each month. Our goal with this survey is to track trends across the economic and financial landscape in the US. Using the results from our proprietary monthly survey, we dissect and analyze all of the data and publish the Consumer Pulse Report, which we sell access to on a subscription basis. Sign up for a 30-day free trial to our Bespoke Consumer Pulse subscription service. With a trial, you’ll get coverage of consumer electronics, social media, streaming media, retail, autos, and much more. The report also has numerous proprietary US economic data points that are extremely timely and useful for investors.
We’ve just released our most recent monthly report to Pulse subscribers, and it’s definitely worth the read if you’re curious about the health of the consumer in year two of Trump’s economy. Start a 30-day free trial for a full breakdown of all of our proprietary Pulse economic indicators.

Chart of the Day — Intel (INTC) and Others Breaking Out Of Downtrends
Bitcoin Lingers
With bitcoin down over 66% from its highs earlier in the year, it may sound pretty unbelievable, but the standard bearer of the crypto-currency space is still up over 50% on a y/y basis. That’s right, back in early October 2017, bitcoin was trading at a price of just $4,283 compared to today’s price of $6,463. Bubbles can take quite a long time to fully deflate!
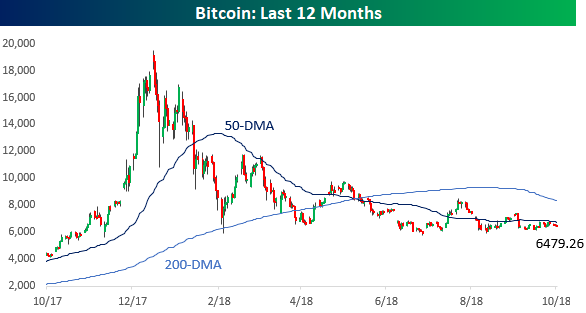
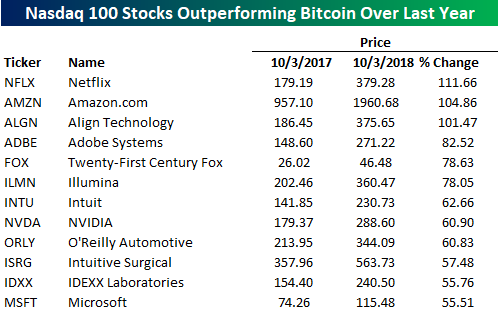
With bitcoin still trading up over 50% from where it was a year ago, it is actually outperforming all but 12 individual stocks in the Nasdaq 100 during that span. Just to show how timing really is everything when it comes to investing, while just 12 Nasdaq 100 stocks are outperforming bitcoin over the last year, on a YTD basis every single one of them has outperformed bitcoin.

Eurozone Real Retail Sales Miss Again
Last night, data was released for Eurozone Real Retail Sales. For the 7th month in a row, the indicator missed economist estimates. This is the second longest streak of misses since 2007 when the indicator missed for 9 straight months ending in December 2007.

Sales reported for August were down -0.2% versus estimates of a gain of 0.2%. The prior month also saw a large downward revision to -0.6% from the original -0.2% number. This is on the back of less than exciting releases—especially on a YoY basis—for Markit Composite and Services PMIs for the Eurozone area that also came out last night.
As you can see in the chart below, historically, Retail Sales have been reliably correlated to Consumer Confidence. But in the past few years we have witnessed the two indicators begin to diverge. The silver lining to this divergence is it helps to explain the misses. Since the two have moved in sync in the past, economists rely on confidence data to predict upcoming sales, and the two moving further apart throws off estimates.

Fixed Income Weekly – 10/3/18
Searching for ways to better understand the fixed income space or looking for actionable ideals in this asset class? Bespoke’s Fixed Income Weekly provides an update on rates and credit every Wednesday. We start off with a fresh piece of analysis driven by what’s in the headlines or driving the market in a given week. We then provide charts of how US Treasury futures and rates are trading, before moving on to a summary of recent fixed income ETF performance, short-term interest rates including money market funds, and a trade idea. We summarize changes and recent developments for a variety of yield curves (UST, bund, Eurodollar, US breakeven inflation and Bespoke’s Global Yield Curve) before finishing with a review of recent UST yield curve changes, spread changes for major credit products and international bonds, and 1 year return profiles for a cross section of the fixed income world.
This week we review the outlook for the ten year yield based on seasonality and positioning.

Our Fixed Income Weekly helps investors stay on top of fixed income markets and gain new perspective on the developments in interest rates. You can sign up for a Bespoke research trial below to see this week’s report and everything else Bespoke publishes free for the next two weeks!
Click here and start a 14-day free trial to Bespoke Institutional to see our newest Fixed Income Weekly now!
Services Sector on Fire
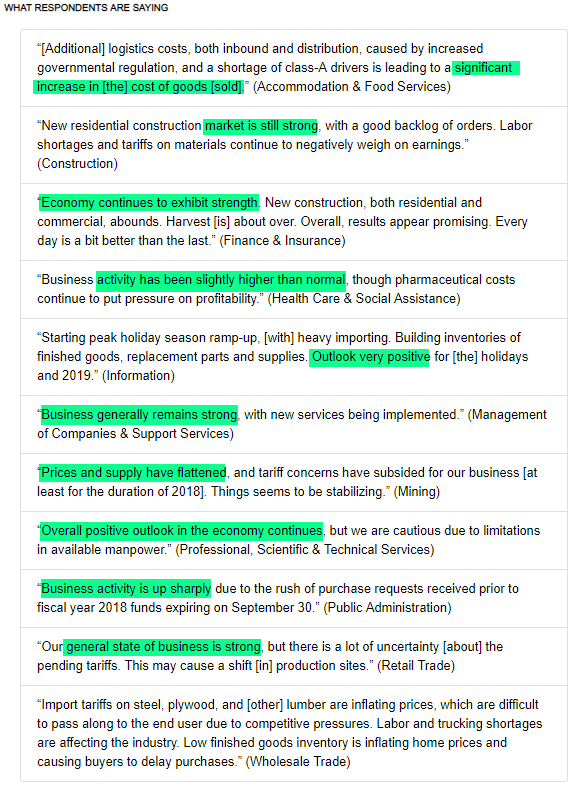
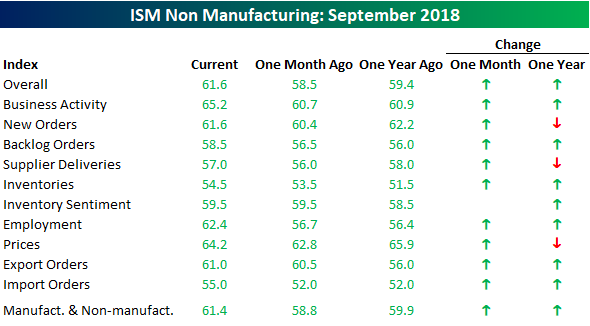
Within the commentary section of the September ISM Non-Manufacturing report today, one of the respondents noted that “Every day is a bit better than the last.” Looking at the details of this month’s report, that person’s comment may actually be an understatement. At the headline level, the September ISM Non-Manufacturing report came in at 61.6 versus estimates of 58.0. That 61.6 reading is the second highest reading in the history of the series dating back to 1997 and the strongest report relative to expectations since last October. As the top chart below also illustrates, the headline index has also surged in the last two months, rising from 55.7 up to 61.6. That 5.9 point increase is the largest two-month increase in the history of the index. The only other times where the headline index has increased more than five points over a two-month period were in January 2009 and last September. A little ‘bit’ better? Looks more like a lot.
Taking today’s reading and combining it with Monday’s ISM report on the manufacturing sector and weighting each sector accordingly, the combined composite ISM for September came in at a record 61.6 versus August’s reading of 58.5.

Looking at the commentary section of this month’s report shows a good deal of positive sentiment. In addition to the over-riding optimism, there was also mention of pricing pressures, worker shortages, and tariffs, although the discussion of tariffs was not nearly as widespread as it was in the Manufacturing report.
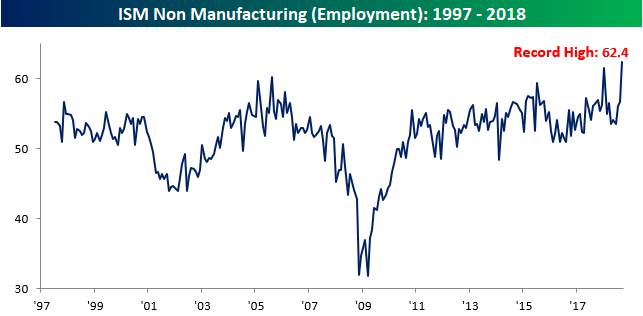
Looking at the internals of this month’s report, the m/m numbers were really strong as not a single sub-index was down versus August. Going all the way back to 1997, there has never been another month where not a single sub-index declined on a m/m basis. The biggest gainers were Employment (chart below), which surged to a record high, and Business Activity, which hit its highest level since January 2004. With the Employment component at record highs and today’s ADP Private Payrolls report coming in handily above forecasts, it’s hard to imagine a weak Non-Farm Payrolls report on Friday. On a y/y basis, trends were also strong with just three components falling y/y.
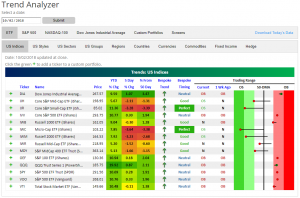
Trend Analyzer – 10/3/18 – More Momentum to the Downside
Other than the Dow, most major indices saw losses on the day yesterday. These downward movements helped to push the small-cap ETFs further into oversold territory. Recently, these ETFs have had far greater momentum downwards as we have been highlighting the divergence between small-cap and large-cap focused ETFs. For example, the Dow (DIA) has remained one of the best performers recently while the Micro-Cap (IWC) has greatly underperformed. Our Trend Analyzer today is showing a continuation of this with 7 overbought, 3 neutral, and 4 oversold. Like yesterday, most of the overbought ETFs are in a similar place to where they were one week ago, mostly sitting only slightly higher. On the other hand, the ones that have moved down have moved big. Core S&P Small-Cap (IJR) and Micro-Cap (IWC) have both gone into extreme oversold territory. Along with the Russell 2000 (IWM), these three ETFs are all down over 3% from mid-week last week.