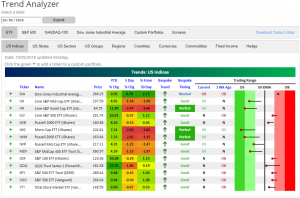
Trend Analyzer – 10/5/18 – Dow Stands Firm
Yesterday’s widespread declines have eliminated gains from the week for all but one of the major US Index ETFs tracked in our Trend Analyzer tool. The Dow (DIA) is the only one to have edged out gains over the past five days, up 0.76%. It is also the only index ETF to hold firm in overbought territory; of the others, there are 6 oversold and 7 neutral. As you can see from the long tails in in the trading ranges, most ETFs have actually seen fairly large movements back towards or further below the 50-DMA. As we have made note of in the past, small-cap ETFs are falling the most. Core S&P Small-Cap (IJR), Micro-Cap (IWC), and the Russell 2000 (IWM) have moved deeply into oversold territory. IWC is down the most at 2.93%.
Morning Lineup – September Jobs Report Weaker Again
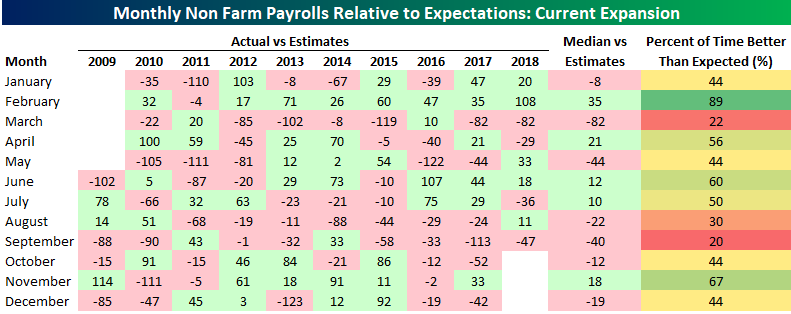
This morning’s release of the September Non-Farm Payrolls (NFP) report came in considerably weaker than expected at a level of 134K vs estimates for a gain of 181K. This weaker reading was especially surprising given the fact that most secondary indicators of employment for the month were positive. In this case, though, it must have all come down to seasonality. As we highlighted in yesterday’s preview report, “Seasonality is one factor not working in favor of a strong report tomorrow. Along with March, no other month has seen a weaker than expected initial release of the NFP more often than September.”
As shown in the table below, with today’s NFP report coming in weaker than expected again, September is now in the lead all by itself in terms of the greatest frequency of weaker than expected reports. In September reports over the last ten years, the initial release has only exceeded forecasts twice.
Start a two-week free trial to Bespoke Premium to see today’s full Morning Lineup report. You’ll receive it in your inbox each morning an hour before the open to get your trading day started.

The Closer — Vol Spike, China Drama, Factory Orders — 10/4/18
Log-in here if you’re a member with access to the Closer.
Looking for deeper insight on markets? In tonight’s Closer sent to Bespoke Institutional clients, we focus on the volatility spike today and cross asset signals from FX and commodities. Financials got a huge lift from the bear-steepening of the yield curve, doing something we haven’t seen since the first day of the current bull market. In economic data today, factory orders continue to come in strong. Finally, discuss the Vice President’s speech on the subject of China today.

See today’s post-market Closer and everything else Bespoke publishes by starting a 14-day free trial to Bespoke Institutional today!
Bespoke’s Sector Snapshot — 10/4/18
We’ve just released our weekly Sector Snapshot report (see a sample here) for Bespoke Premium and Bespoke Institutional members. Please log-in here to view the report if you’re already a member. If you’re not yet a subscriber and would like to see the report, please start a two-week free trial to Bespoke Premium now.
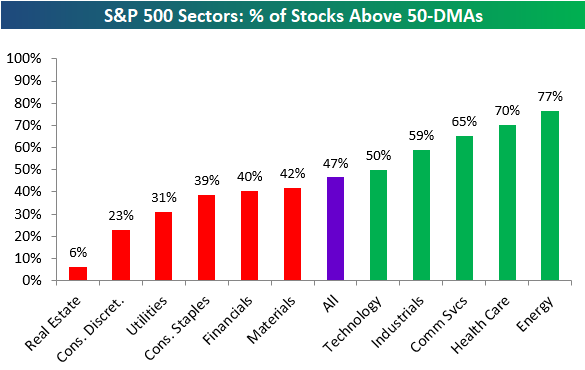
Below is one of the many charts included in this week’s Sector Snapshot, which shows the percentage of stocks in S&P 500 sectors trading above their 50-day moving averages. As shown, just 47% of S&P 500 stocks remain above their 50-day moving averages, which indicates weakening breadth for the market. Consumer Discretionary has really taken it on the chin lately with a reading of just 23%.
To find out what this means and to see our full Sector Snapshot with additional commentary plus six pages of charts that include analysis of valuations, breadth, technicals, and relative strength, start a two-week free trial to our Bespoke Premium package now. Here’s a breakdown of the products you’ll receive.
September Employment Report Preview
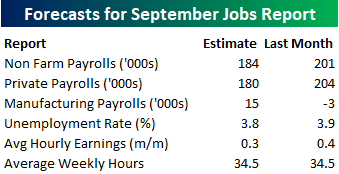
Heading into Friday’s Non Farm Payrolls (NFP) report for September, economists are expecting an increase in payrolls of 184K, which would be a modest decline from August’s stronger than expected reading of 201K. In the private sector, economists are expecting an increase of 180K. The unemployment rate is expected to tick down to 3.8% from last month’s reading of 3.9%. Average hourly earnings are expected to grow at a rate of 0.3% versus the 0.4% reading last month. Given the recent concerns over stronger than expected data, an average hourly earnings number as strong as last month would likely be problematic for the market. Finally, average weekly hours are expected to be unchanged at 34.5.
Ahead of the report, we just published our eleven-page preview of the September jobs report. This report contains a ton of analysis related to how the equity market has historically reacted to the monthly jobs report, as well as how secondary employment-related indicators we track looked in September. We also include a breakdown of how the initial reading for September typically comes in relative to expectations and how that ranks versus other months.
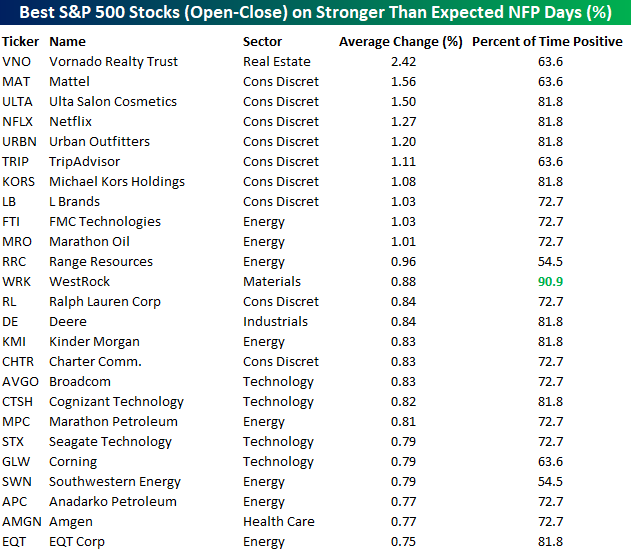
One topic we cover in each month’s report is the S&P 500 stocks that do best and worst from the open to close on the day of the employment report based on whether or not the report comes in stronger or weaker than expected. In other words, which stocks should you buy, and which should you avoid? The table below highlights the best-performing stocks in the S&P 500 from the open to close on days when the Non-Farm Payrolls report has been better than expected over the last two years.
Of the top performing stocks on days when NFP beats expectations, seven sectors are represented, but Consumer Discretionary leads the way with nine. Vornado (VNO) has been the best performing stock with an average open to close gain of 2.42%, but it is followed by seven stocks in the Consumer Discretionary sector which have all gained 1%+ from the open to close. Westrock (WRK) has been the most consistent stock to the upside with open-close gains 91% of the time.
For anyone with more than a passing interest in how equities are impacted by economic data, this September employment report preview is a must-read. To see the report, sign up for a monthly Bespoke Premium membership now!
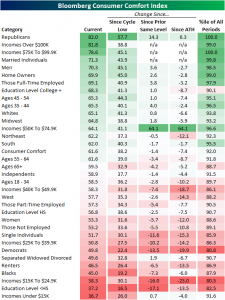
Consumer Comfort Makes Another High
The Bloomberg Consumer Comfort Index has once again made another new high for the current cycle rising to 61.6 from last week’s 61.2. Not only is it an impressive release for the current cycle, but it is also at the highest level since the final days of 2000— one year after the index had hit its all-time highs. This data echoes a jump in bullish sentiment among individual investors that was also released earlier today. Optimism seems to be growing across the board.

Breaking the report down further into demographics, politics has had a strong impact on comfort readings. As you can see in the chart below, the party in power typically boosts comfort among its members and vice versa. Republicans currently top the chart with the highest comfort of all groups. The most recent release actually posted the highest comfort in the history of the survey (since 1990) for Republicans. Meanwhile, Democrats’ comfort is unsurprisingly significantly lower. Despite this, this group’s comfort has actually been climbing for several weeks now to its highest level since June. Drama over Supreme Court justices amid the wider trend of political polarization has not necessarily slowed consumer comfort on either side of the aisle.

Looking at income levels, there is a clear split at $50k. Income earners between $75K to $99.9K are sitting at their all-time high in terms of confidence, while the $100K and over group is not far behind. On the other hand, those making under $50K understandably have a much lower comfort level, but they are not at historically low readings. Incomes between $15K and $24.9K are currently in the lowest percentile of all demographics, while the lowest income demographic of under $15k actually sits in the 91st percentile only 0.7 points from its all-time high.
Some other honorable mentions are the homeowners, who despite weak housing market data claimed comfort in the 99th percentile. Conversely, renters are sitting relatively low on the list. Married individuals are within one point of their all-time high alongside college-educated individuals. There is also a discrepancy between comfort levels among men (70.3) and women (53.3).

First 1% Decline Since June?
The S&P 500 is currently trading down just over 1%, and if these declines hold through the closing bell, it would be the first decline of 1% or more for the index since late June. At 70 trading days, the current streak ranks as the third longest of the bull market behind the 109 trading day streak that ended in March 2017 and the 112 trading day streak that ended earlier this year. Besides those two streaks, the only other streak that was nearly as long was the one that ended in July 2014 at 66 trading days.

While the current streak of days without a 1% decline is long relative to recent history, from a wider lens, there have been a number of streaks that lasted longer. The chart below shows all S&P 500 streaks without a 1% decline in the S&P’s history. In the post-WWII period, there have actually been 24 streaks that lasted longer with the bulk of those coming in the 1950s/1960s. The longest streak ended in November 1963 at 174 trading days. Considering how painful the decline feels today, can you imagine how bad it felt in 1963 when the S&P 500 finally declined more than 1% after going eight months without one?
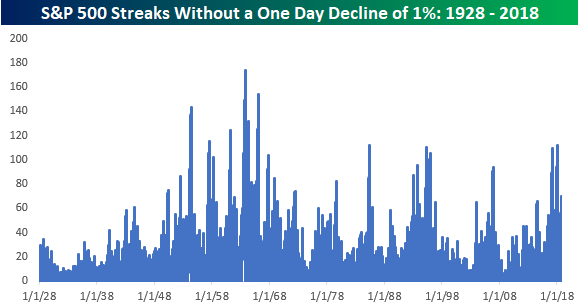
Chart of the Day: Albemarle Acting Awesome
Individual Investor Sentiment – Uh Oh
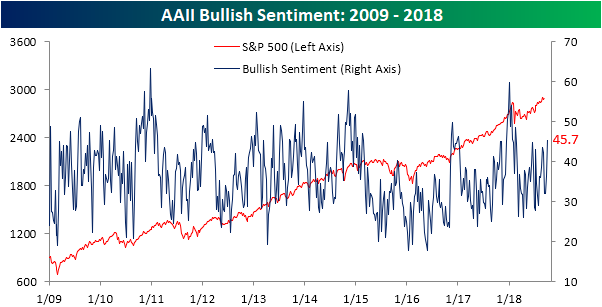
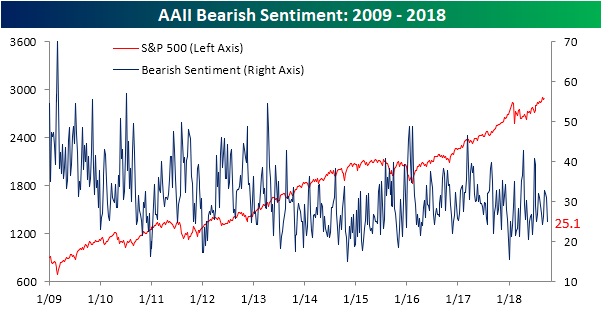
With the Dow suddenly hitting record highs on what seems like a daily basis, you would expect to see individual investor sentiment improve, and that’s exactly what we saw this week. According to the weekly sentiment survey from AAII, bullish sentiment surged 9.4 percentage points to 45.66% from last week’s reading of 36.22%. That move represents the largest one week increase since early July and the highest weekly reading since mid-February. While we’re not quite at the 50% reading yet, we would note that the last time optimism in this survey neared the 50% level was in late December. That wasn’t the exact top of the market right before the correction, but it was close to it.
While bullish sentiment starts to rise, bearish sentiment is back down in the mid-20 percent range, which is a level it has seen repeatedly throughout the year.
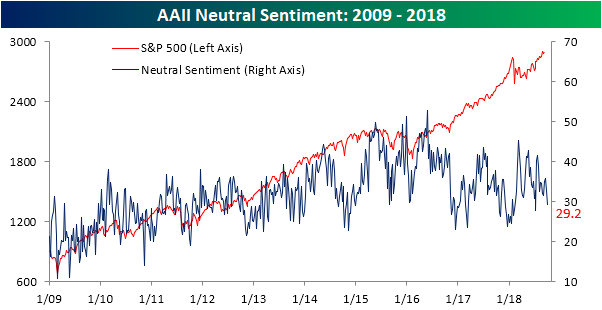
So if all the new bulls didn’t come out of the bearish camp, where did they come from? As shown in the chart below, the pool of undecideds continues to shrink as it fell from just under 33% last week to 29.22% this week. That’s the lowest level since mid-July.
Jobless Claims Move Back Down
After a week where jobless claims ‘surged’ to 215K, this week they resumed their downward trend falling to 207K versus expectations for a reading of 215K. This now makes it a record 187 straight weeks that claims have been at or below 300K, 52 straight weeks that they have been at or below 250K (longest streak since 1970), and 13 straight weeks where they have been at or below 225K (longest streak since 1969).

Despite the decline in claims this week, the four-week moving average moved slightly higher rising from 206.5 up to 207K. Even with the increase, though, claims are now just 1K above their multi-decade low of 206K from two weeks ago.

On a non-seasonally adjusted (NSA) basis, claims ticked down to 165.2K. For the current week of the year, that’s the lowest reading since 1969, and it’s also more than 117K below the average for the current week of the year dating back to 2000.
