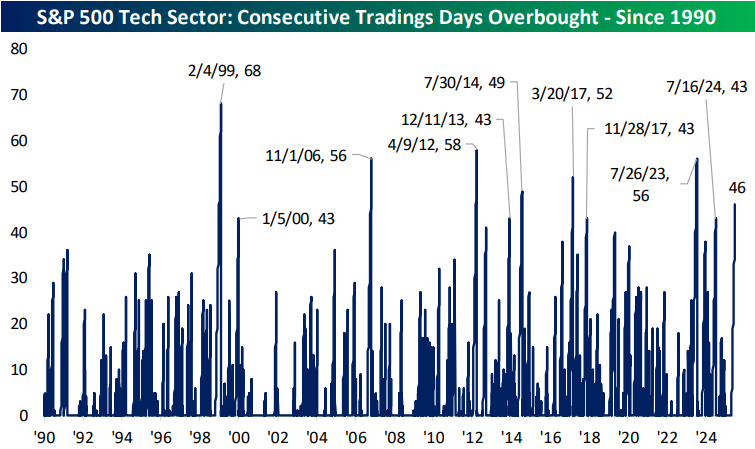
Tech Sector Overbought for 46 Trading Days and Counting
Below is a look at a one-year price chart of the S&P 500 Technology sector. The white line represents the sector’s 50-day moving average, while the light blue shading represents its “normal” trading range, which is a band that’s one standard deviation above and below the 50-DMA. The red shading is one to two standard deviations above the 50-DMA, which we consider “overbought” territory, and anything above the top of the red band is more than two standard deviations above the 50-day. The green shading is the opposite of the red zone: one to two standard deviations below the 50-DMA, which we consider “oversold.”
The Tech sector has now rallied 45% since its low point in early April, leaving it at all-time highs. The sector has also now closed in “overbought” territory for 46 straight trading days (heading into Friday).
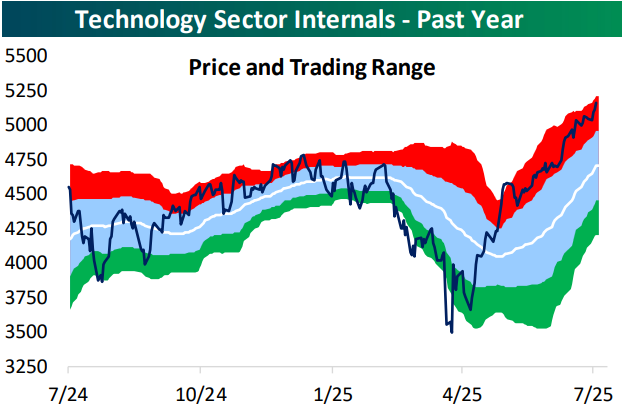
This is the 11th time since 1990 that the Tech sector has closed in overbought territory for at least 40 straight trading days. Yesterday we looked at how the sector has done going forward after prior lengthy overbought streaks in our post-market macro note, The Closer. You can read that report with proper access here.
The longest the Tech sector has remained in overbought territory is the 68-trading day streak that ended in February 1999. At its current level, the sector would need to fall 3.5% for the “overbought” streak to end, so unless we get a big drop early next week, it looks like the current streak will make it to the 50-day mark.

Q2 2025 Earnings Conference Call Recaps: Johnson & Johnson (JNJ)
Bespoke’s Conference Call Recaps use AI to summarize lengthy earnings calls. The commentary below is AI-generated and then edited by Bespoke for quality control. As always, none of these summaries should be construed as recommendations to buy or sell any securities, and investors should do their own research and/or consult with a financial professional before making any investment decisions.
Our latest recap available to Bespoke subscribers covers Johnson & Johnson’s (JNJ) Q2 2025 earnings call.
![]()
Johnson & Johnson is a global healthcare powerhouse operating across innovative medicine and med-tech, uniquely positioned as the only major company with leadership in both sectors. It develops oncology treatments (like DARZALEX for multiple myeloma and RYBREVANT/LAZCLUZE for lung cancer), immunology therapies (such as TREMFYA for psoriasis and IBD), CNS drugs (like SPRAVATO for depression and CAPLYTA for bipolar disorder), and cutting-edge surgical and cardiovascular devices. J&J also integrates device and drug innovation, exemplified by TAR-200, a bladder cancer drug-releasing system, and OTTAVA, its robotic surgery platform. The company serves patients globally, with a deep R&D pipeline and $55B US investment plan shaping the future of medicine. In Q2, J&J reported 4.6% operational sales growth, raising its 2025 guidance by $2B. Despite biosimilar erosion of STELARA, growth surged in oncology driven by CARVYKTI (CAR-T therapy), TECVAYLI and TALVEY (multiple myeloma bispecifics), and TAR-200’s FDA priority review. TREMFYA expanded in Inflammatory Bowel Disease, and SPRAVATO (+53%) and CAPLYTA led neuroscience. MedTech shined with Abiomed (heart pumps), Shockwave IVL (vascular plaque treatment), and VARIPULSE (cardiac ablation). Guidance rose on FX tailwinds, strong pipeline momentum, and MedTech acceleration…
Continue reading our Conference Call Recap for JNJ by becoming a Bespoke Institutional subscriber. You can sign up for Bespoke Institutional now and receive a 14-day trial to read our newest Conference Call Recap. To sign up, choose either the monthly or annual checkout link below:
Q2 2025 Earnings Conference Call Recaps: Prologis (PLD)
Bespoke’s Conference Call Recaps use AI to summarize lengthy earnings calls. The commentary below is AI-generated and then edited by Bespoke for quality control. As always, none of these summaries should be construed as recommendations to buy or sell any securities, and investors should do their own research and/or consult with a financial professional before making any investment decisions.
Our latest recap available to Bespoke subscribers covers Prologis’s (PLD) Q2 2025 earnings call.

Prologis, Inc. is the world’s largest logistics real estate company, owning and operating over a billion square feet of industrial property across key consumption hubs globally. They provide mission-critical infrastructure, like warehouses, distribution centers, and data centers for many of the world’s largest retailers, manufacturers, and third-party logistics providers. With a growing presence in energy and electrification, Prologis is also helping tenants prepare for the demands of automation and EV adoption. The company’s scale and portfolio offer a unique lens into global supply chains, consumer demand, and economic activity. In Q2, Prologis delivered strong results despite macro uncertainty, with record build-to-suit activity and a historically high leasing pipeline of 130M sq. ft. Customer sentiment is shifting from hesitation to long-term planning, especially among large tenants. Vacancy ticked up to 7.4%, but Prologis sees this as a peak, with pricing power expected to return around the 5% level. A $300M expansion with a hyperscaler in Austin underscored surging data center demand. Power procurement rose to 2.2 GW, and solar assets neared 1.1 GW. Management raised Core Funds from Operations (FFO) guidance and emphasized confidence in long-term structural tailwinds like e-commerce, reshoring, and electrification…
Continue reading our Conference Call Recap for PLD by becoming a Bespoke Institutional subscriber. You can sign up for Bespoke Institutional now and receive a 14-day trial to read our newest Conference Call Recap. To sign up, choose either the monthly or annual checkout link below:
Q2 2025 Earnings Conference Call Recaps: Netflix (NFLX)
Bespoke’s Conference Call Recaps use AI to summarize lengthy earnings calls. The commentary below is AI-generated and then edited by Bespoke for quality control. As always, none of these summaries should be construed as recommendations to buy or sell any securities, and investors should do their own research and/or consult with a financial professional before making any investment decisions.
Our latest recap available to Bespoke subscribers covers Netflix’s (NFLX) Q2 2025 earnings call.
![]()
Netflix (NFLX) is the world’s leading subscription streaming service, offering TV series, films, documentaries, games, and even live events to over 260 million paid members in more than 190 countries. The company reported 16% revenue growth in Q2, boosted by favorable FX, stronger-than-expected membership growth, and rising ad revenue. The company continues to expand its ad-supported tier, rolling out its in-house Netflix Ads Suite globally and projecting ad revenue will double in 2025. Engagement held steady despite a back-half-weighted slate, and hits like Squid Game Season 3 and KPop Demon Hunters carried favorable results. Netflix emphasized its live content ambitions, including marquee boxing matches and NFL Christmas games, and showcased AI-powered production improvements and a new UI rollout to improve discovery and personalization. This quarter’s triple play is the company’s first since 2018 after several strong quarters of earnings and revenue beats. Regardless, NFLX shares slid more than 5% in intraday trading on 7/18…
Continue reading our Conference Call Recap for NFLX by becoming a Bespoke Institutional subscriber. You can sign up for Bespoke Institutional now and receive a 14-day trial to read our newest Conference Call Recap. To sign up, choose either the monthly or annual checkout link below:
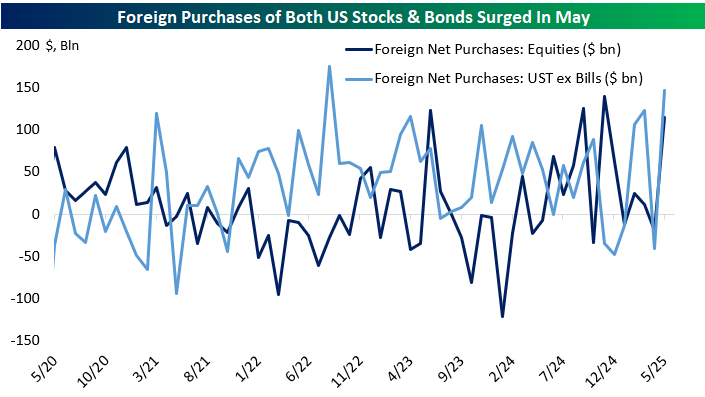
No Sign of Investors Fleeing “US Exceptionalism”
After the close yesterday, the US Treasury reported the largest inflow of foreign capital to that market (net purchases) since 2022, obliterating the narrative that foreign investors are fleeing Treasuries (or US assets generally) due to concerns over political risk or as a response to tariffs. Adding to that news was a large inflow to US stocks, similar in magnitude to the ones we saw last fall. While there was panic about the end of the “US exceptionalism” trade back in April, for now, there’s no sign in the data that foreign investors are fleeing.
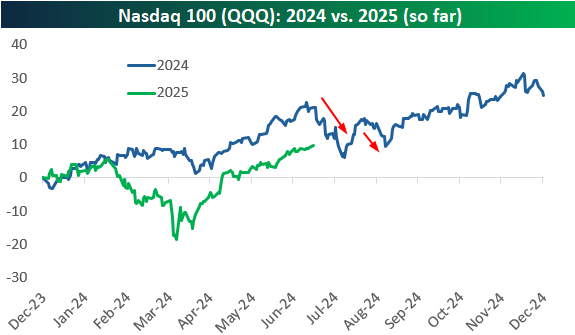
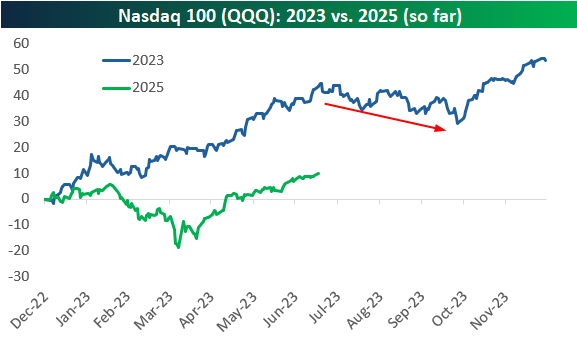
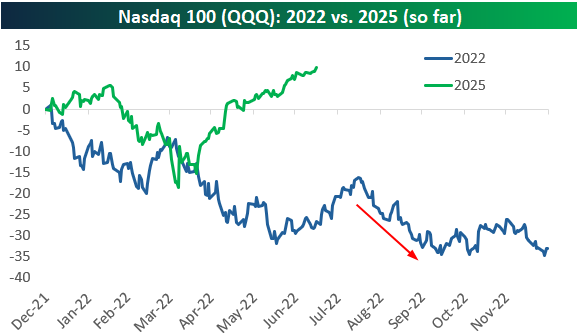
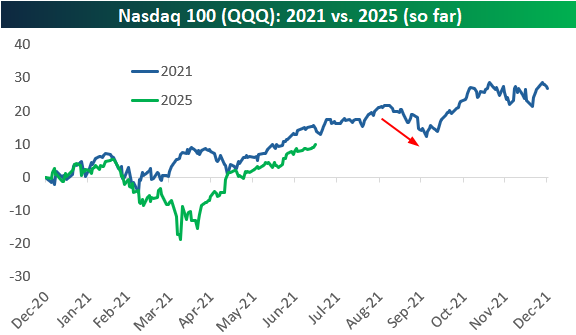
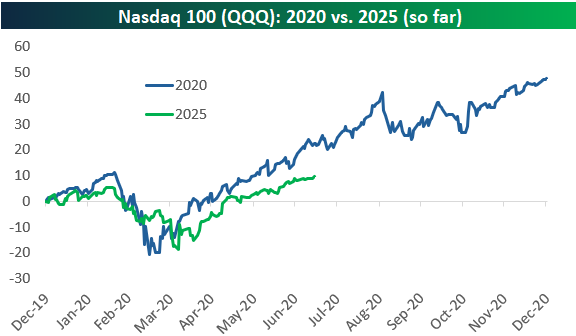
Nasdaq 100 (QQQ): 2025 vs. 2020-2024
The mega-cap Tech-heavy Nasdaq 100 (QQQ) was sitting on a year-to-date gain of 10% through 2025’s first 134 trading days (through 7/17).
In the charts below, we compare QQQ’s action so far in 2025 to every other year so far this decade. Notably, throughout the 2020s, we’ve seen quite a few sell-offs at some point in Q3, with declines beginning in late July in each of the last two years.
At this point in 2024, QQQ was up 21% year-to-date, or more than twice the 10% gain it has this year. But last year, we also saw a nasty drop that began in mid-July just as the Q2 earnings season was getting started and the 2024 Presidential Election started to ramp up. President Biden getting replaced by VP Harris, and the assassination attempt on President Trump increased market volatility, but QQQ eventually resolved higher by the time September rolled around.
In 2023, QQQ was up a huge 43.7% year-to-date as of July 17th as investors clamored for AI stocks after ChatGPT was released in late 2022. QQQ would end up peaking on July 19th, however, and it went on to fall 10% from that point through its low in late October 2023. We then saw a surge in the final two months of the year for a full-year gain of more than 50% for QQQ in 2023.
Things were dark at this point in 2022. ChatGPT still wasn’t a thing in July 2022, and the Nasdaq 100 (QQQ) was down 26.6% year-to-date at the time. The chart of QQQ this year looked somewhat similar to 2022 through April at least, but from there, the similarities end.
At this point in 2021, COVID was still “a thing” for most investors, but we were also in the midst of a crypto and meme-stock boom that would last through the end of 2021. While QQQ didn’t run into trouble in July or August of 2021, it stumbled a bit in September as rising inflation and “bubble-like” action in stocks really came into view.
Finally, we get to 2020. So far at least, 2025 looks most similar to 2020 for QQQ, as the COVID Crash of 2020 and the Tariff Crash of 2025 saw remarkably similar action. If the 2020 pattern continues to track, we’ve got more room to run for a couple more months before some weakness in the fall, followed by a rally during the two-month holiday stretch to end the year.
As always, past performance is not indicative of future results, but we find it fascinating how similar some years look with others, as well as some of the seasonal trends that seem to always show up.
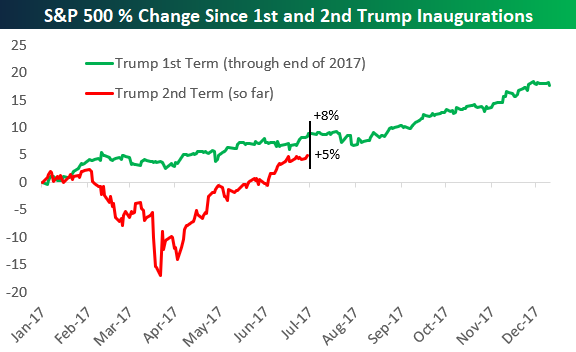
Trump 1.0 vs. 2.0: Back on Track?
Back on April 8th, the S&P 500 was down 16.9% in the 55 trading days since Inauguration Day on January 20th, but as shown below, the index has recovered all of its initial losses and is currently up 5% since President Trump re-took office. What a comeback!
At this point in Trump’s first term back in July 2017, the S&P was sitting on a gain of 8% since Inauguration Day.
Back in 2017, we saw stocks pull back a bit in August but then explode higher from September through December, and the S&P ended up posting a gain of 18% from Inauguration Day 2017 through the end of that year. We’ll have to wait and see what the rest of 2025 has in store, but either way, the market has seen an absolutely remarkable comeback from the depths of the Tariff Crash just a few months ago.
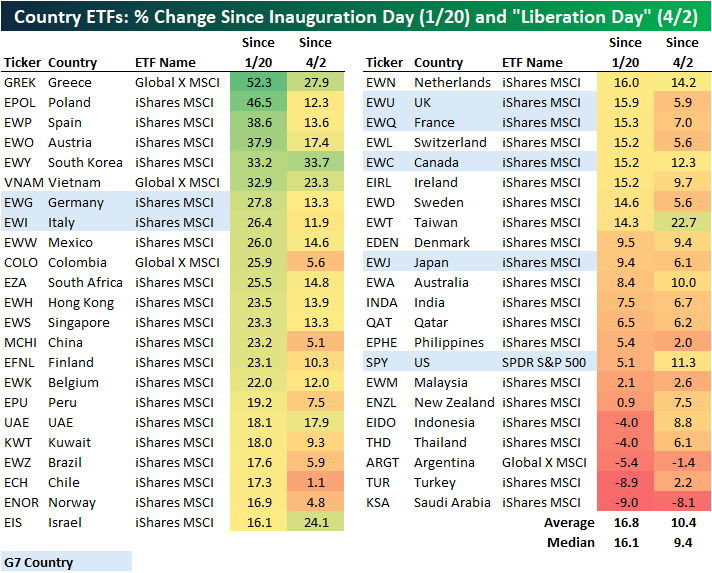
Even with the S&P back to new highs and up 5% since Trump’s 2nd term began, the US is near the bottom of the pack in terms of country by country stock market performance since Inauguration Day. Below is an updated look at the performance of 45 country ETFs traded on US exchanges since Inauguration Day as well as since Trump’s “Liberation Day” tariff announcements in the White House Rose Garden on April 2nd.
The average country ETF is up 16.8% since Trump re-took office, so the US (SPY) is underperforming that average by more than ten percentage points. The US is also still the worst performing of the G7 country ETFs since Inauguration Day, although it’s up the fourth most of the G7 countries since April 2nd.
There are six country ETFs that are up 30%+ since Inauguration Day back in January: Greece (GREK), Poland (EPOL), Spain (EWP), Austria (EWO), South Korea (EWY), and Vietnam (VNAM). On the other end of the spectrum, there are five country ETFs in the red since Inauguration Day: Indonesia (EIDO), Thailand (THD), Argentina (ARGT), Turkey (TUR), and Saudi Arabia (KSA).
Bespoke’s Morning Lineup – 7/18/25 – As Good as You Could Hope For
See what’s driving market performance around the world in today’s Morning Lineup. Bespoke’s Morning Lineup is the best way to start your trading day. Read it now by starting a two-week trial to Bespoke Premium. CLICK HERE to learn more and start your trial.
“Life is a helluva lot more fun if you say yes rather than no” – Richard Branson

Below is a snippet of commentary from today’s Morning Lineup. Start a two-week trial to Bespoke Premium to view the full report.
There’s little action going on in equity futures this morning as the market looks to close out what was an important week in terms of economic and earnings-related data on a positive note. Heading into the final session of the week, the Nasdaq is up 1.5% week to date while the S&P 500 is up a more modest, but still respectable 0.60%.
There are only a handful of earnings reports this morning, but some of the more notable ones were 3M (MMM), American Express (AXP), Charles Schwab (SCHW), and SLB. All four companies managed to top expectations on both the top and bottom line, continuing what has been a positive start to the Q2 earnings season. On the economic calendar, we’ll close the week with Housing Starts and Building Permits at 8:30, followed by Michigan Confidence at 10.
As mentioned, it was a significant week for economic data, particularly in terms of inflation, and the results came in just about as good as anyone could have hoped for. Of the nine different major metrics for the week, the only one that came in higher than expected was headline CPI on a y/y basis.
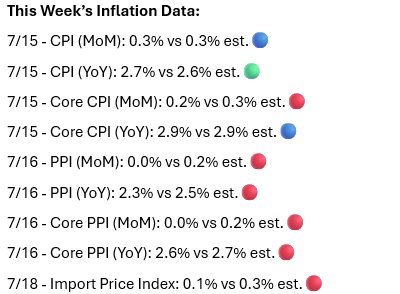
While most of the inflation-related data came in lower than expected, other data for the week were nearly across the board better than expected. Not a single report missed expectations, and the only reports that didn’t top expectations were Business Inventories and Homebuilder Sentiment.
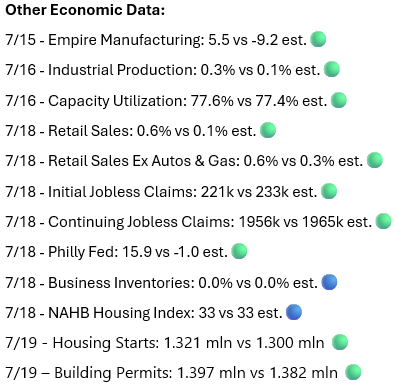
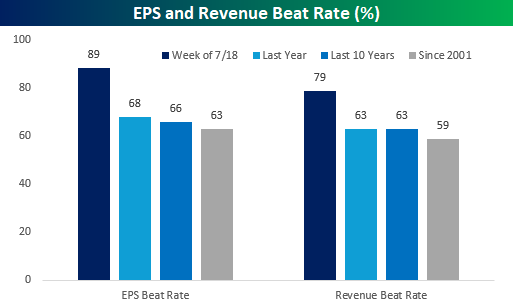
We’re only a week into earnings season, but the reporting period has gotten off to a strong start. 89% of the more than 75 companies that reported earnings this week topped EPS forecasts, and 79% exceeded sales estimates. Relative to the average EPS and sales beat rates over the last one and ten years, as well as going back to 2001, the readings for this earnings season are significantly better than expected.
The Closer – TICS, Tech Burning Up, Tariff Incidence – 7/17/25
Log-in here if you’re a member with access to the Closer.
Looking for deeper insight into markets? In tonight’s Closer sent to Bespoke Institutional clients, we lead off with a look at the surge of inflows of foreign capital (page 1) followed by a look at the rip-roaring rally in the Tech sector (page 2). We then look at retail sales, jobless claims, and regional Fed manufacturing data (page 3). Next, we show evidence of where the burden of tariffs are falling (page 4) before closing out with the weakness in homebuilder and remodeler sentiment (page 5).

See today’s full post-market Closer and everything else Bespoke publishes by starting a 14-day trial to Bespoke Institutional today!
Q2 2025 Earnings Conference Call Recaps: Cintas (CTAS)
Bespoke’s Conference Call Recaps use AI to summarize lengthy earnings calls. The commentary below is AI-generated and then edited by Bespoke for quality control. As always, none of these summaries should be construed as recommendations to buy or sell any securities, and investors should do their own research and/or consult with a financial professional before making any investment decisions.
Our latest recap available to Bespoke subscribers covers Cintas’ (CTAS) Q4 2025 earnings call.
![]()
Cintas (CTAS) offers uniform rental, facility services, first aid and safety products, fire protection, and hygiene solutions to over 1 million businesses across North America. Its core customers range from small businesses to large corporations across sectors like healthcare, education, government, and hospitality. CTAS combines route-based logistics with technology like its Smart Truck platform and SAP-powered supply chain. The company offers a window into service-based B2B demand, labor efficiency, and US business sentiment across a broad economic footprint. CTAS delivered strong Q4 results, with 9% organic revenue growth and 9% EPS growth, driven by standout performance in First Aid & Safety (+18.5%) and Fire Protection (+12.1%). Management noted record-high customer retention and success expanding relationships across verticals. The Smart Truck routing system and auto-sortation helped improve margins, while tariff concerns were framed as a competitive opportunity due to CTAS’s sourcing flexibility. M&A spending was the highest since 2017 due to acquisitions across three route-based segments, Uniform Rental, First Aid & Safety, and Fire Protection. CTAS results topped estimates and the stock rose roughly 3% on 7/17…
Continue reading our Conference Call Recap for CTAS by becoming a Bespoke Institutional subscriber. You can sign up for Bespoke Institutional now and receive a 14-day trial to read our newest Conference Call Recap. To sign up, choose either the monthly or annual checkout link below: