Lots of New Lows
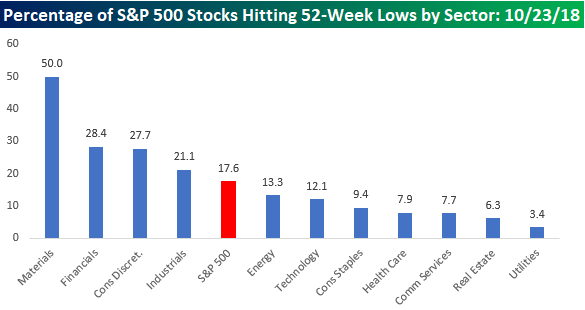
While most didn’t finish near those levels, a lot of stocks in the S&P 500 hit 52-week lows today. For the S&P 500 as a whole, 17.6% of stocks in the index traded down to their lowest levels in at least a year. The last time we saw that many stocks trade at new lows in unison with each other was way back in February 2016. Anyone know if Jamie Dimon is planning to buy some more stock in JPMorgan right about now? The chart below shows the net percentage of stocks in each S&P 500 sector that hit 52-week lows today. Leading the way down the tubes was the Materials sector where half of the stocks in the sector made an appearance on the new low list. The last time the Materials sector saw a larger percentage of new lows was back in August 2015 during the last China devaluation. Behind Materials, Financials, Consumer Discretionary, and Industrials all saw at least 20% of the stocks in their sector hit 52-week lows on Tuesday, and for all three sectors, it was the greatest percentage of new lows for each sector since early 2016.
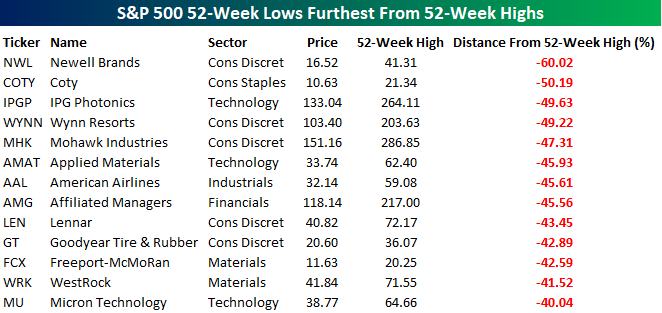
So which stocks hitting new lows are the furthest from their 52-week highs? The table below lists the ‘unlucky 13’ stocks in the S&P 500 that hit 52-week lows today and are also down more than 40% from their 52-week highs. Topping the list, shares of Newell Brands (NWL) are down a 60% from their 52-week high of $41.31. Behind NWL, Coty (COTY) is the only other stock down more than 50%, but among the other elven stocks there are a number of well-known names like Wynn Resorts (WYNN), Applied Materials (AMAT), Lennar (LEN), and Micron (MU) that are all down over 40%. Remember, for a stock that is down 50% to get back to even, it has to double, while a stock like NWL that is down 60% has to rally 150%!
Richmond Fed Manufacturing Falls
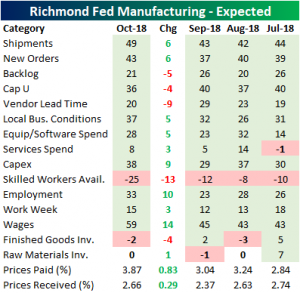
The Richmond Fed released their manufacturing index for October this morning. The report indicated the region’s manufacturing sector is still expanding but at a more modest pace. The composite index badly missed forecasts. A decline to 24 from 29 in September was expected, but the actual reading was far lower to a mere 15. Steep declines in shipments, new orders, and local business conditions were major contributors to this lower reading. While still positive, shipments fell sharply from 33 in September all the way down to 7 for October. New orders were stronger at 20, but still down from 34 last month. This was the second largest decline behind shipments. The overall breadth of this report left much to be desired as employment was the only index that rose. While there were more workers employed, the quality most likely did not match. Skilled workers available fell to its lowest level in the history of the data. The indices for wages and average workweek also both fell. Prices continued to grow with prices paid moving at a much more accelerated pace than prices received. Prices paid grew at its highest rate since May 2011.
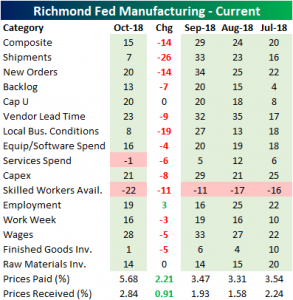
Even with the indices indicating slower conditions this month, businesses remain optimistic looking out six months from now. Most indices saw gains based in the expectations category. The shortage of skilled workers does not seem to have an end on the horizon with that index moving even further past the current all-time low down to -25. While we have yet to see it in any substantial sense, wage growth saw the biggest gains. Even with higher wages, the businesses do not expect prices paid and received to be higher than they came in this month. With the New York Fed and Philly Fed reporting their gauges last week, we now have three of the five indices used as inputs for our Five Fed Manufacturing Composite Index.
Bespoke CNBC Appearance (10/23)
Bespoke co-founder Paul Hickey appeared on CNBC’s Squawk Box earlier today to discuss current market conditions and the scope of the recent sell-off. To watch the segment, click on the image below.

Chart of the Day: Defensive Dominion (D)
Semis Suffer Bad Breakdown
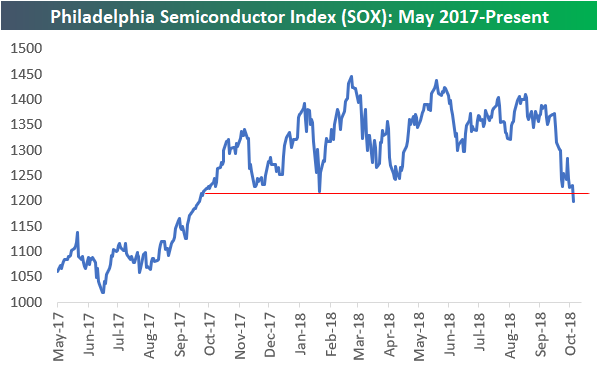
With a decline of 2.2% today, the Philadelphia Semiconductor SOX index has broken below the bottom of its sideways trading range that it has been in for the last 12 months. This is a brutal breakdown of support that’s suggestive (at least based on technical analysis) of a new downtrend forming in the coming months. The semis aren’t quite viewed as the “leaders” they once were back in the 90s, but their breakdown today should still be disconcerting for market bulls.
Morning Lineup – One Way Market
Not a pretty morning for equity markets around the world. Stocks are lower around the globe this morning, and poorly received earnings reports from 3M (MMM) and Caterpillar (CAT) have only made matters worse for US equities heading into the opening bell. CAT is on pace for its worst earnings reaction day in over three years, while MMM is on pace for its worst earnings reaction day since at least 2001. Combined these two stocks are set to account for 175 of the Dow’s 400 point decline.
When it comes to narratives to explain today’s weakness in US equities, before the poorly received reports from MMM and CAT, the negative reversal in China from Monday’s big gain was cited as a catalyst, and we found that a bit puzzling. After all, weren’t US equities down yesterday?
There’s a number of factors behind the weakness in US stocks, but they are all contributing to the same outcome – slower global growth. Just today, the Bloomberg World Index which tracks equities on a global scale, traded to a new 52-week low and is down over 13% from its high earlier this year. At the same time that the rest of the world seems to be slowing, though, the market is concerned with the FOMC, which has actually turned up the hawkish tone in recent weeks and increasingly appears to be on auto-pilot with rates to the upside. Slowing growth and tighter monetary policy is never a good mix.

Start a two-week free trial to Bespoke Premium to see today’s full Morning Lineup report. You’ll receive it in your inbox each morning an hour before the open to get your trading day started.

Trend Analyzer – 10/23/18 – Small and Mid Caps Enter Downtrends
As we highlighted yesterday, five of the members in the US Index group of our Trend Analyzer had recently moved out of their uptrends into a sideways trend while only one had entered into a downtrend. After one more day of declines yesterday, it comes as no surprise that our Trend Analyzer is now showing an increasing number of ETFs in downtrends with Core S&P Mid-cap (IJH), the Russell 2000 (IWM), and Russell Mid-Cap (IWR) all joining the Micro-cap (IWC). Each one in the US Index group is still well below their 50-DMA and oversold; pretty much universally teetering on extremely oversold levels again. Small and Mid-caps are the ones expressing the greatest stress. The weakness among these names has been in place since the second half of September, with most of them falling off a cliff during this rough October. Over the past five days, the ETFs of these sizes all continue to see losses with IJH, IWR, and MDY also still down YTD. While their peers are still positive, it is less so now than in recent months. The Nasdaq (QQQ) has held onto strong gains on the year up 12.28% but is still only up just under 1% over the past five days. The next best performer is the S&P 100 (OEF) with not even half the YTD gains of the Nasdaq at 5.02% and only up 0.6% over the past week.

The Closer — Historical Analysis, Chicago Slows — 10/22/18
Log-in here if you’re a member with access to the Closer.
Looking for deeper insight on markets? In tonight’s Closer sent to Bespoke Institutional clients, we look at historical analyses based on price action in the US equity market, US dollar, and gold. The US equity market has declined from open to close three times in a row over the three sessions, while closing within 50 bps of the 200-DMA. That’s only happened a few times since our data begins in the early 1980s, and we take a look at what it means for returns going forward. Meanwhile the US dollar is at new 52-week highs and gold is acting pretty constructively based on one technical indicator. Finally, we review today’s Chicago Fed National Activity Index release and how bank and broker CDS are trading.

See today’s post-market Closer and everything else Bespoke publishes by starting a 14-day free trial to Bespoke Institutional today!
Bank of the Ozarks (OZK) Leads Regional Banks Down
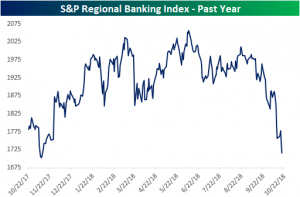
The S&P Regional Banks have gotten battered once again today, down 3.01%. But that is purely a continuation of what has been a rough Fall. The index has fallen 16.58% from its high back in early June and has fallen 7.05% since the start of October. The stocks in the index are down an average of 8.31% MTD. As shown below, the chart for regional banks has completely rolled over.
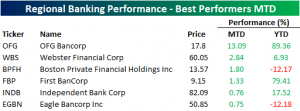
Of all 126 regional banks included in the index, only 6 have managed to see any gains MTD. Two of these, Independent Bank Corp (INDB) and Eagle Bancorp (EGBN), have not even edged out a full percentage point gain. OFG Bancorp (OFG) is an anomaly managing to rise 13.09% on the month (and 89% on the year). But again, these are outliers and not the norm for the industry.
On the other end of the spectrum, the worst performers for October are a much scarier picture. As shown below, some of the worst performers of the index so far this month are down double digits for both this month and this year. Leading the charge downward is one of the country’s most aggressive lenders, Bank OZK (OZK) — formerly known as Bank of the Ozarks. This bank was mentioned Sunday morning in our Brunch Reads in an article out of Bloomberg from Friday. The article highlighted investors moving away from the stock following a horrific earnings report. Earnings dropped 23% versus estimates of a rise of 20%. The reason behind this poor earnings report is the changing interest rate environment. Just three months ago things looked much different.
The names behind OZK are not much better. Opus Bank (OPB) is down just over 25% YTD, and 23.51% MTD. Third worst in the industry is Texas Capital Bancshares which has fallen 20.7% MTD and 27.66% YTD.
We’ll be watching the performance of regional banks closely from here given their extreme weakness recently. The rise in mortgage rates and weakening housing indicators put them at significant risk if things start to get worse.

No Cause for Concern for ECB Rates
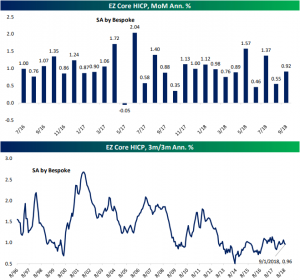
While global conditions have been less than optimal, inflation in the Eurozone should not be a point of concern at the moment, especially in its impact on the regions monetary policy. The four countries in the chart below account for about 80% of the Eurozone, and only one of which (Germany) has a 3m/3m annualized harmonized index of consumer pries (HICP) growth over 1%.
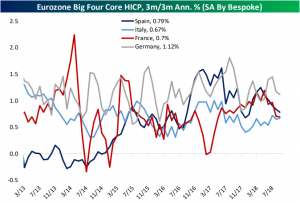
These low inflation rates should ease any worries over near-term rate hikes. The ECB targets an inflation rate of “below but close to” 2%. This means that while the bank may slowly tighten its policy over the next year or two given the state of other aspects of the economy, there will be no rush to do so on account of inflation. For the Eurozone as a whole, the picture is similar to the big four. As shown in the chart below, the broader MoM core HICP has not risen over 1% annualized for 6 of the last 8 months.