Bespoke’s Global Macro Dashboard — 11/13/18
Bespoke’s Global Macro Dashboard is a high-level summary of 22 major economies from around the world. For each country, we provide charts of local equity market prices, relative performance versus global equities, price to earnings ratios, dividend yields, economic growth, unemployment, retail sales and industrial production growth, inflation, money supply, spot FX performance versus the dollar, policy rate, and ten year local government bond yield interest rates. The report is intended as a tool for both reference and idea generation. It’s clients’ first stop for basic background info on how a given economy is performing, and what issues are driving the narrative for that economy. The dashboard helps you get up to speed on and keep track of the basics for the most important economies around the world, informing starting points for further research and risk management. It’s published weekly every Wednesday at the Bespoke Institutional membership level.
You can access our Global Macro Dashboard by starting a 14-day free trial to Bespoke Institutional now!

Small Business Sentiment Drops For Second Straight Month
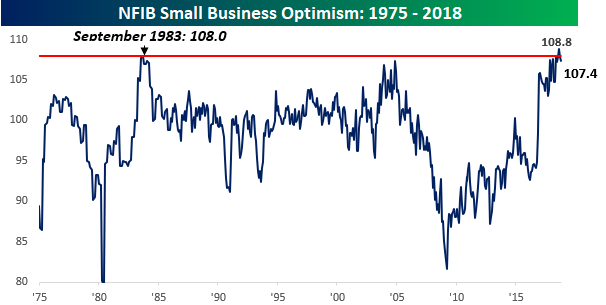
Small Business optimism in the US was weaker than expected in October (107.4 vs 108). After hitting a record high two months ago, the headline index has now declined for two straight months. We would note, however, that outside of 2018, there have only been four monthly prints going all the way back to 1975 where the headline index was higher. According to NFIB, current levels continue to support economic growth in excess of 3%, which is great for businesses and consumers, but not the best news for stock market bulls hoping for a more dovish FOMC. Two of the key stats of the report: 30% of business owners believe now is a good time to expand substantially and 38% of small business owners reported job openings that they couldn’t fill. The job market is definitely tight.
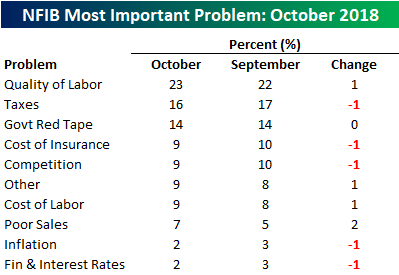
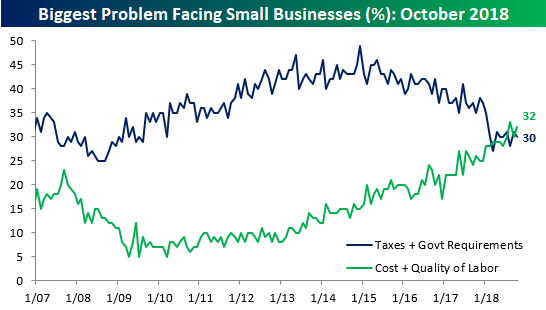
The tight labor market is also reflected in the fact that nearly a quarter of all small business owners report that Labor Quality is their number one problem and another 9% cite labor costs as their biggest problem. On a combined basis, labor issues were cited by just under a third of all small business owners, which is slightly more than the combined impact of Taxes and Red Tape.

Morning Lineup – A Positive Start
It’s a small dent, but US equities are attempting to get back some of Monday’s losses following optimistic news on trade between China and the US as well as positive earnings reports from Home Depot (HD) and Beazer (BZH). Positive openings haven’t been the problem over the last several weeks, though. It is what the market does from the opening to the closing bell that has been the problem! On trade, there’s still absolutely nothing concrete, so it wouldn’t take much to reverse that optimism. Housing-related stocks should get a boost from the HD and BZH news, and if they can’t, that may be an even bigger tell for the market.
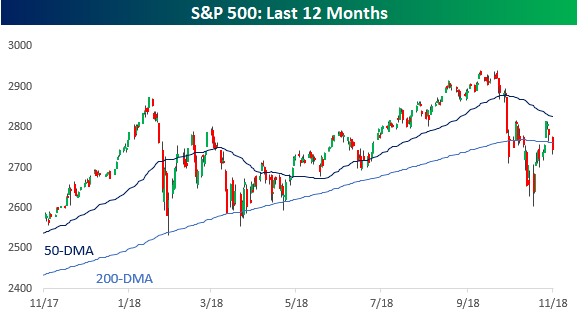
Besides providing a good case for why the stock market should be closed on bond market holidays, yesterday’s equity market decline was disheartening from a technical perspective. Last week, bulls were all excited that the S&P 500 traded back above its 200-DMA after a short time below that level. With yesterday’s decline, the stint above the 200-DMA was even shorter. It’s also never encouraging to see a major index fail to hold onto its already downward sloping 200-DMA. If there’s one thing the bulls can hope for it is that yesterday’s drop is the beginning of a second shoulder in an inverse head-and-shoulders pattern. It is Tuesday, so there’s no better time for a turnaround!

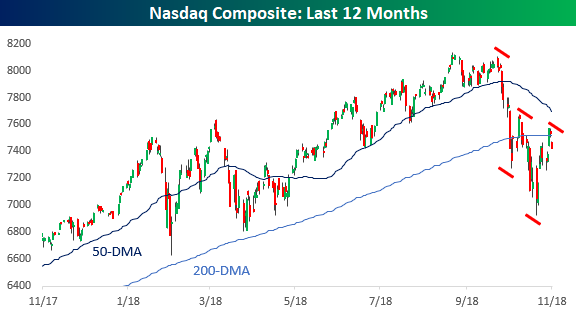
The chart of the Nasdaq isn’t any better, and you could make the case that it looks even worse. Unlike the S&P 500, which rallied back last week to the same levels it hit in mid-October, the Nasdaq actually formed what now looks like a second lower high. Unlike the correction earlier this year, the days of tech offering a port in the storm are done.
Start a two-week free trial to Bespoke Premium to see today’s full Morning Lineup report. You’ll receive it in your inbox each morning an hour before the open to get your trading day started.

The Closer — Bounce Over, Valuation Divergence, Bond Yields Down — 11/12/18
Log-in here if you’re a member with access to the Closer.
Looking for deeper insight on markets? In tonight’s Closer sent to Bespoke Institutional clients, we focus on the US equity market, with a number of decile analyses, valuation discussions, and historical summaries based on the current market. We also take a look at a significant technical development in the long bond.

See today’s post-market Closer and everything else Bespoke publishes by starting a 14-day free trial to Bespoke Institutional today!
What Election Rally?
It’s days like this where the major US equity exchanges should take a page out of the fixed income market playbook and just stay closed on bank holidays. It’s bad enough that stock traders all have to work while their fixed income counterparts enjoy the three-day weekend, but to come into the office for this? Thanks a lot! Looking at the chart of the S&P 500 following today’s decline, it is now back below its downward sloping 200-DMA and has erased more than all of its post-election rally from last Wednesday. Big rallies followed by even bigger more drawn out declines is not something you would normally associate with bull market behavior.
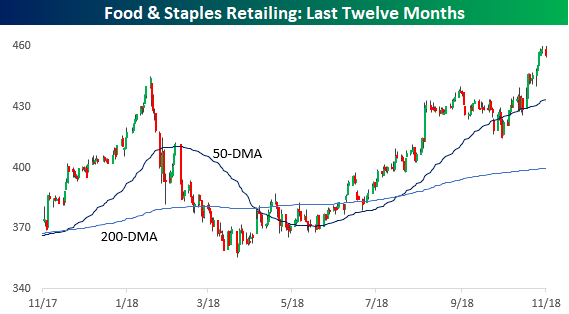
While the moves of the market over the last couple of days are not particularly encouraging, it is interesting to see that of the S&P 500’s 60+ industries, just as many are hitting 52-week highs today as are hitting 52-week lows. On the upside, Food & Staples Retail and Power & Renewable Electricity both hit 52-week highs earlier today. Food & Staples Retail is made up of names like Walmart (WMT), Costco (COST), and CVS, while some of the larger components in the latter group include NRG and AES. While Food & Staples Retail is a relatively large group accounting for about 2% of the S&P 500, Power & Renewable Energy is puny.

On the downside, the two groups hitting 52-week lows today are Energy Equipment & Services, which is made up of names like Schlumberger (SLB), Baker Hughes (BHGE), and Halliburton (HAL), and Industrial Conglomerates. When you think of Industrial Conglomerates, General Electric (GE) is usually the first name that comes to mind, but given its declines over the last two years, it is now actually a smaller percentage of the index than 3M and Honeywell (HON).
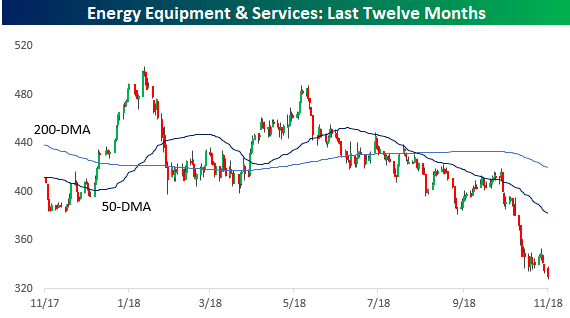
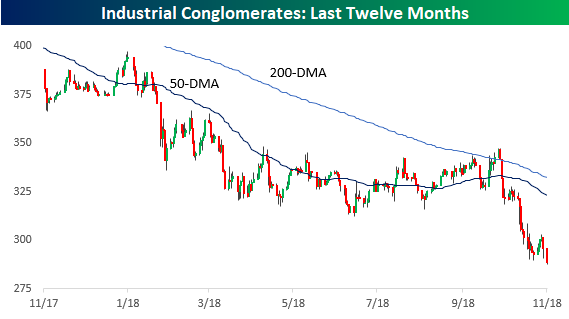
Chart of the Day: Domestics Winning as Dollar Runs
General Electric (GE) Nearing Financial Crisis Lows
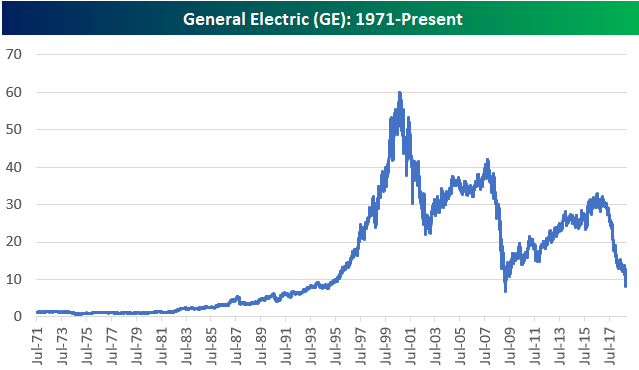
General Electric (GE) is trading down another 5% today as it flirts with a share price below $8. It’s been as painful as it gets for GE and shareholders for the last two years. Since peaking just above $30 in mid-2016, the stock has been straight down. At its current level, the stock is just 55 cents (7%) above the price it closed at on March 9th, 2009 when the S&P 500 made its low of the Financial Crisis. Below is a price chart highlighting the destruction.
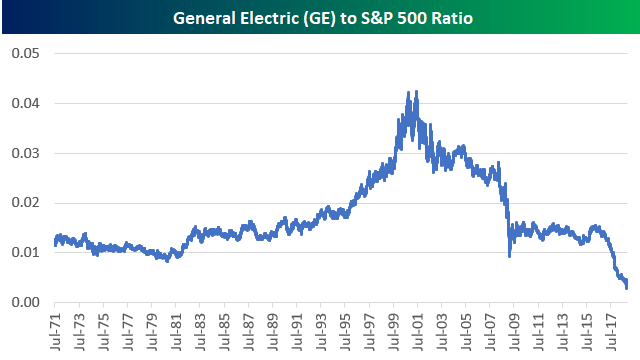
What makes the stock’s recent drop more painful than its drop in the mid-2000s is that this time around the rest of the market has been surging. Below is a relative strength chart of GE compared to the S&P 500. When the line is rising, the stock is outperforming the S&P 500, and vice versa for a falling line. As shown, relative strength for GE versus the broad market has plunged to new multi-decade lows.
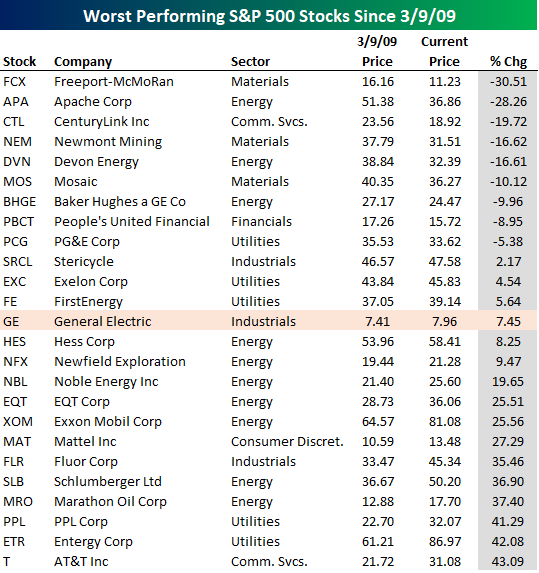
Below is a table showing the worst performing current S&P 500 members since the March 9th, 2009 low for the S&P 500. (This is simple price change and doesn’t include total returns.) As shown, GE is the 13th worst stock with a gain of just 7.45%. There are actually nine current S&P 500 members that are down since 3/9/09, so at least GE is still up!
Once the largest company in the world, there are now concerns regarding GE’s current financial status, and as the stock’s price continues to shrink, it doesn’t provide much of a boost to investor sentiment towards the broader market.
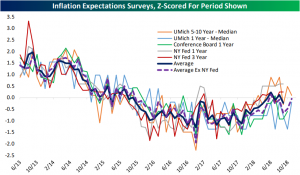
Inflation Expectations Surveys
Below is a chart showing inflation expectations across a number of key economic surveys dating back to 2013. Across the market, there are lots of inflation headwinds for businesses at the moment, but core inflation has likely peaked out for the time being. Consumers are still reporting steadily (albeit modestly) rising inflation expectations. On Friday, the University of Michigan released their preliminary consumer confidence data on inflation expectations. For the period of 5-10 years ahead, median inflation expectations sit at 2.6%, a joint-high dating back to March of 2016. Other gauges of inflation expectations are also gradually picking up, which should give the Fed some confidence even if core inflation takes a breather into the start of next year.
Markets seem to be coalescing around the view that the Fed is set to hike in December, twice more next year, and then pause for an indeterminate period (possibly the rest of the cycle). If you hold the view that the economy is not likely to start rolling towards recession in late 2019 or early 2020, then in our view three more hikes for the cycle isn’t a likely outcome. Of course, it’s important to keep in mind that the Fed is highly dependent on economic data, so shocks (either positive or negative) could roll over in the next year to significantly change that outlook.
This Week’s Economic Indicators – 11/12/18
Last week was a relatively quiet one for economic indicators with only 17 releases. Below is a list of the releases with the actual versus estimated readings. The ISM Non-Manufacturing Index and Markit Service PMI kicked off the week beating estimates but were still lower from the prior month. Thursday’s FOMC rate decision was a snooze-fest with everything coming in as expected. Friday capped off the week with a PPI release way above estimates. This was the only notable surprise of the week and was one factor in market declines on Friday. Rising inflation pressures have been increasingly mentioned in earnings calls this season, and it seems that we are starting to see the effects. Higher inflation is not a good sign for markets and will certainly lead to more hawkish policy.

Moving on to this week, the US economic data slate will be a little bit heavier with 24 releases on the docket. Since today is Veteran’s Day, there are no scheduled releases. The bond market is also closed. Tomorrow will kick off the week with small business optimism from the NFIB. On Wednesday we will see if last week’s higher than expected PPI will be passed along to consumers through the CPI release. Thursday will be the busiest day of the week with Empire Manufacturing, Philly Business Outlook, retail sales, export/import price indices, and claims all releasing. We round out the week with industrial and manufacturing numbers.

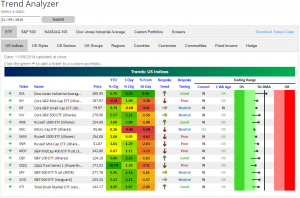
Trend Analyzer – 11/12/18 – Back to Oversold?
The major US Index ETFs that are tracked through our Trend Analyzer tool moved higher within their trading ranges last week. The Dow 30 (DIA) gained enough to push back above its 50-day moving average, but all of the other ETFs highlighted remain below their 50-DMAs. Smallcaps have struggled the most recently and are trading the furthest below their 50-DMAs.