Bespoke Morning Lineup – The Market Giveth and the Market Taketh Away
After a strong start to the last week of November on Monday, it’s looking like we’ll give back half of those gains this morning. The culprit today? Trade. What else is new? There’s a lot of Fedspeak on the calendar, though, so we’ll be watching for any signs of a change in tone.
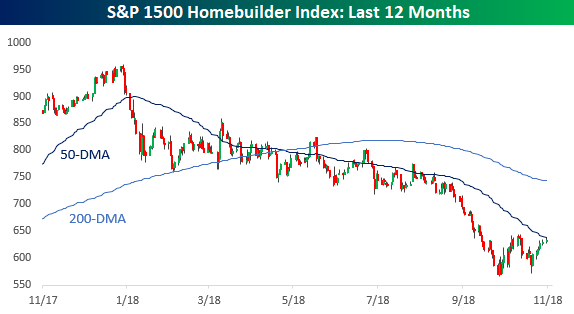
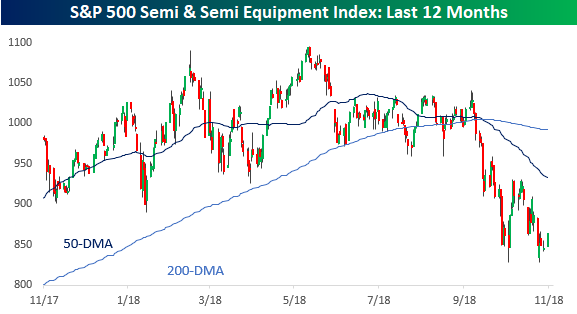
Two sectors of the market we continue to watch religiously are the homebuilders and semis. Both of these groups started to see significant weakness well ahead of the broader market, so if they can stabilize, it stands to reason that it would be a good sign for the market in general. Looking at the two charts below, we have seen some somewhat encouraging signs that the groups are stabilizing, but they are hardly out of the woods yet.
In the case of homebuilders, that group made a successful test of its late October lows in the last week or so, but still hasn’t made a higher high or traded back above its 200-DMA. Until either of those developments unfold, the group could just as easily roll back over.
Semis don’t even look as encouraging as the homebuilders. For now, the group looks to be attempting to establish a double-bottom, but it has yet to show much in the way of a bounce.
Start a two-week free trial to Bespoke Premium to see today’s full Morning Lineup report. You’ll receive it in your inbox each morning an hour before the open to get your trading day started.

The Closer — Volatility Rolling, Dallas Downbeat On Trade — 11/26/18
Log-in here if you’re a member with access to the Closer.
Looking for deeper insight on markets? In tonight’s Closer sent to Bespoke Institutional clients, we take a look at rising volatility in US equities, global trade and industrial production growth, and Five Fed Manufacturing activities.

See today’s post-market Closer and everything else Bespoke publishes by starting a 14-day free trial to Bespoke Institutional today!
S&P 500 Sector Annual Total Returns Since 1990
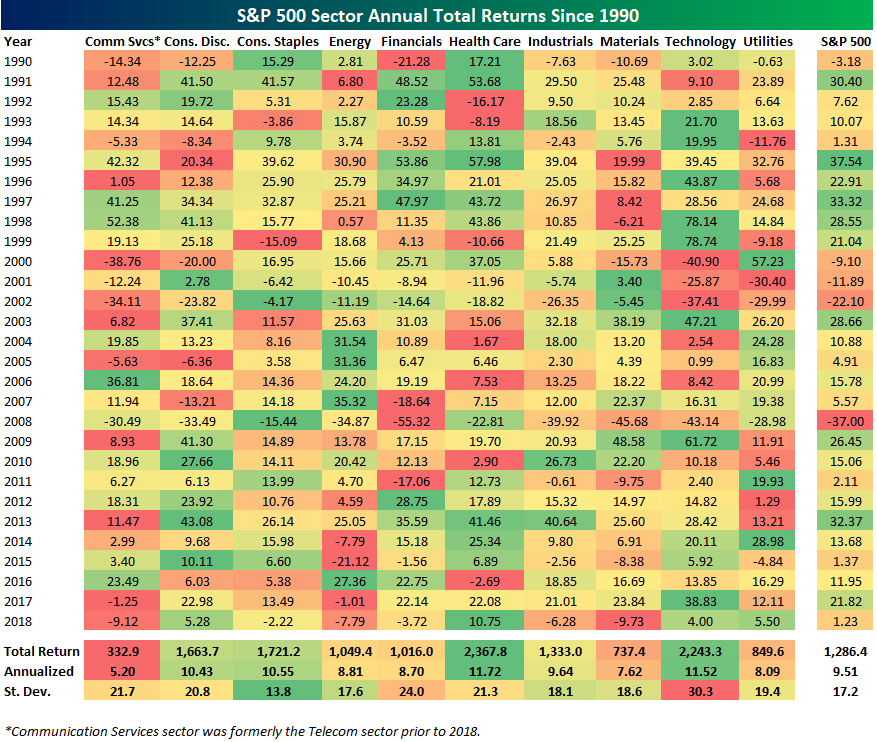
Below is a look at annual total returns for S&P 500 sectors going back to 1990. At the bottom of the table, we also show each sector’s cumulative total return since the start of 1990 and its annualized return over this time period. We also show the standard deviation of annual total returns.
In the table, the red and green shading shows how well each sector performed in that specific year. Sectors highlighted in dark green performed best that year, while sectors highlighted in red performed the worst.
Health Care has performed the best since 1990 with an annualized total return of 11.72%. Technology ranks second at +11.52%, while Consumer Staples ranks third at +10.55%. Notably, Consumer Staples has outperformed Consumer Discretionary since 1990, and with much lower volatility. Staples has by far the smallest standard deviation of annual total returns of any sector. Staples has also beaten the S&P 500’s annualized total return by more than one percentage point over this time period.
Note that the Utilities sector has posted annualized total returns of 8.09% since 1990, which is better than Materials and only slightly below Financials and Energy.
Bitcoin Keeps Crashing
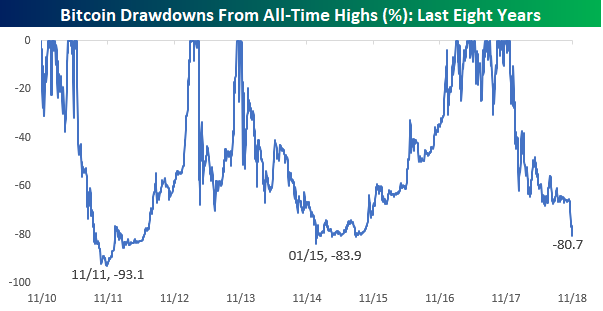
What a difference a year makes! Last year at this time, bitcoin was in the middle of a run where it seemed to break through 1,000-point thresholds every couple of days (and in some cases even faster). Now, the leading crypto-currency is seemingly crashing through 1,000 point thresholds to the downside on what seems like a daily basis. In less than two weeks, the price has dropped below 6,000, 5,000, and now 4,000 today.
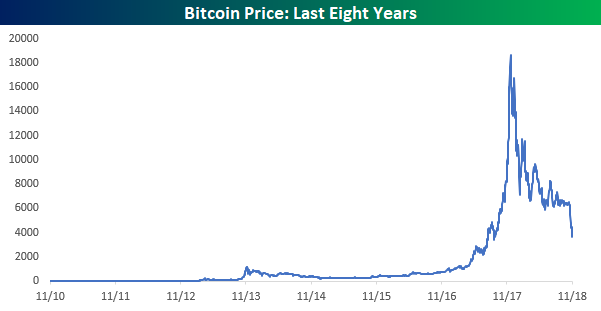
The chart above is certainly ugly, and while the decline from the peak earlier this year is by far the largest in point terms, in percentage terms as well, bitcoin’s decline from the highs is nearing historical proportions. In its eight-plus year history, the current decline is only the third time that bitcoin has fallen more than 80% from an all-time high. The largest decline ended in November 2011 when the price fell 93.1% from its high. Then, in January 2015, bitcoin experienced a drawdown of 83.9% from its high. In order for the current decline to move into second place in terms of magnitude, bitcoin would have to fall below 3,006 (-17%) and to surpass the record decline from November 2011, the price would have to fall another 64% to 1,288 or lower.
If you’re still a bitcoin bull, at least you know that it has actually been here before and eventually bounced back!
Similar to its current percentage decline, bitcoin’s drought without closing at an all-time high is also the third longest on record. At 245 calendar days and counting, the current drawdown is still 597 days shorter than the gap between highs from 2013 through early 2017, and 192 days shorter than the gap from 2011 through early 2013. In terms of getting to the down 80% point, though, at 245 days, the current drop is now second behind the 2011 period which took just 62 days.
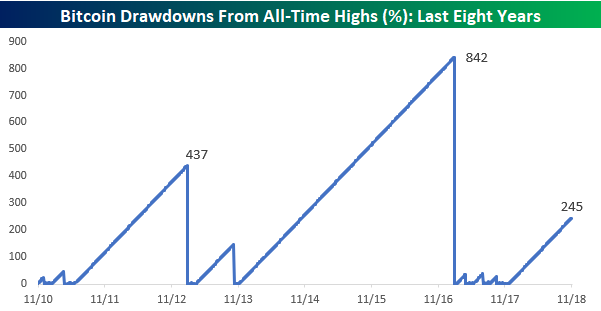
Chart of the Day: US Industry Outperforms
This Week’s Economic Indicators – 11/26/18
Even with the holiday, last week we saw 17 US economic data releases. It was very negative with only 3 of those indicators beating forecasts or their previous readings. The front half of the week was predominately housing data. Homebuilder sentiment badly missed estimates on Monday. Tuesday saw the release of housing starts and permits. Starts came in line with forecasts while permits beat estimates for only the second time since April. Wednesday saw the preliminary M3 report from the US Census which mostly missed estimates but still showed positive activity. Jobless claims missed estimates on Wednesday as well. There were no releases on Thursday due to the Thanksgiving holiday, and Friday was a light day only seeing preliminary Markit PMIs, which came in slightly below estimates.
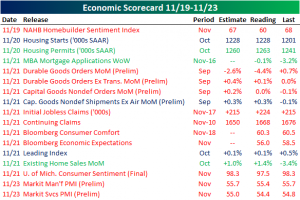
The Chicago Fed National Activity Index kicked off this week stronger than forecasts, but the Dallas Fed fell more than expected. Tomorrow we will get the FHFA and Case-Shiller home prices. Wednesday will be the big day this week with the second Q3 GDP release. Thursday will be an equally busy day with personal income and spending, claims, and the Fed’s favorite inflation gauge the PCE Deflator. Chicago PMI caps off the week as the only indicator releasing on Friday.

Bespoke Morning Lineup – Back to the Grind
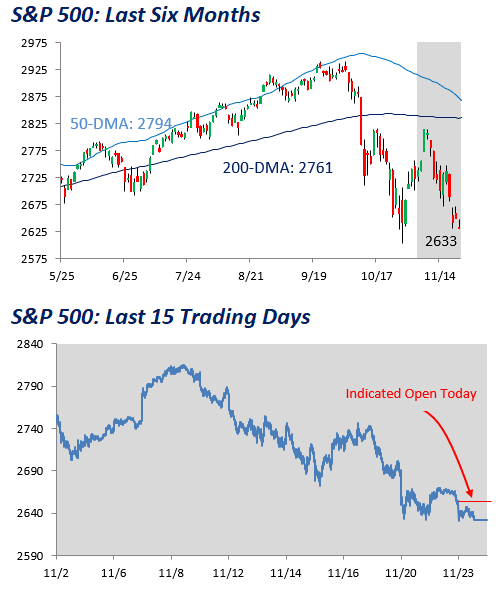
Welcome back from the Thanksgiving holiday weekend. Bulls didn’t have much to be thankful for given the weak performance of equities around the holiday period, but it’s a new week and a new beginning. We’re as happy as anyone that the equity market is looking to kick off the week on a positive note, but just to keep things in perspective, last Friday the S&P 500 did close at a new low for the current correction and even with today’s 1% gain at the open, the S&P 500 will only be back to levels it was trading at a half hour before the close on Wednesday.
Start a two-week free trial to Bespoke Premium to see today’s full Morning Lineup report. You’ll receive it in your inbox each morning an hour before the open to get your trading day started.
Bespoke Brunch Reads: 11/25/18
Welcome to Bespoke Brunch Reads — a linkfest of the favorite things we read over the past week. The links are mostly market related, but there are some other interesting subjects covered as well. We hope you enjoy the food for thought as a supplement to the research we provide you during the week.
While you’re here, try a two-week free trial to Bespoke’s premium stock market research! You’ll be able to read our important “Equity Market Pros and Cons” report that was just published.
Energy Markets
Texas Is About to Create OPEC’s Worst Nightmare by Javier Blas (Bloomberg)
US production continues to surge and a large number of pipelines are opening takeaway capacity in the millions of barrels between West Texas and the Gulf Coast. [Link; soft paywall]
Wiped-Out Hedge Fund Manager Confessed His Losses on YouTube by Marvin G Perez, Isis Almeida, and Naureen S Malik (Bloomberg)
Clients of Optionsellers.com faced losses in excess of the amount they invested with the fund after large naked sales of option tied to natural gas were obliterated (and then some) after a historic rally in the futures market earlier this month. [Link; soft paywall, auto-playing video]
What was the most 😱 family gossip/secret you ever found out during the holidays? by @GeeDee215 (Twitter)
An epic thread of the most incredible and cringe-inducing family stories you’ve ever heard, some of them downright terrifying. [Link]
Labor Markets
Somali Workers in Minnesota Force Amazon to Negotiate by Karen Weise (NYT)
Amazon heavily recruited in the Minnesota Somali immigrant community, but when the company ratcheted up pressure on workers the group started to organize and have successfully forced concessions from the company, a first in the US. [Link; soft paywall]
Financial Frustration
“I Hereby Confess Judgment” by Zachary R. Mider and Zeke Faux (Bloomberg)
The horrifying story of a New York company that exists solely to generate massive judgements against small businesses that in some cases are making timely payments. [Link; soft paywall]
Bitcoin
Bitcoin-Rigging Criminal Probe Focused on Tie to Tether by Matt Robinson and Tom Schoenberg (Bloomberg)
“When the tide goes out, you discover who’s been swimming naked” appears to be an apt description of how things are going for the crypto space as prices plunge. [Link; soft paywall]
Investing
Kelly Criterion by Russell O’Connor (R6)
A helpful post describing the Kelly Criterion, a useful strategy for appropriately sizing investments given an expected payoff rate. [Link]
Natural Disasters
California fire: What started as a tiny brush fire became the state’s deadliest wildfire. Here’s how by Paige St. John, Anna M. Phillips, Joseph Serna, Sonali Kohli, and Laura Newberry (LAT)
A shocking tick-tock recounting the stories of Camp Fire victims as the flames surged down out of the mountains to engulf multiple small towns in California. [Link]
Why 536 was ‘the worst year to be alive’ by Anne Gibbons (Science)
In the mid-6th century, climate shifted and a volcanic eruption blotted out the sun, ruining crops just as a massive plague swept out of the Mongolian planes to crush the European population. [Link]
Read Bespoke’s most actionable market research by starting a two-week free trial today! Get started here.
Have a Happy Thanksgiving!
2018 Week 12
Thanksgiving Day Results: 2-1, Overall 87-60 (59.18%)
Week 11 Results: 8-4
Outside of financial markets, we’re also sports fans here at Bespoke. With new legal sports betting avenues now available across the US, we figured we’d have some fun and pick each NFL game versus the spread this season (as of Saturday evening).
After going 8-4 in week 11, we went 2-1 with our Thanksgiving Day picks, bringing our overall record up to 87-60 versus the spread this season.
On to the week 12 slate of Sunday and Monday Night games:
2018 NFL Week 12 Bespoke Picks:
Jacksonville (-3) at Buffalo: Jacksonville -3
Oakland at Baltimore (-10.5): Oakland +10.5
San Francisco at Tampa Bay (-2.5): Tampa Bay -2.5
NY Giants at Philadelphia (-5): Philadelphia -5
Cleveland at Cincinnati (-1): Cincinnati -1
New England (-10) at NY Jets: New England -10
Seattle at Carolina (-3): Seattle +3
Miami at Indianapolis (-8): Indianapolis -8
Arizona at LA Chargers (-13.5): Arizona +13.5
Pittsburgh (-3) at Denver: Denver +3
Green Bay at Minnesota (-3): Green Bay +3
Tennessee at Houston (-4): Tennessee +4
2018 NFL Thanksgiving Day Results:
Chicago (-3) at Detroit: Chicago -3 (Win)
Washington at Dallas (-7): Dallas -7 (Win)
Atlanta at New Orleans (-12.5): Atlanta +12.5 (Loss)
2018 NFL Week 11 Bespoke Results:
Carolina (-4.5) at Detroit: Detroit +4.5 (Win)
Dallas at Atlanta (-3): Dallas +3 (Win)
Cincinnati at Baltimore (-5.5): Cincinnati +5.5 (Win)
Minnesota at Chicago (-2.5): Minnesota +2.5 (Loss)
Philadelphia at New Orleans (-7.5): Philadelphia +7.5 (Loss)
Tennessee at Indianapolis (-1.5): Indianapolis -1.5 (Win)
Houston (-3) at Washington: Washington +3 (Win)
Tampa Bay at NY Giants (-2.5): NY Giants -2.5 (Win)
Denver at LA Chargers (-7): LA Chargers -7 (Loss)
Oakland at Arizona (-5.5): Oakland +5.5 (Win)
Pittsburgh (-5.5) at Jacksonville: Pittsburgh -5.5 (Loss)
Kansas City at LA Rams (-3.5): Kansas City +3.5 (Win)
Apple (AAPL) Farthest Below 50-Day Moving Average in 10 Years
Yesterday we noted that Apple (AAPL) is currently in the midst of its 4th 20%+ drawdown in the iPhone era. Below we highlight Apple’s (AAPL) price relative to its 50-day moving average (DMA). As shown in the first chart below, AAPL’s share price has plunged well below its 50-DMA on this recent move lower.
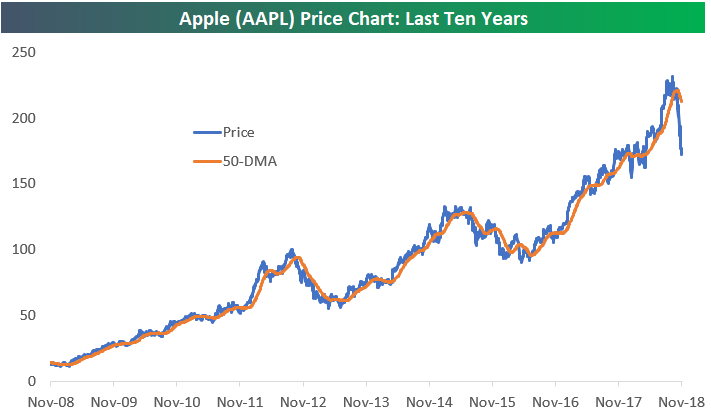
Just how far is Apple (AAPL) below its 50-day moving average? At -19.02%, this is the farthest AAPL has been below its 50-DMA in 10 years dating back to the Financial Crisis. AAPL hasn’t been this far below its 50-DMA throughout the entire bull market for equities that began on March 9th, 2009. Talk about brutal action lately!
