Principals of Preferreds
Below is an excerpt from today’s Fixed Income Weekly, which is sent out each Wednesday to recap and analyze developments in fixed income markets both in the US and around the world. Sign up for Bespoke Institutional with our Annual Outlook special to read it today and beyond.
From a price return perspective, preferred share ETFs have been in a world of hurt. Major preferred share ETFs like VRP (Invesco Variable Rate Preferred ETF), PFF (iShares US Preferred Stock ETF), PGX (Invesco Preferred ETF), and PGF (Invesco Financial Preferred ETF) are at or near 52-week lows. Worse, price has gone nowhere since 2014, with prices down almost 6% since the inception of VRP back in May of 2014. That’s pretty brutal.
Fortunately for fixed income investors with preferred exposure, price is not the driver of returns for the product. As shown in the chart below, despite the horrible price returns, total returns on average across all four ETFs listed above are a solid 21% since 2014. Interest returns are significantly higher at more than 26%. Moreover, while day-to-day volatility is almost entirely a function of the price return, interest return is the overwhelming driver of aggregate total returns. As with other fixed income ETFs, failing to account for interest accruals in the form of dividends is a critical mistake that can lead to missed opportunities.
Another Miss in New Home Sales
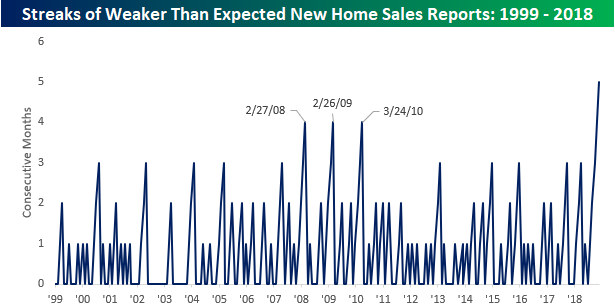
This is becoming a trend. New Home Sales for the month of October were released earlier today and once again missed expectations. While economists were expecting the headline reading to come in at 575K, the actual reading came in 31K below that consensus forecast at 544K. The last time we’ve seen a monthly print in New Home Sales this low was back in March 2016. Not only is this month’s report notable for the fact that sales printed at a 2.5 year low, but it also marked the fifth straight month where sales missed expectations. Usually after a couple of months of weaker than expected reports, economists adjust their forecasts to account for the weakness, but in this case, they haven’t been able to catch up. Using our Economic Indicator Database, we looked to see how the current streak of weaker than expected New Home Sales reports stacks up over time, and what we found was pretty amazing. Going all the way back to 1999, there has never been a streak where New Home Sales missed expectations for five straight months. During the housing crisis and in the early stages of the recovery, there were three streaks where New Home Sales missed expectations four months in a row but never for five straight months.
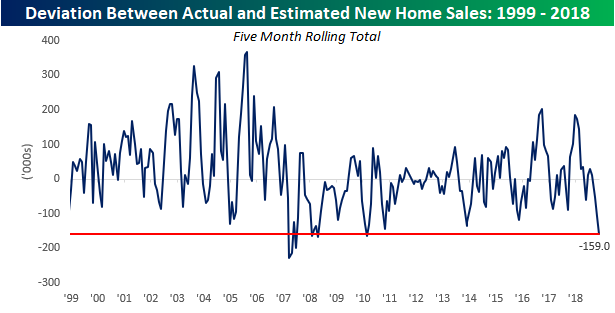
Not only have economists consistently overestimated New Home Sales, but they have also been way off the mark. The chart below shows the rolling five-month spread between the actual initially reported print for New Home Sales versus consensus expectations. With misses of -31K, -72K, -1K, -18K, and -37K in the last five months, the total deviation between actual and estimated New Home Sales has been -159K. Looking back over time, there haven’t been a whole lot of periods where the spread was this wide indicating just how weak recent housing activity has been relative to expectations.
Fixed Income Weekly – 11/28/18
Searching for ways to better understand the fixed income space or looking for actionable ideals in this asset class? Bespoke’s Fixed Income Weekly provides an update on rates and credit every Wednesday. We start off with a fresh piece of analysis driven by what’s in the headlines or driving the market in a given week. We then provide charts of how US Treasury futures and rates are trading, before moving on to a summary of recent fixed income ETF performance, short-term interest rates including money market funds, and a trade idea. We summarize changes and recent developments for a variety of yield curves (UST, bund, Eurodollar, US breakeven inflation and Bespoke’s Global Yield Curve) before finishing with a review of recent UST yield curve changes, spread changes for major credit products and international bonds, and 1 year return profiles for a cross section of the fixed income world.
This week we look at the relationship between credit markets and equity prices.

Our Fixed Income Weekly helps investors stay on top of fixed income markets and gain new perspective on the developments in interest rates. You can sign up for a Bespoke research trial below to see this week’s report and everything else Bespoke publishes free for the next two weeks!
Click here and start a 14-day free trial to Bespoke Institutional to see our newest Fixed Income Weekly now!
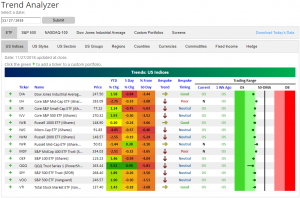
Trend Analyzer – 11/28/18 – Still Not Recovered
The major indices have managed to edge out gains so far this week but the index ETFs in our Trend Analyzer for the most part still have some room to go before they have recovered from last week’s losses. Currently, every major US Index ETF is within 1% of their levels from 5 days ago. Only two of these—the Russell Mid-Cap (IWR) and Nasdaq (QQQ)—are positive. Eleven of these names are oversold while the remaining three are neutral. The oversold ETFs are teetering on neutral, so a little more upward movement would likely shift them to neutral. Unfortunately, longer-term trends remain negative with ten of the names in this group sitting in downtrends.
Bespoke’s Global Macro Dashboard — 11/28/18
Bespoke’s Global Macro Dashboard is a high-level summary of 22 major economies from around the world. For each country, we provide charts of local equity market prices, relative performance versus global equities, price to earnings ratios, dividend yields, economic growth, unemployment, retail sales and industrial production growth, inflation, money supply, spot FX performance versus the dollar, policy rate, and ten year local government bond yield interest rates. The report is intended as a tool for both reference and idea generation. It’s clients’ first stop for basic background info on how a given economy is performing, and what issues are driving the narrative for that economy. The dashboard helps you get up to speed on and keep track of the basics for the most important economies around the world, informing starting points for further research and risk management. It’s published weekly every Wednesday at the Bespoke Institutional membership level.
You can access our Global Macro Dashboard by starting a 14-day free trial to Bespoke Institutional now!

Bespoke Morning Lineup – Three in a Row?
Don’t look now but the S&P 500 is currently on pace for its third straight day of gains, and with the MTD decline now at just over 1%, there’s actually a possibility of a green November! Before getting too far ahead of ourselves, however, Fed Chair Powell is set to speak right at noon today, and the tone of his speech could play a big role in how the afternoon goes. Read today’s Bespoke Morning Lineup below for major macro and stock-specific news events, updated market internals, and detailed analysis and commentary:
Bespoke Morning Lineup – 11/28/18
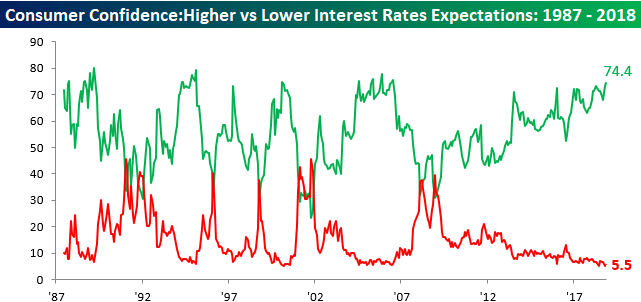
There doesn’t seem to be a more consensus trade these days than that interest rates are going to rise. A prime example is yesterday’s Consumer Confidence report for the month of November. In reference to a question regarding the direction of interest rates, 74.4% of those surveyed expect interest rates to rise (highest since July 2006), while just 5.5% expect rates to decline. At a spread of 68.9 percentage points, you don’t often see sentiment skewed so far to one side. While it’s not always the case, often when you see such lopsided levels of sentiment, things have a way of going the other direction.
Start a two-week free trial to Bespoke Premium to see today’s full Morning Lineup report. You’ll receive it in your inbox each morning an hour before the open to get your trading day started.

The Closer — Home Prices Slow, Energy & EMFX — 11/27/18
Log-in here if you’re a member with access to the Closer.
Looking for deeper insight on markets? In tonight’s Closer sent to Bespoke Institutional clients, we take a look at real short-term yields, bank stocks versus the yield curve, drivers of the rally in US equities that has set in this week, the latest data on US home prices, and how energy prices relate to EMFX performance.

See today’s post-market Closer and everything else Bespoke publishes by starting a 14-day free trial to Bespoke Institutional today!
Chart of the Day – Less Signs of Complacency From Consumers Towards Equities
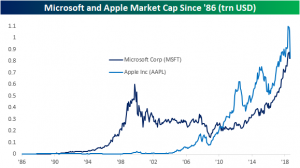
Microsoft Closes In on Apple As World’s Largest Company
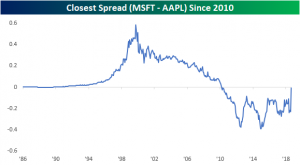
Below is a chart comparing the market caps of Apple (AAPL) and Microsoft (MSFT) going back to 1986. While Microsoft (MSFT) dominated Apple (AAPL) during the 80s and 90s, Steve Jobs finally one-upped Bill Gates with the release of the iPod and then the iPhone in the mid-2000s.
After peaking in market cap at the highs of the Dot Com bubble in 2000, MSFT began a slow drift lower in size before finally putting in a bottom at the lows of the Financial Crisis. At the same time, Apple saw its market cap skyrocket higher and higher as the iPhone took over the world. While MSFT began to see a pick-up in market cap again in the early 2010s, it couldn’t keep up with Apple.
Over the last few years, however, Microsoft has turned into a Tech juggernaut again as its Windows 365 “cloud subscription” model has worked to perfection. You can see in the chart that MSFT’s market cap has been rising nearly as quickly as Apple’s market cap since 2016.
Below is a look at the spread between the two market caps going back to 1986. While Apple maintained a healthy lead in size over the past few years, the company’s recent swan dive has left it only marginally larger than Microsoft. As of this morning, Apple’s market cap stands at $821 billion, while Microsoft is worth $816 billion!
Bespoke Morning Lineup – The Market Giveth and the Market Taketh Away
After a strong start to the last week of November on Monday, it’s looking like we’ll give back half of those gains this morning. The culprit today? Trade. What else is new? There’s a lot of Fedspeak on the calendar, though, so we’ll be watching for any signs of a change in tone.
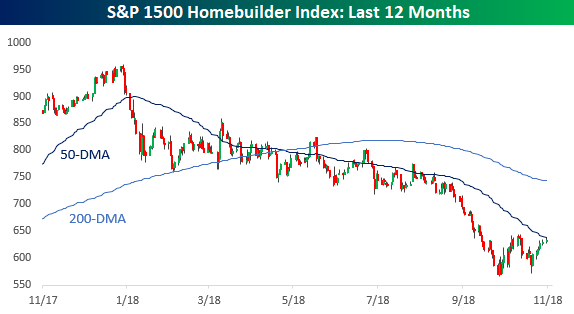
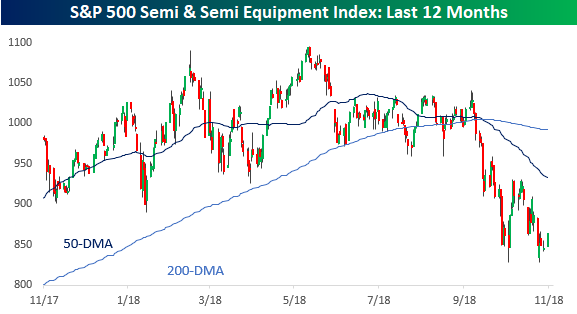
Two sectors of the market we continue to watch religiously are the homebuilders and semis. Both of these groups started to see significant weakness well ahead of the broader market, so if they can stabilize, it stands to reason that it would be a good sign for the market in general. Looking at the two charts below, we have seen some somewhat encouraging signs that the groups are stabilizing, but they are hardly out of the woods yet.
In the case of homebuilders, that group made a successful test of its late October lows in the last week or so, but still hasn’t made a higher high or traded back above its 200-DMA. Until either of those developments unfold, the group could just as easily roll back over.
Semis don’t even look as encouraging as the homebuilders. For now, the group looks to be attempting to establish a double-bottom, but it has yet to show much in the way of a bounce.
Start a two-week free trial to Bespoke Premium to see today’s full Morning Lineup report. You’ll receive it in your inbox each morning an hour before the open to get your trading day started.