Q2 2025 Earnings Conference Call Recaps: Lamb Weston (LW)
Bespoke’s Conference Call Recaps use AI to summarize lengthy earnings calls. The commentary below is AI-generated and then edited by Bespoke for quality control. As always, none of these summaries should be construed as recommendations to buy or sell any securities, and investors should do their own research and/or consult with a financial professional before making any investment decisions.
Our latest recap available to Bespoke subscribers covers Lamb Weston’s (LW) Q4 2025 earnings call.
![]()
Lamb Weston (LW) is one of the world’s largest producers of frozen potato products, supplying French fries and other potato-based snacks to global quick-service restaurants (QSRs), foodservice distributors, and retailers. Lamb Weston is a bellwether for consumer demand trends in the QSR and casual dining globally. Its insights into fry attachment rates, restaurant traffic, and category growth offer a window into broader consumer behavior and foodservice recovery. The company beat expectations behind strong global volume growth (+8% overall, with 4% in North America and 16% internationally) despite continued softness in restaurant traffic. While price/mix declined 4% due to promotional efforts in a competitive market, gains in smaller and retail accounts helped offset weakness from QSR hamburger chains. The company launched a $250M cost-savings plan and reaffirmed its “Focus to Win” strategy, targeting premium product segments and strategic markets. Inventory reduction and curtailments improved working capital, while GLP-1 concerns were downplayed. Fiscal 2026 guidance assumes flat traffic, continued pricing pressure, and tariff risks of about $25M. LW shares rose as much as 20% on 7/23 after posting EPS and revenue beats…
Continue reading our Conference Call Recap for LW by becoming a Bespoke Institutional subscriber. You can sign up for Bespoke Institutional now and receive a 14-day trial to read our newest Conference Call Recap. To sign up, choose either the monthly or annual checkout link below:
Q2 2025 Earnings Conference Call Recaps: GE Verona (GEV)
Bespoke’s Conference Call Recaps use AI to summarize lengthy earnings calls. The commentary below is AI-generated and then edited by Bespoke for quality control. As always, none of these summaries should be construed as recommendations to buy or sell any securities, and investors should do their own research and/or consult with a financial professional before making any investment decisions.
Our latest recap available to Bespoke subscribers covers GE Verona’s (GEV) Q2 2025 earnings call.
![]()
GE Verona (GEV) is a global energy infrastructure company focused on accelerating the electrification and decarbonization of the world’s power systems. It designs, manufactures, and services equipment across three major segments: Power (gas turbines, steam, nuclear, hydro), Wind (onshore and offshore turbines), and Electrification (grid hardware, software, and storage). With a $129 billion total backlog, the company plays a central role in modernizing energy systems, serving utilities, governments, and industrials worldwide. GE Vernova also provides early insight into how data centers, grid reliability, and renewable adoption are shaping global energy demand. GEV posted a strong quarter led by surging demand for gas turbines, steam upgrades, and electrification equipment, with Power segment orders up 44% and Electrification revenue up 20%. Aeroderivative turbine orders jumped from 1 to 27 YoY, fueled by data center demand. Wind remains challenged (–$300M YTD loss) but is nearing breakeven. Tariffs are tracking toward a $300–$400M hit in 2025, mostly in Offshore Wind. AI and automation investments are scaling up, including the acquisition of Alteia for grid orchestration. On better-than-expected results, GEV shares climbed more than 12% on 7/23…
Continue reading our Conference Call Recap for GEV by becoming a Bespoke Institutional subscriber. You can sign up for Bespoke Institutional now and receive a 14-day trial to read our newest Conference Call Recap. To sign up, choose either the monthly or annual checkout link below:
Q2 2025 Earnings Conference Call Recaps: Capital One (COF)
Bespoke’s Conference Call Recaps use AI to summarize lengthy earnings calls. The commentary below is AI-generated and then edited by Bespoke for quality control. As always, none of these summaries should be construed as recommendations to buy or sell any securities, and investors should do their own research and/or consult with a financial professional before making any investment decisions.
Our latest recap available to Bespoke subscribers covers Capital One’s (COF) Q2 2025 earnings call.

Capital One (COF) is a leading US-based financial services company offering a broad range of consumer and commercial banking products, including credit cards, auto loans, savings accounts, and commercial lending. Known for its pioneering use of data and technology, Capital One has evolved into a tech-driven financial institution serving over 100 million customers. The company’s recent acquisition of Discover adds a powerful payments network and deepens its presence in cards, consumer lending, and digital banking. What sets Capital One apart is its vertically integrated model, combining credit issuance, banking, and now a proprietary payment network backed by a decade-long investment in cloud-based infrastructure and AI capabilities. This quarter was dominated by the completion of the Discover acquisition on May 18. The deal added $2B in revenue but also drove a $6.4B net loss, primarily due to an $8.8B provision build. Executives emphasized the integration is on track, though costs are trending above the initial $2.8B estimate. Management reiterated confidence in long-term earnings power and synergy realization. Notably, Capital One is aggressively investing in AI, international network expansion, and its premium credit card offerings like Venture X. The company also began migrating its debit volume to the Discover Network, a major strategic shift with long-term upside. Shares of COF traded up nearly 2% on its earnings reaction day on 7/23.
Continue reading our Conference Call Recap for COF by becoming a Bespoke Institutional subscriber. You can sign up for Bespoke Institutional now and receive a 14-day trial to read our newest Conference Call Recap. To sign up, choose either the monthly or annual checkout link below:
Bespoke’s Morning Lineup – 7/23/25 – Let’s Make a Deal
See what’s driving market performance around the world in today’s Morning Lineup. Bespoke’s Morning Lineup is the best way to start your trading day. Read it now by starting a two-week trial to Bespoke Premium. CLICK HERE to learn more and start your trial.
“Restlessness is a fickle catalyst; it can drive you to achieve or it can coax your demise” – Slash

Below is a snippet of commentary from today’s Morning Lineup. Start a two-week trial to Bespoke Premium to view the full report.
The deals are starting to come in. Last night, President Trump announced a trade deal with Japan, which will set tariffs on imports from the country into the US at 15% (more details in today’s Morning Lineup). Futures are higher in response, with the biggest gains coming in the Dow while Nasdaq futures are just marginally higher.
Asian stocks surged in response to the news, with the Nikkei rising over 3% while other markets in the region saw broad gains. Japanese automakers have been the biggest winners with gains of over 10%. The positive sentiment from the trade deal with Japan has seeped into European trading as the STOXX 600 is up about 1%
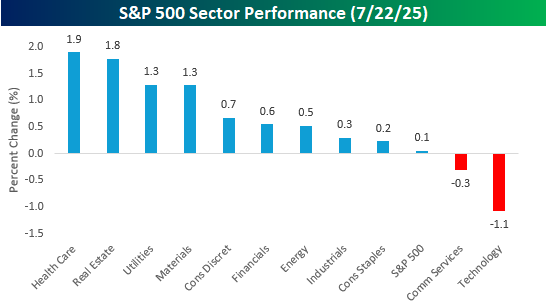
Yesterday was a strange day for the market. While the S&P 500 finished the day with a fractional gain of 0.06%, four sectors traded up more than 1% on the day, and nine of eleven sectors finished the day higher. The only two sectors to finish lower on the day were Technology (-1.1%) and Communication Services (-0.3%). As another example, while the S&P 500 was barely up, the equal-weighted index was up over 1%. You don’t see that very often!
Given the strong breadth at the sector level, individual stock breadth was also very positive as the S&P 500’s net advance/decline reading was +314 – the strongest since June 6th! Going back to 1990, it was just the ninth time that the S&P 500 had a daily breadth reading of +300 or more on a day when the S&P 500 finished up by less than 0.5%. Yesterday was also the smallest gain of those nine prior days (and there has never been a day when net breadth was +300 and the S&P 500 finished down on the day).
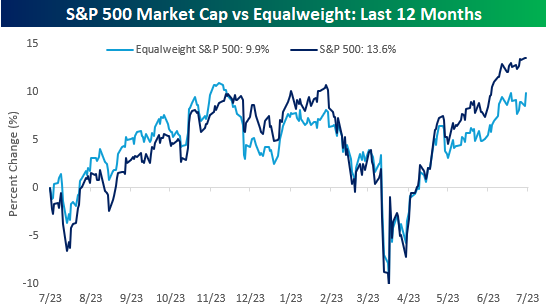
Checking up on the performance of the S&P 500 market-cap-weighted index versus the performance of the equal weight index, even after yesterday’s improvement in the equal weight index, the cap-weighted index has handily outperformed over the last year. While the performance gap between the two indices is wider now than at any point in the last year, it’s interesting to note that as recently as early May, the equal-weight index was outperforming the cap-weighted index. It just goes to show that trends can be quick to change, especially in the market.
The Closer – P/S, Baskets, Reminiscences of 2021 – 7/22/25
Log-in here if you’re a member with access to the Closer.
Looking for deeper insight into markets? In tonight’s Closer sent to Bespoke Institutional clients, we start out with a look at the price-to-sales ratio hitting new cycle highs (page 1) followed by an update of a handful of baskets (page 2). We also check in on performance of heavily shorted names (pages 3 and 4) before finishing with an update of our Five Fed Manufacturing Composite (page 5) and tonight’s earnings reports (page 6).
See today’s full post-market Closer and everything else Bespoke publishes by starting a 14-day trial to Bespoke Institutional today!
Q2 2025 Earnings Conference Call Recaps: DR Horton (DHI)
Bespoke’s Conference Call Recaps use AI to summarize lengthy earnings calls. The commentary below is AI-generated and then edited by Bespoke for quality control. As always, none of these summaries should be construed as recommendations to buy or sell any securities, and investors should do their own research and/or consult with a financial professional before making any investment decisions.
Our latest recap available to Bespoke subscribers covers DR Horton’s (DHI) Q2 2025 earnings call.
DR Horton (DHI) is the largest homebuilder in the United States by volume, serving a wide range of homebuyers with a focus on affordable, entry-level housing. Operating in 126 markets across 36 states, the company offers single-family homes and multifamily rental properties while maintaining an integrated business model through its majority-owned lot development subsidiary, Forestar, and in-house mortgage operations. What sets DR Horton apart is its scale, geographic diversity, and capital efficiency, often providing investors with early insight into U.S. housing market dynamics, consumer affordability, and builder sentiment. Despite a volatile macro backdrop, DR Horton delivered solid Q3 results, supported by disciplined execution and adaptability. The company closed 23,160 homes with a gross margin of 21.8%, exceeding expectations even as incentives increased. Demand remained resilient but price-sensitive, with 64% of closings from first-time buyers and a notable shift toward Federal Housing Administration (FHA) loans. Inventory cycle times improved, and completed spec inventory fell, reflecting tighter build control. Management flagged higher incentives ahead due to mortgage rate uncertainty but reiterated strong full-year guidance. The company also stepped up buybacks to $4.2–4.4B and maintains $5.5B in liquidity, positioning it well for continued market share gains…
Continue reading our Conference Call Recap for DHI by becoming a Bespoke Institutional subscriber. You can sign up for Bespoke Institutional now and receive a 14-day trial to read our newest Conference Call Recap. To sign up, choose either the monthly or annual checkout link below:
Q2 2025 Earnings Conference Call Recaps: Lockheed Martin (LMT)
Bespoke’s Conference Call Recaps use AI to summarize lengthy earnings calls. The commentary below is AI-generated and then edited by Bespoke for quality control. As always, none of these summaries should be construed as recommendations to buy or sell any securities, and investors should do their own research and/or consult with a financial professional before making any investment decisions.
Our latest recap available to Bespoke subscribers covers Lockheed Martin’s (LMT) Q2 2025 earnings call.
![]()
Lockheed Martin (LMT) is the world’s largest defense contractor, specializing in advanced aerospace, missile defense, and security systems for the US government and allied militaries. Its flagship platforms include the F-35 fighter jet, THAAD missile defense, and cutting-edge classified programs from its Skunk Works division. The company plays a central role in global deterrence and homeland defense, offering real-world insights into military readiness, geopolitical risk, and defense spending priorities. It operates across four major segments: Aeronautics, Missiles and Fire Control, Rotary and Mission Systems, and Space. This quarter was defined by a dual narrative: $1.8B in charges from three troubled legacy programs (including a classified Skunk Works effort and Sikorsky helicopter contracts) and Lockheed’s critical role in active US military operations in the Middle East. The F-35 demonstrated stealth superiority in combat, while PAC-3 and THAAD interceptors protected troops in real-time engagements. Hypersonics accelerated with ARRW moving toward production and CPS completing a Navy test. Despite a $4.6B IRS tax dispute and tariff-related cash drag, Lockheed reaffirmed full-year guidance and expects a record backlog by year-end, supported by surging demand for missile defense and homeland protection systems like the proposed Golden Dome. On the EPS and revenue misses, LMT shares fell as much as 9% on 7/22…
Continue reading our Conference Call Recap for LMT by becoming a Bespoke Institutional subscriber. You can sign up for Bespoke Institutional now and receive a 14-day trial to read our newest Conference Call Recap. To sign up, choose either the monthly or annual checkout link below:
Q2 2025 Earnings Conference Call Recaps: Coca-Cola (KO)
Bespoke’s Conference Call Recaps use AI to summarize lengthy earnings calls. The commentary below is AI-generated and then edited by Bespoke for quality control. As always, none of these summaries should be construed as recommendations to buy or sell any securities, and investors should do their own research and/or consult with a financial professional before making any investment decisions.
Our latest recap available to Bespoke subscribers covers Coca-Cola’s (KO) Q2 2025 earnings call.
![]()
Coca-Cola (KO) is the world’s largest beverage company, selling over 200 brands across more than 200 countries and territories. Best known for its flagship Coca-Cola soft drink, the company also owns a broad portfolio that spans sparkling beverages, water, sports drinks, juices, dairy, and ready-to-drink coffees and teas. KO delivered 5% organic revenue growth and 4% EPS growth in Q2 despite a 1% volume decline and 5% FX headwinds. Performance varied by region: the US and Europe rebounded, while India and Mexico faced weather disruptions and geopolitical pressures. Fairlife saw strong demand but remains capacity-constrained until a new US facility opens in 2026. The company leaned into affordability with refillables and mini cans, while continuing to scale marketing innovation globally. Coke Zero Sugar, Sprite, and localized campaigns like “Share a Coke” drove share gains. The US Coca-Cola variety sweetened with cane sugar set for release this fall was also discussed. The stock fell as much as 1.1% on 7/22 despite beats on the top and bottom lines…
Continue reading our Conference Call Recap for KO by becoming a Bespoke Institutional subscriber. You can sign up for Bespoke Institutional now and receive a 14-day trial to read our newest Conference Call Recap. To sign up, choose either the monthly or annual checkout link below:
Q2 2025 Earnings Conference Call Recaps: Equifax (EFX)
Bespoke’s Conference Call Recaps use AI to summarize lengthy earnings calls. The commentary below is AI-generated and then edited by Bespoke for quality control. As always, none of these summaries should be construed as recommendations to buy or sell any securities, and investors should do their own research and/or consult with a financial professional before making any investment decisions.
Our latest recap available to Bespoke subscribers covers Equifax’s (EFX) Q2 2025 earnings call.
![]()
Equifax (EFX) is a data, analytics, and technology company best known for its credit bureau services, but its reach extends into employment, income, identity, and fraud verification. Through platforms like The Work Number (TWN), Equifax offers real-time employment data, enabling government agencies, banks, auto lenders, and employers to make faster, more informed decisions. With its US cloud transformation complete, the company has built a modern infrastructure for multi-data solutions that combine credit, income, and alternative data. Its scale and regulatory relationships give it unique insight into consumer behavior, hiring trends, state budget dynamics, and credit market activity. The company’s earnings call spotlighted a growing divide between short-term government headwinds and long-term optimism, with One Big Beautiful Bill Act (OBBBA)-related requirements and IRS EITC (Earned Income Tax Credit) fraud detection driving a bullish long-range view. Mortgage revenue rose 20% despite 8.5% lower inquiry volumes, buoyed by strong pricing and TWN-enhanced preapproval products. Talent Solutions remained soft as corporate hiring slowed and job churn stayed low. The cloud-powered innovation engine is clearly working: US Information Services hit a 10% new product vitality rate, and international markets are seeing margin lift from efficiency gains. Caution around tariffs and economic uncertainty kept the second-half guide more subdued despite solid YTD results, and the stock fell as much as 7.3% on 7/22…
Continue reading our Conference Call Recap for EFX by becoming a Bespoke Institutional subscriber. You can sign up for Bespoke Institutional now and receive a 14-day trial to read our newest Conference Call Recap. To sign up, choose either the monthly or annual checkout link below: