The Bespoke Report – Patience for the Pateint
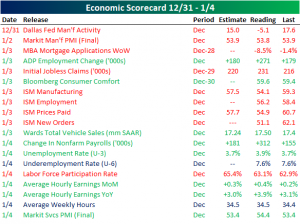
Next Week’s Economic Indicators – 1/4/19
This week saw a mix of manufacturing and labor data with results spanning from huge beats to horrible misses. While most manufacturing data saw sizeable misses, on the bright side, labor data had strong beats in the second half of the week. Dallas Fed Manufacturing Activity started the week on a sour note. As the last US release of 2018, it came in well below expectations and even further below the previous period at a meager –5.1. Markets took Tuesday off to celebrate New Years Day, and on Wednesday we came back to a better, but still weaker, manufacturing reading with the Markit Manufacturing purchase managers index seeing a drop of only 0.1. Thursday saw the ISM release of their manufacturing data which saw broad—but predictable given recent regional Fed indices—declines that far exceeded most forecasts. Despite weak manufacturing sector data in the first half of the week, some positive labor data helped to end the week on a high note. On Thursday ADP released their employment change data for December with a huge surprise to the upside showing 271K additional jobs created. The BLS’s Nonfarm Payrolls report (which typically moves in tandem with the ADP numbers) saw a nice surprise to the upside on Friday as well further reinforcing evidence of a strong labor market.
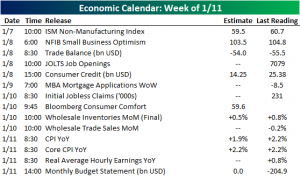
Despite being the first full week coming back from the holidays, next week will be a bit quieter. Whereas this week saw 19 releases, next week will only have 14; none of which will likely be major market movers like the manufacturing or NFP data we just saw. The only release on Monday will be the ISM Non-Manufacturing Index which, like its manufacturing counterpart, is expected to decline although it is also expected to remain at very strong levels. On Tuesday we get a variety of indicators including small business optimism, trade balance data, JOLTS job openings, and consumer credit. Mortgage applications will be the only release scheduled for Wednesday. Thursday will see weekly claims and consumer comfort data alongside wholesale inventories and sales for December. We cap off next week with CPI and the monthly budget statement which will surely be impacted by the government shutdown.
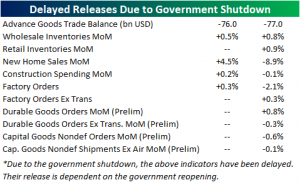
While on the topic of the shutdown, there are a number of indicators that were scheduled to release in the time since the shutdown began but have been postponed due to the closure of the agencies in charge of the data. Below is a list of these indicators. Their release is contingent on the government reopening.
Fed Funds Futures Put Hikes Back On The Table
After yesterday’s weak economic data, lowered guidance from Apple, and a 2%+ drop for the S&P 500, pricing for the future path of the Fed Funds rate reached an extreme level of negativity, with every futures contract trading lower in price than the current one. This meant that the market probability of cuts was greater than that of hikes for every forward period. Given Fed expectations of two rate hikes per the statement of economic projections at the December Fed meeting, that is a market that is very much fighting the Fed!
After today’s strong jobs number, however, futures markets have shifted a little more hawkish, as shown in the chart below. The dark blue line shows the Fed Funds curve as of yesterday, while the light blue line shows the curve today.
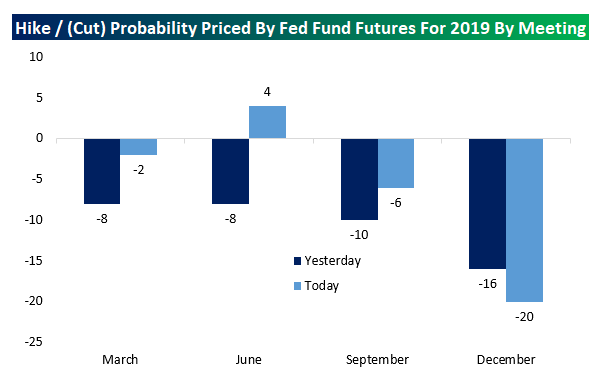
Below we show the implicit probability of a Fed hike at each meeting this year. We assume that only the March, June, September, and December meetings are live. As shown in the chart below, while markets are still pricing greater chance of cut than hike at three meetings this year, June’s meeting date has shifted back towards hikes. Both cut and hike pricing are very tentative from one meeting to the next, but the pricing is still biased towards reductions in the Fed Funds rate rather than continued hikes.
Just because the markets are forecasting a given Fed outcome doesn’t mean that’s what will happen. Below, we compare the overnight Fed Funds rate’s actual value to what the forward market prices for it a year before. As shown, it’s actually very unusual for the market to price Fed policy intentions correctly. That doesn’t mean that the current pricing for cuts over the next year will necessarily be wrong, but it does illustrate that just because the market prices something doesn’t mean it’s a certain outcome. If it was, investing sure wouldn’t be much fun!
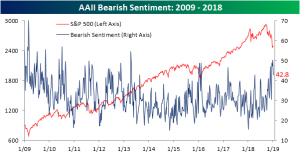
Chart of the Day: Decile Analysis of the Bounce
Highest Dividend Yielders in the S&P 500
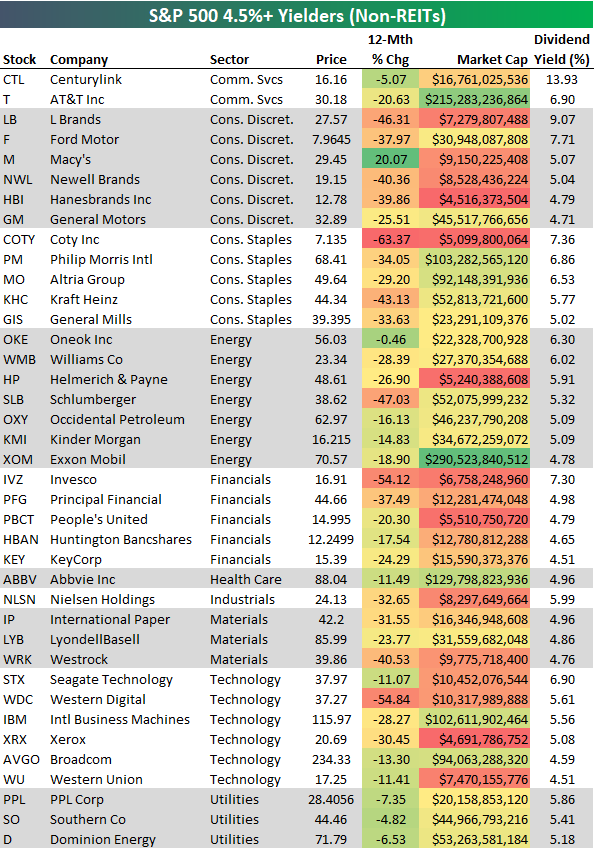
Dividend yields have risen nicely as stock prices have fallen over the last few months. There are currently 39 non-REIT stocks in the S&P 500 that yield more than 4.5% per year. We list these 39 high yielders below broken out by sector.
CenturyLink (CTL) has the highest yield in the S&P 500 at 13.93%. Another Communication Services sector stock — AT&T — is now yielding nearly 7%.
In the Consumer Discretionary sector, L Brands (LB) leads with a 9.07% yield, followed by Ford Motor (F) at 7.71%. Five Consumer Staples stocks have yields above 5% — COTY, PM, MO, KHC, and GIS.
Oneok (OKE) and Williams (WMB) have the highest yields in the Energy sector at 6%+, while Invesco (IVZ) has the highest yield in the Financial sector at 7.3%.
Just one Health Care stock (ABBV) and one Industrials stock (NLSN) made the list of 4.5%+ yielders, while three Materials stocks are on the list — IP, LYB, and WRK.
Six Technology stocks in the S&P 500 have yields above 4.5%, with Seagate (STX) leading the way at 6.9%. Finally, in the Utilities sector, three stocks made the cut — all with yields above 5%. PPL Corp (PPL) has the highest yield of the three at 5.86%.
Bulls Come Crawling Back
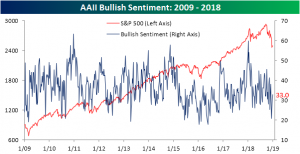
Last week, investor sentiment took an overwhelmingly bearish tone following steep market declines on the FOMC’s rate decision, Fed Chair Powell’s ill-received presser, and a remarkably bad Christmas Eve trading session. This week, bulls came back albeit quietly. The rally that equities have seen in the days coming back from Christmas has helped to only slightly lift bullish sentiment. This week’s AAII survey of individual investors saw bullish sentiment rise to 33.02% from 31.55% last week. Still fairly low compared to where it had been most of 2018, bullish sentiment is now well off of lows from early December.
Bearish sentiment fell this week to 42.8% off of last week’s multi-year high of 50.3%. Bearish sentiment has consistently stayed at an elevated level for a couple months now. Excluding brief periods in the past couple years where bearish sentiment reached similar levels, 2016 was the last time that investors were this bearish for an extended period of time.
The large drop in bearish sentiment paired with the small rise in bullish sentiment means that more investors are turning neutral. In other words, given the neutral sentiment level, investors may not be overly optimistic on the bounce we have seen over the past week, but, on the bright side, they do not seem to be as bearish as they previously were either.

Chart of the Day: Dr. Morgan Doesn’t Heal
Bespoke CNBC Appearance (1/2)
Bespoke’s Paul Hickey appeared on CNBC’s Closing Bell on Wednesday (1/2) to discuss recent action in the market and our outlook going forward. To view the segment please click on the link or image below.
Be Prepared for More Weakness in the Next Three Months

Initial Claims Contradicting ADP
The US got a hit of labor data this morning with the ADP employment change for the month of December and initial jobless claims coming in with contradicting results. While the ADP data saw the biggest surprise to the upside since February 2017, initial jobless claims are telling a slightly different story as it showed a sizeable miss.
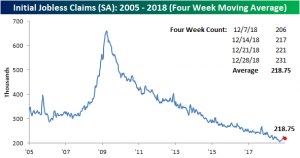
Contrary to last week’s rather boring release, claims came in at 231K; well above expectations of 220K on a seasonally adjusted basis. It is also up from last week’s reading of 221K. That brings the indicator right back near highs from the latter half of November when it peaked at 235K. These upticks still do not necessarily seem to suggest a weaker labor market or that the broader trend has reversed though. While it could technically be early signs of that, more data and further upticks would be needed to confirm this. Regardless, the data alongside the strong ADP report is still showing a very strong labor market holding onto some impressive streaks. Initial jobless claims has now been at or below 250K for 65 weeks in a row. Even more impressively, this week marks the 200th week that claims have come in below 300K!
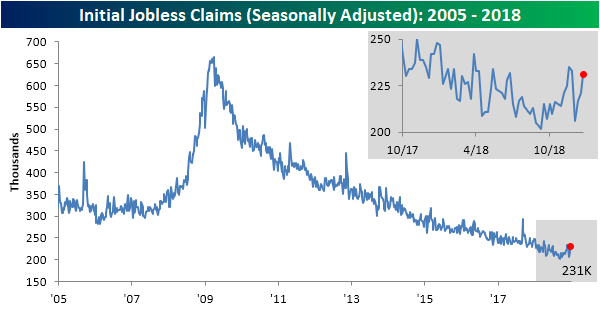
Seeing as this data is high frequency, taking a look at the four-week moving average is telling the same story. While there was a further uptick this week to 218.75K vs 218.00K last week, they should not be a cause for concern yet as the data is still off of recent highs and has yet to definitively break out into any kind of an uptrend.
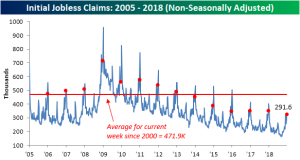
On a non-seasonally adjusted basis, claims came in higher as can be expected due to seasonal effects. As we have been noting the past few weeks, this time of year typically sees a sizeable increase, then a drop, and finally a much larger increase as we head into the new year from which it returns to lower levels once again. Right now we are seeing that second larger increase as claims rose to 323.9K this week up from last week’s level of 291.6K. Next week’s release is typically the highest reading of the year so it should come as no surprise if this number continues to explode upwards, especially with the government shutdown. Even with these sharp seasonal increases, labor data is still historically very strong. As we have seen most weeks in the past year, this reading still came in well below the average for the current week since 2000. Additionally, this year is the lowest level of the current week for all years since 2005.
Morning Lineup – Apple Falls Far From the Tree
Looks like another bad start to the trading day, and bulls can only hope that today’s outcome is as positive as yesterday’s. We’ll find out in a bit over seven hours when the curtains close on the S&P 500’s second trading day of 2019.
Read today’s Bespoke Morning Lineup below for major macro and stock-specific news events, updated market internals, and commentary.
Bespoke Morning Lineup – 1/3/19
What a difference three months makes. Following last night’s warning, AAPL is indicated to open down 8.5% versus yesterday’s close and 38% from its 52-week high exactly three months ago today. To put that decline in perspective, AAPL is now down as much from its high as Facebook (FB) is from its all-time high last July.

Start a two-week free trial to Bespoke Premium to see today’s full Morning Lineup report. You’ll receive it in your inbox each morning an hour before the open to get your trading day started.
