International ETFs Back Above 50-DMAs
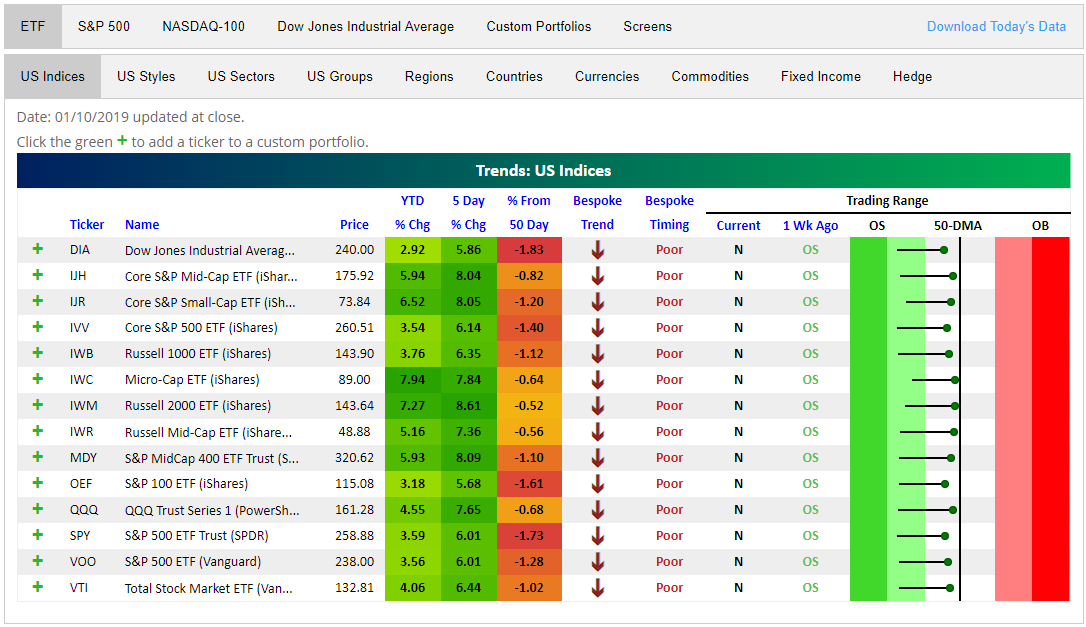
The snapshots below are pulled from our popular Trend Analyzer tool that allows investors to easily monitor baskets of stocks and ETFs for long-term trend shifts as well as overbought/oversold levels. In the first snapshot, we show US index ETFs. On the right side of the snapshot is our trading range section. The dot represents where each ETF sits within its long-term trading range. The tail end is where it was trading a week ago, while the black vertical line represents the ETF’s 50-day moving average. As shown, while all of these US index ETFs have bounced, none have gotten back above their 50-day moving averages.
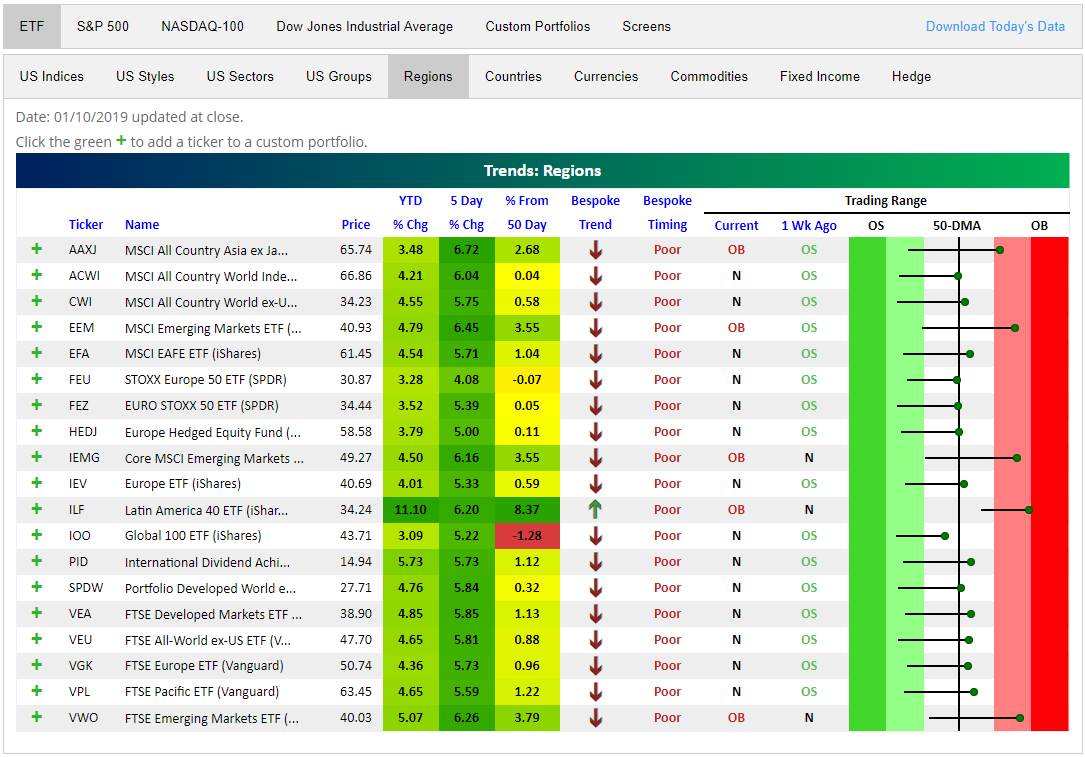
The picture looks a lot different for international equity market ETFs. As you can see, they have all rallied significantly over the last week, and most have already moved back above their 50-day moving averages. This places them in a more bullish light than US ETFs (that are still below their 50-DMAs) from a technical perspective.
Key Earnings Reports Next Week
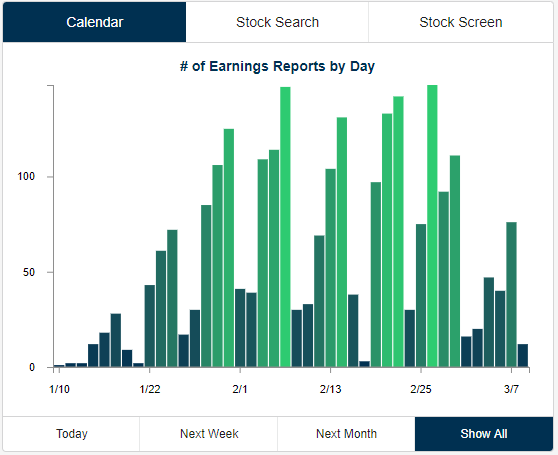
Earnings season begins next week with the big banks kicking things off starting Monday. As shown in the chart below, the big reporting days don’t hit until late January/early February when 100+ companies are set to report each day for a number of weeks.
Below is a list of the key earnings reports to watch next week. For each stock, we show its historical earnings and sales beat rate along with its average one-day price change on its earnings reaction day. The beat rate is simply the percentage of the time the company has beaten consensus estimates, while the average 1-day % change is the stock’s average move on the first trading day following its quarterly release.
On Monday, Citigroup (C) kicks things off with earnings before the open. While the stock has beaten EPS estimates 74% of the time, it has averaged a one-day decline of 0.35% on its earnings reaction days.
JP Morgan (JPM) and Wells Fargo (WFC) report Tuesday morning along with United Health (UNH) and two airlines — Delta (DAL) and United Continental (UAL). UNH beats EPS 91% of the time, which is the strongest beat rate of any company on the list.
On Wednesday morning it’s all Financials on the calendar — Bank of America (BAC), BNY Mellon (BK), BlackRock (BLK), Goldman Sachs (GS), PNC, Charles Schwab (SCHW), and US Bancorp (USB). Wednesday evening we’ll hear from Alcoa (AA), CSX, and Kinder Morgan (KMI).
Thursday morning will be led by Morgan Stanley (MS), while American Express (AXP) and Netflix (NFLX) will report Thursday after the close. NFLX is projected to earn 35 cents/share, and the stock has beaten EPS estimates 85% of the time throughout its history.
Schlumberger (SLB) and VF Corp (VFC) will close out the week with reports on Friday morning.
Subscribe to Bespoke Institutional for complete coverage of earnings season.

Trend Analyzer – 1/11/19 – So Close
The major index ETFs have now spent a full week in a neutral range; a welcome change from the extremely oversold levels we saw to finish 2018. That is a major change from where they were at the end of last week when they all still sat firmly in oversold territory. As we close out the first full week of the year, the YTD gains are yet another nice change when compared to how we finished last year. The trend of the current rally has further solidified that investors are rotating more heavily into small-caps. These ETFs are leading their larger peers by a wide margin as the Microcap ETF (IWC) and the Russell 2000 (IWM) are still the best performers. Over this past week, the IWM has been the better of the two with a gain of 8.61%. That strong performance is shared by IJH, IJR, and MDY which also each have edged out gains of over 8%. In contrast, while by no means are they doing poorly, the large-cap Dow (DIA) and S&P 100 (OEF) are doing the worst as the aforementioned small caps have seen over twice the gains on a YTD basis.
Morning Lineup – Manic Breadth
Futures are indicated a bit lower this morning after five straight days of gains. The only economic indicator on the calendar today was CPI for December which came in right inline with expectations at both the headline (-0.1%) and core levels (0.2%). Read today’s Bespoke Morning Lineup below for major macro and stock-specific news events, updated market internals, and commentary.
Bespoke Morning Lineup – 1/11/19
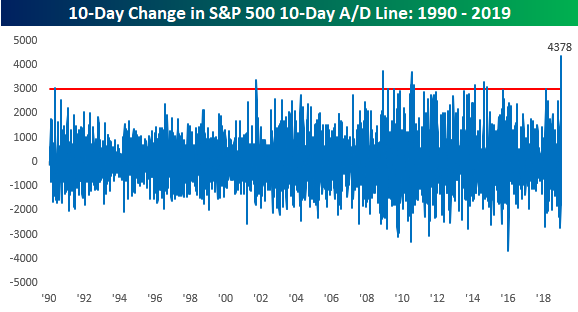
Similar to the swings in the equity market from the sharp leg lower in late December to the massive rally to kick off this year, breadth has also swung from one extreme to another in the last two weeks. Take the S&P 500’s 10-day A/D line, for example. On Christmas Eve, it clocked in at -2,440, which was the most negative reading in this indicator since 8/8/11 and the fourth most negative reading going all the way back to 1990! Ten days later, the 10-day A/D line totally reversed to a positive reading of 1,938, which was the most positive reading since July 2016 and the ninth strongest since 1990. That kind of a reversal from one of the most negative readings in 30 years to one of the most positive is pretty much insane!
With the 10-day A/D line shifting from -2,440 on 12/24 to +1,938 on Wednesday, it was the biggest 10-day change in the indicator on record, and it wasn’t even really close. The next closest reading to the upside was on 12/5/08 when it had a 10-day change of 3,755.
Start a two-week free trial to Bespoke Premium to see today’s full Morning Lineup report. You’ll receive it in your inbox each morning an hour before the open to get your trading day started.

S&P 500 Sector Performance — 2019 vs. 2018
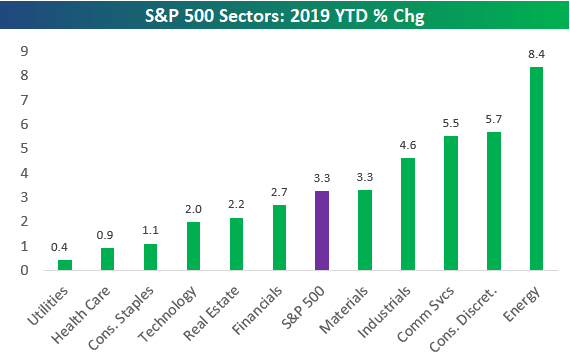
The S&P 500 was up 3.3% YTD as of mid-day today. As shown below, Energy has been by far the best sector so far this year with a gain of 8.4%. Consumer Discretionary ranks 2nd with a gain of 5.7%, followed closely by Communication Services in 3rd with a gain of 5.5%. Industrials and Materials are the other two sectors that have outperformed the S&P 500.
While all eleven sectors are in the black for the year, Utilities and Health Care have lagged the market with gains of less than 1%. Note that the Tech sector — the largest sector of the market — is up 2% YTD, which is 130 basis points less than the S&P 500.
The chart below compares 2019 YTD performance with the change seen in 2018. Utilities and Health Care were the best performing sectors of 2018 and the only two sectors that were up on the year. These two sectors have taken a breather so far in 2019 as the weakest performers.
Generally speaking, the sectors that did the best in 2018 have underperformed so far this year, while the sectors that did the worst in 2018 have bounced the most. Energy was the worst sector of 2018 and is the best so far in 2019. The big exception is Consumer Discretionary, which only fell 1.6% for the full year 2018 and is up 5.7% in 2019 — good for second best so far this year.
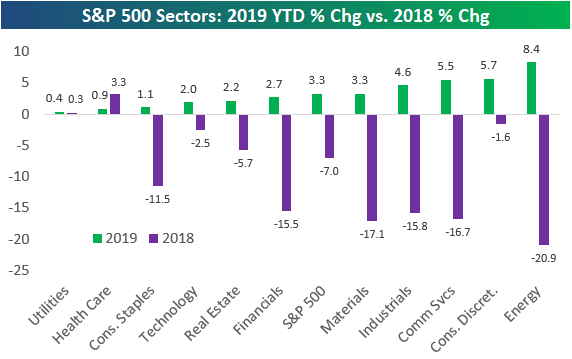
Chart of the Day: Homebuilders Looking Positive
Individual Investors Back To Normal
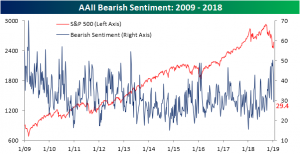
As equity prices have picked back up, so too has bullish sentiment. The survey of individual investors from AAII has seen a decent bounce in bullish sentiment back to more normal levels since hitting a multi-year low back in mid-December. This week’s survey saw 38.5% of investors reporting an optimistic outlook for markets in the next six months. That is right in line with the 38.5% historical average for the history of the survey.
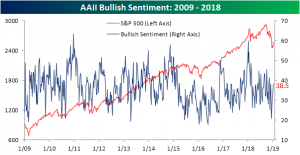
Conversely, bearish sentiment has seen a steep drop. The percentage of investors reporting a negative outlook fell by 13.4% to 29.4%. This measure has also more or less returned to normal levels. It is only around one percentage point lower than the historical average. One interesting point to make, bearish sentiment is currently at its lowest level since early October; right around the time that equities had peaked and took the turn downwards.
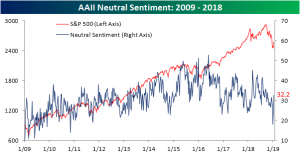
After reaching a remarkably low level only a couple weeks ago, neutral sentiment has picked back up significantly, settling—like the others—right around the historical average. This week, 32.2% of investors reported a neutral outlook, up from 24.2% last week. Though bullish sentiment has lifted, investors who were previously bearish have not necessarily turned bullish. A greater share of the declines in bearish sentiment seemed to have gone to the neutral camp.
Jobless Claims Beat Expectations
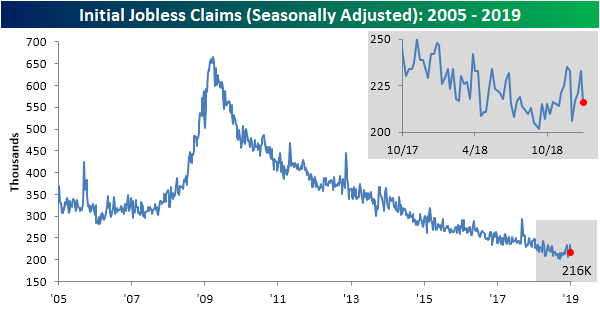
This week’s jobless claims data is piggybacking off the strong readings from Friday’s Nonfarm Payrolls report. Claims for the past week came in at 216K; well below last week’s revised 233K. Forecasts were calling for this drop, though claims were expected to come in 10K higher at 226K. This 216K reading is still off of lows from September but builds the streak of coming in at or under 250K to 66 weeks. This week also marked the 201st week with claims under 300K.
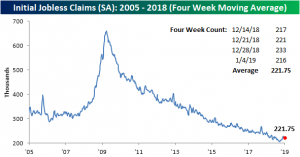
On a four-week moving average basis, claims saw a slight uptick as the low 206K reading from the first week of December has rolled off. The moving average currently sits at 221.75K (up from last week’s 219.25K). While still very low by historical standards, claims seem to have bottomed out some weeks ago, and on a shorter time horizon remain somewhat elevated.
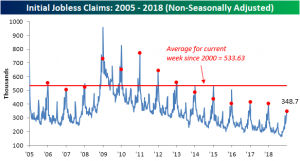
Turning to the non-seasonally adjusted reading is perhaps the most impressive measure of this week’s data. Claims did in fact see a sizeable jump in line with seasonal patterns, but in spite of this rise, claims are still significantly lower than prior years in regards to the current week of the year. At 348.7K, non-seasonally adjusted claims are far below the 533.63K average dating back to 2000. If this week turns out to be the seasonal peak of the year, which is fairly likely based on historical trends, it is the best reading in years. There is still a chance claims can tick higher next week, but even if that uptick happens, this week’s reading only echoes last week’s Nonfarm Payrolls and showcases an enduring and historically hot labor market.
The End or the Beginning
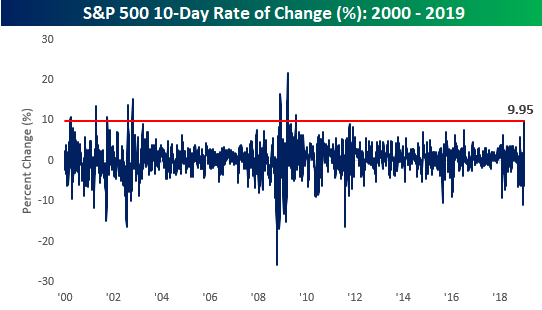
An article on Bloomberg overnight highlighted the ‘historic’ nature of the S&P 500’s rally over the last 10-trading days as the biggest gain since 2009. The chart below shows the S&P 500’s 10-day rate of change going back to the start of 2000, and as you can see, there hasn’t been a larger gain over a similar span since March 2009. Anytime you start hearing comparisons to March 2009, it’s enough to get any bull excited as that kicked off what was the strongest bull market of all time.
When making market comparisons, though, it’s always important to keep perspective and not focus on just one data point. A perfect case in point is the example below. While it is true that the period in 2009 kicked off a period of exceptional market returns, back in the bear market from 2000, there were no less than five different periods where the S&P 500 saw larger moves over a ten-day span before the market could find a firm enough foundation to rally from.
Morning Lineup – We Can’t Go Up Every Day
We were bound to have at least one down day. After four straight days of gains and the biggest 10-day rally since 2009, futures are setting up to take a breather today. If equities can manage to turn things around following some very disappointing results from Macy’s that really will be impressive. Jobless Claims were just released and came in better than expected (216K vs 227K). Read today’s Bespoke Morning Lineup below for major macro and stock-specific news events, updated market internals, and commentary.
Bespoke Morning Lineup – 1/10/19

Start a two-week free trial to Bespoke Premium to see today’s full Morning Lineup report. You’ll receive it in your inbox each morning an hour before the open to get your trading day started.