Energy Comes to Life
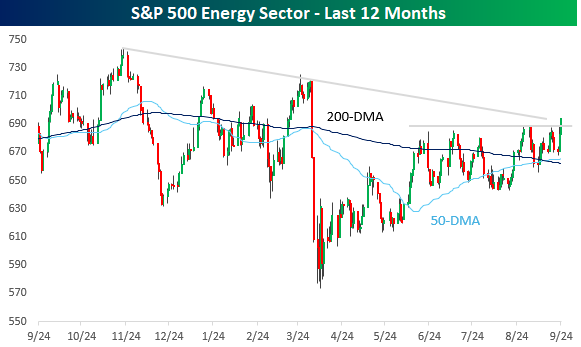
With a gain of less than 6% for the year, the Energy sector has been a big laggard, but with sectors like Technology and Communication Services starting to come under question for their valuations, investors are looking to other places for opportunities. Energy has been a beneficiary in the last few days. The sector has been meandering in a sideways range for the last three or four months, but just today, it broke above the high end of that range to its highest level since the tariff-tantrum in early April. Along with this new short-term high, the sector is also looking to test its downtrend line that has been in place since its high last fall.
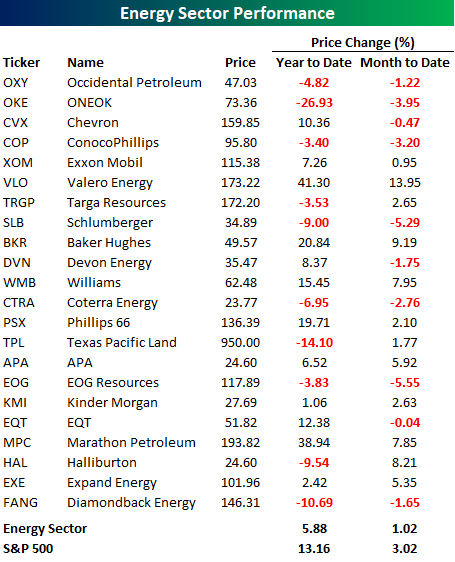
In terms of performance, Energy stocks have been chronic underperformers this year and even this month. The table below lists the YTD and MTD performance of the sector’s 22 components. On a YTD basis, less than half of the sector’s components are outperforming the sector this year, and less than a quarter have outperformed the S&P 500. Even on a MTD basis, the sector’s 1.02% gain has lagged the broader market’s rally of over 3%. Similarly, just half of the sector’s components are outperforming the sector this month, and less than a third (32%) are outperforming the S&P 500. It’s somewhat ironic that even with a positive chart formation, the Energy sector is still underperforming the S&P 500 by a wide margin on both a YTD and MTD basis, but that only provides another example of how strong the overall market has been.

Bespoke’s Morning Lineup – 9/24/25 – Repeat of Last Year?
See what’s driving market performance around the world in today’s Morning Lineup. Bespoke’s Morning Lineup is the best way to start your trading day. Read it now by starting a two-week trial to Bespoke Premium. CLICK HERE to learn more and start your trial.
“Life starts all over again when it gets crisp in the fall.”- F. Scott Fitzgerald

Below is a snippet of commentary from today’s Morning Lineup. Start a two-week trial to Bespoke Premium to view the full report.
The S&P 500 was only down 0.55% yesterday, but that was enough to be the worst day for US stocks since the first trading day of the month. This morning, futures are showing modestly positive gains, with the S&P 500 up 0.13% and the Nasdaq trading 0.21% higher. Treasury yields are also higher as the 10-year has ticked up to 4.13% and is on pace for the fifth daily increase in the six trading days since last week’s cut. Crude oil is up 1% and back up to $64 per barrel for the first time since the middle of the month, but gold is giving back some of the gains from the last two days as it trades back down to $3,800 per ounce. It’s been a rough few days for crypto, but the sector is catching a break this morning as Bitcoin rallies more than 1% while Ethereum is up a more modest 0.55%.
Overnight in Asia, stocks were mixed, with Japan and China trading higher, while India and South Korea slid by about 0.5%. As we saw in many European PMI readings yesterday, Japan’s flash Manufacturing PMI slid further into contraction, falling from 49.7 to 48.4 versus forecasts for a more modest drop to 49.5.
European markets are more negative this morning, with the STOXX 600 trading down 0.3%, as luxury stocks drag the major averages, especially in France, lower.
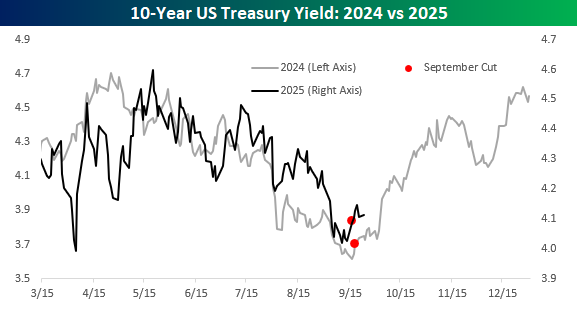
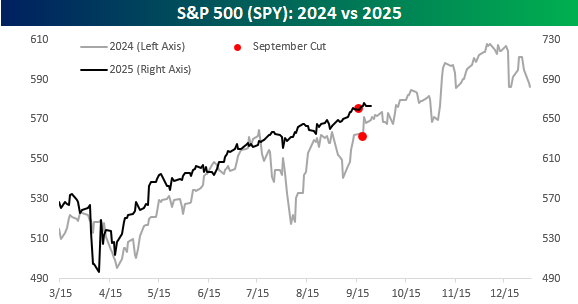
It’s been a week now since the Fed cut rates, and so far the equity market has seen a modestly positive reaction while treasury yields have moved higher, with the 10-year yield moving up to 4.11% from 4.03% last Tuesday, the day before the cut. The rise in yields over the last week undoubtedly is at least partially a reflexive response to what happened after last year’s cut. Back then, yields were in a steady decline in the six months leading up to the cut, falling from 4.7% to just over 3.6%, but the cut rang the bell, and from there, rates retraced all their previous decline by year’s end.
This year, we’ve seen a similar pattern where yields steadily declined leading up to last week’s cut and have been moving higher ever since. The one difference is that last year, most investors expected yields to continue falling into year-end, while this year, the consensus is expecting yields to rise and the curve to steepen. Will history repeat itself, or is it too obvious?
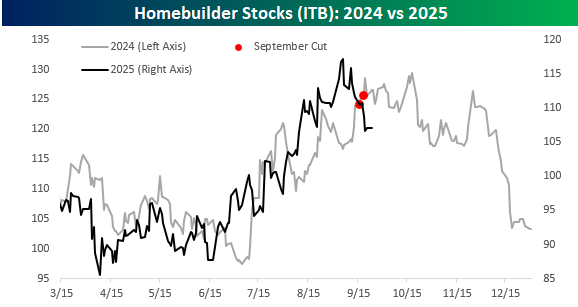
Homebuilder stocks are one of the most interest rate-sensitive sectors of the market, and like treasury yields, they’ve followed a similar pattern this year compared to last year. The one difference is that while the iShares Homebuilder ETF (ITB) was hitting highs for the year at the time of last year’s September cut, this year the ETF peaked about two weeks before last week’s cut. The fact that investors were starting to take profits in the homebuilders ahead of the cut illustrates the sentiment that there was less optimism towards long-term yields continuing lower after the September cut this year, compared to last year.
The S&P 500’s pattern this year varied from last year in that it has been much less volatile leading up to the cut than it was last year. In each case, though, it was trading either right at or very close to new highs at the time of the cut.
The Closer – Bottlenecks, S&P Additions, Ludicrous – 9/23/25
Log-in here if you’re a member with access to the Closer.
Looking for deeper insight into markets? In tonight’s Closer sent to Bespoke Institutional clients, we kick off with a look at the energy bottlenecks for the AI trade (page 1 and 2) before pivoting over to the latest flash PMIs (page 3). We then dive into the latest earnings and Fedspeak (page 4) before closing out with a look into S&P 500 new addition performance (page 5) and an update of our Ludicrous List (page 6).
See today’s full post-market Closer and everything else Bespoke publishes by starting a 14-day trial to Bespoke Institutional today!
Chart of the Day – Breadth and Price Disconnects
Bespoke’s Morning Lineup – 9/23/25 – Apple (AAPL) Joins the Party
See what’s driving market performance around the world in today’s Morning Lineup. Bespoke’s Morning Lineup is the best way to start your trading day. Read it now by starting a two-week trial to Bespoke Premium. CLICK HERE to learn more and start your trial.
“I am who I am today because of the choices I made yesterday.” – Eleanor Roosevelt
Below is a snippet of commentary from today’s Morning Lineup. Start a two-week trial to Bespoke Premium to view the full report.
S&P 500 futures are unchanged as we type this, indicating an uneventful day for equities, although the persistent bid we have seen for months now could pull things higher throughout the session. The only economic data on the calendar this morning is New Home Sales at 10 AM and preliminary PMI data from S&P for the manufacturing and services sector at 9:45. There’s also a heavy dose of Fed speakers, including Chair Powell shortly after noon.
Overnight in Asia, markets were mixed. While Japan was closed, Hong Kong and China were lower, while the Kospi traded higher to record highs. The tone in Europe is decidedly more positive with broad-based strength pushing the STOXX up by 0.3% even as PMI data for the manufacturing sector showed lower than expected growth.
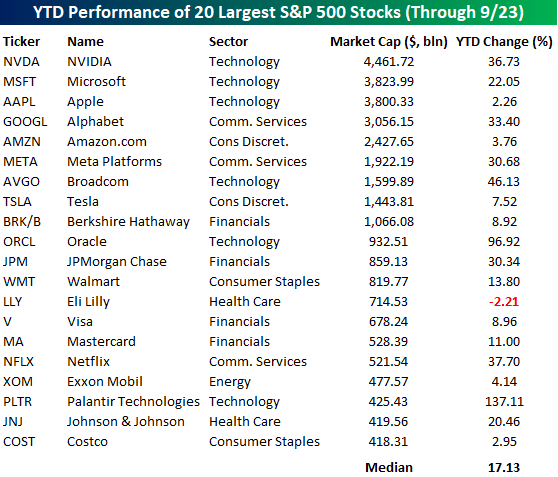
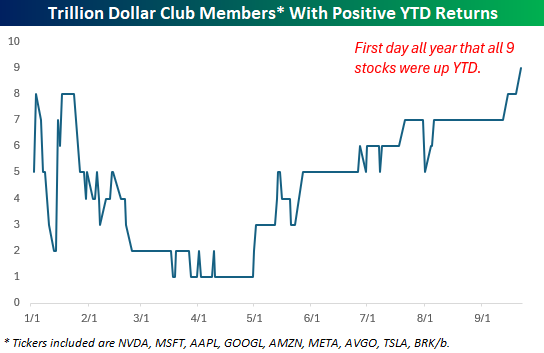
In terms of market leadership, the largest companies in the market continue to dominate. The table below lists the 20 largest stocks in the S&P 500 along with their YTD performance. All but one of them – Eli Lilly (LLY) – is up on the year, and it’s only down 2%. The median performance of the 20 stocks listed is a gain of 17.1%, with half of them rallying at least 20%, including Palantir (PLTR) and Oracle (ORCL), which are up 137% and 97%, respectively.
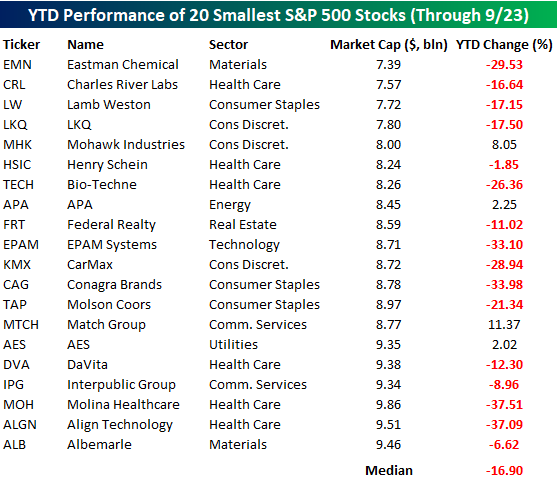
Now, contrast the performance of the 20 largest stocks with the 20 smallest stocks. Only four of the 20 smallest stocks in the S&P 500 are up YTD, and their median performance is a decline of close to 17%. It’s basically a mirror image of the 20 largest stocks. In an investment environment where passive flows should be a tide lifting all boats in the S&P 500, investors are actively abandoning ship on the smallest stocks in the index.
While the largest stocks in the S&P 500 have been leading the market all year, yesterday was a notable one in the fact that it was the first time all nine current members of the trillion-dollar club finished the day with a positive YTD performance. Earlier in the year, we got close with eight stocks in the black, but Apple (AAPL) was the holdout. For the first time all year, though, AAPL finished the day with a positive YTD gain yesterday, joining the eight others in the party.
The Closer – AI Parallels, Fedspeak, Positioning – 9/22/25
Log-in here if you’re a member with access to the Closer.
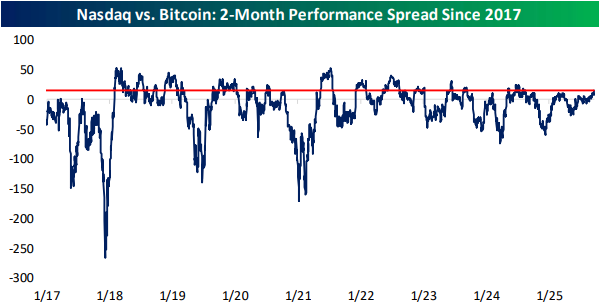
Looking for deeper insight into markets? In tonight’s Closer sent to Bespoke Institutional clients, we lead off with some commentary regarding the market’s current level of frothiness (page 1). We follow up with a review of the performance of stocks relative to crypto (page 2) before switching into some commentary surrounding a busy day of fedspeak (pages 3 and 4). We then finish with a dive into the latest positioning data (pages 5 and 6).
See today’s full post-market Closer and everything else Bespoke publishes by starting a 14-day trial to Bespoke Institutional today!
Chart of the Day: Equal Weight During Bulls and Bears
Gold Back on Track
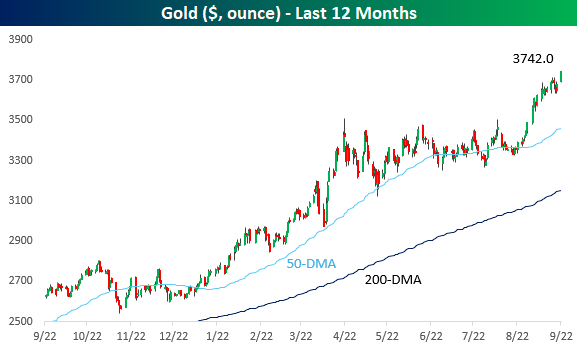
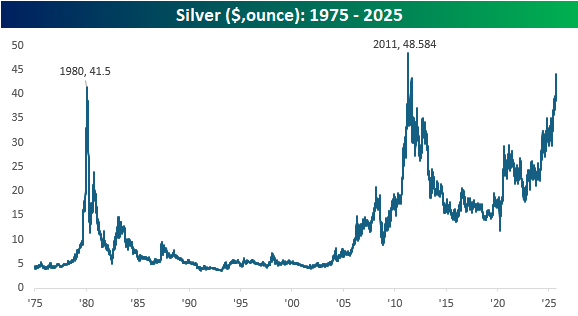
After a couple of days of weakness after the Fed’s rate cut last week (if you can even call it that), gold prices are up 1.8% today and back at record highs. Today is on pace to mark the first close for gold above $3,700 per ounce, and it would be the 9th record closing high this month and the 36th record this year. Already, 2025 ranks as the fourth most record closing highs in a year for gold, trailing 1979 (57), 2024 (46), and 2011 (37).
Gold has been strong this year, but its 42% YTD gain actually trails silver’s gain of 51%. While that has helped to push the ratio between the two metals lower, at the current level of 84.6, the gold-silver ratio remains historically elevated. Earlier this year, the ratio was even wider and briefly surged past 100, but as silver caught a bid over the summer, the ratio moved back down to the range it has been in the last couple of years. Even as the spread has come in over the last five months, though, it is still more than 20 points higher than its historical average. To get back down to that ratio, either gold would need to fall 25%, silver would need to rally 34%, or there would need to be some combination of the two.
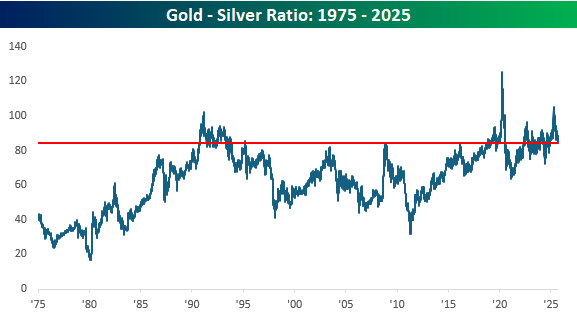
Silver is getting to some interesting levels as well. At $44 per ounce, the bridesmaid of precious metals is right in between its 1980 and 2011 peaks. Back in 2011, when silver made new highs, the breakout was fleeting, but now 15 years later, it’s knocking on the door of new highs once again. Time will tell if silver can make a successful breakout this time, but with runs to new highs being as frequent as the emergence of various cicada species, it doesn’t want to waste its chance!
Ten Bull Market 10-Baggers
Since 10/12/22 – a little over a month before the launch of ChatGPT on 11/30/22 – US stocks have been in what we call the “AI Boom” bull market. While broad market performance has been robust, one striking aspect of this cycle has been the extraordinary gains in a handful of individual equities. Ten stocks in the large-cap Russell 1,000 have now advanced more than 1,000% since the start of this period. These “10-baggers” reflect a mix of AI-driven demand, structural turnarounds, and thematic speculation. Below we take a look at each of these names to provide insight into the breadth of forces powering this bull market beyond the headline indices.
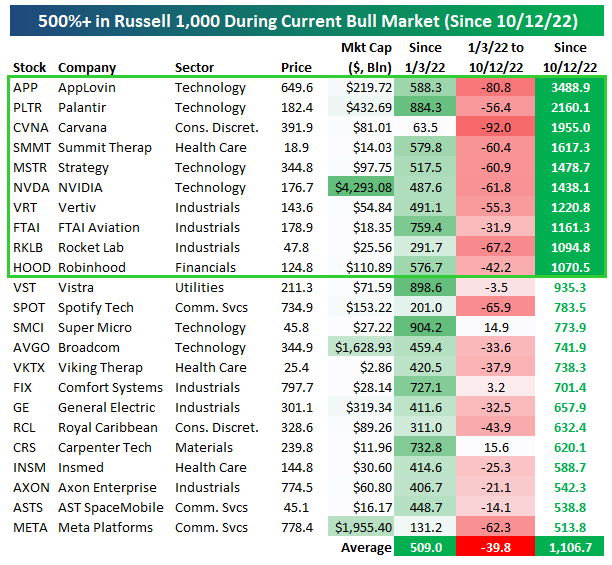
Bull Market 10-Baggers:
AppLovin (APP): AppLovin provides a mobile app monetization and ad-tech platform. The company has benefited from stronger demand for performance-based advertising and the application of AI tools to improve targeting and user engagement. As digital advertising rebounded, investors rewarded APP’s ability to scale profits in an AI-enhanced ecosystem.
Palantir (PLTR): Palantir develops advanced data analytics platforms serving governments and enterprises. Investor enthusiasm has accelerated as the company positioned itself as a key player in applied AI and national security technology. Commercial adoption of its Foundry platform and new AI pilots with large enterprises have reinforced growth expectations.
Carvana (CVNA): Carvana operates an online platform for used-car sales. While not directly tied to AI, its turnaround has been among the most notable of the cycle. Balance sheet repair, improved unit economics, and a favorable used-car pricing environment drove a re-rating, amplified by high short interest and renewed investor risk appetite.
Summit Therapeutics (SMMT): Summit Therapeutics is a clinical-stage biotechnology firm. Its dramatic share price increase followed the licensing of an oncology candidate with substantial market potential. Investor interest in high-upside biotech, coupled with a supportive capital-raising environment during the bull market, propelled the stock to outsized gains.
MicroStrategy (MSTR): MicroStrategy, while a software company by origin, has effectively become a proxy for Bitcoin exposure due to its significant cryptocurrency holdings. The resurgence in digital assets, particularly following the approval of spot Bitcoin ETFs, has driven MSTR’s equity performance well beyond the market average.
NVIDIA (NVDA): NVIDIA is the market leader in GPU semiconductors and has emerged as the clear beneficiary of the generative AI buildout. Surging demand for AI infrastructure, expanding gross margins, and a growing software ecosystem have supported the company’s transformation into one of the world’s most valuable enterprises.
Vertiv (VRT): Vertiv supplies power and thermal management systems for data centers. As hyperscale cloud providers and enterprises expand AI capacity, demand for data center infrastructure has accelerated sharply. VRT has been viewed as a critical “picks and shovels” supplier to the AI cycle, driving its substantial re-rating.
FTAI Aviation (FTAI): FTAI Aviation specializes in leasing and servicing jet engines, particularly the widely used CFM56. Strong air travel recovery, tight supply of engine parts, and lucrative maintenance economics have supported earnings growth. Structural demand for fleet reliability has reinforced investor confidence in the company’s business model.
Rocket Lab (RKLB): Rocket Lab operates as a space launch and satellite systems provider. Investor enthusiasm has centered on its role as a disruptive competitor in small-satellite launches, supported by increasing defense and commercial contracts. While profitability remains distant, the strategic importance of low-Earth orbit systems has underpinned the stock’s advance.
Robinhood (HOOD): Robinhood operates a digital brokerage platform offering commission-free trading. Increased retail participation, higher interest income on customer balances, and growth in crypto trading have supported its rebound. The return of risk appetite during the AI Boom has allowed HOOD to re-emerge as a favored retail engagement vehicle.
The ten stocks that have delivered gains in excess of 1,000% since the onset of the AI Boom highlight the breadth of leadership within this cycle. Some represent clear beneficiaries of AI infrastructure investment (NVIDIA, Vertiv), others reflect speculative enthusiasm in turnaround or emerging growth stories (Carvana, Rocket Lab), and a few embody broader macro themes such as digital assets or retail trading (MicroStrategy, Robinhood). Taken together, they illustrate the defining characteristic of the current bull market: investors are rewarding both transformational innovation and asymmetric recovery opportunities at an extraordinary scale.
While the gains in these ten stocks are remarkable, investors should recognize the speculative nature of such moves. Equities that advance 1,000%+ in less than three years rarely sustain that pace, and history shows that many such names ultimately experience sharp drawdowns. Valuations have expanded dramatically, and future performance will require fundamental follow-through that may not match current expectations. In other words, while these companies illustrate the extremes of the AI Boom bull market, they also highlight the risks of extrapolating past returns too far into the future.
Q3 2025 Earnings Conference Call Recaps: Lennar (LEN)
Bespoke’s Conference Call Recaps use AI to summarize lengthy earnings calls. The commentary below is AI-generated and then edited by Bespoke for quality control. As always, none of these summaries should be construed as recommendations to buy or sell any securities, and investors should do their own research and/or consult with a financial professional before making any investment decisions.
Our latest recap available to Bespoke subscribers covers Lennar’s (LEN) Q3 2025 earnings call.
![]()
Lennar (LEN) is one of the largest homebuilders in the US, constructing and selling single-family homes, townhomes, and multifamily residences across major markets. Lennar serves a broad base of first-time, move-up, and active adult buyers, making it a bellwether for US housing demand. Because housing is deeply tied to rates, confidence, and supply constraints, Lennar’s results often offer insight into the broader housing market and consumer sentiment. In Q3, Lennar delivered roughly 21,500 homes and sold about 23,000, but saw gross margin fall to 17.5% as incentives rose to 14.3% to offset affordability pressures. Management signaled a deliberate pullback in deliveries (Q4 guide: 22,000–23,000) to protect margins while awaiting a demand rebound if mortgage rates hold near 6%. Construction costs fell about 3% YoY, cycle times hit a record low of 126 days, and warranty costs dropped 35%. The company highlighted its asset-light land model (98% controlled lots) and investments in digital sales funnels, dynamic pricing, and AI partnerships like Opendoor to prepare for the next housing upcycle. LEN beat its EPS estimate but came in weaker on sales on a 6.4% YoY decline, and the stock fell 4.2% on 9/19 as a result…
Continue reading our Conference Call Recap for LEN by becoming a Bespoke Institutional subscriber. You can sign up for Bespoke Institutional now and receive a 14-day trial to read our newest Conference Call Recap. To sign up, choose either the monthly or annual checkout link below: