A Golden Day for Gold
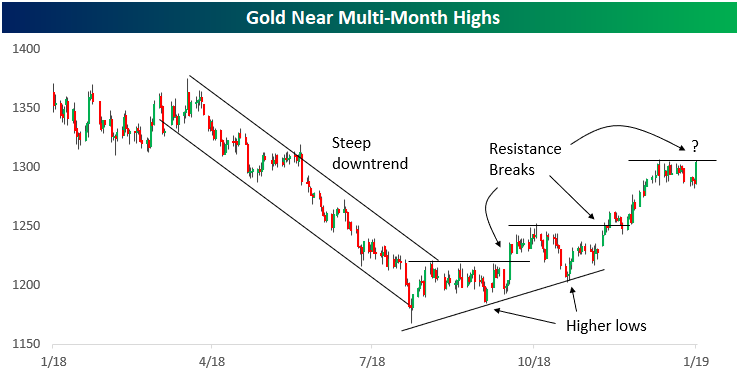
Gold had a rough first half of 2018, but the precious metal has been rallying nicely since equity market volatility picked up in Q4. After making a bottom in mid-August last year, gold has taken a number of bullish technical steps to put it in a new multi-month uptrend channel.
As shown below, gold first made a series of higher lows and higher highs to end 2018, breaking two key resistance levels in the process. It has made another big leg higher over the last month or so, and after a slight dip over the last two weeks, today it has popped once again. As of early afternoon trading, gold was testing another resistance level and trying to make a new rally high. If this resistance can be taken out today or early next week, gold bulls will be looking for yet another leg higher.
Emerging Markets ETF (EEM) Makes Strides
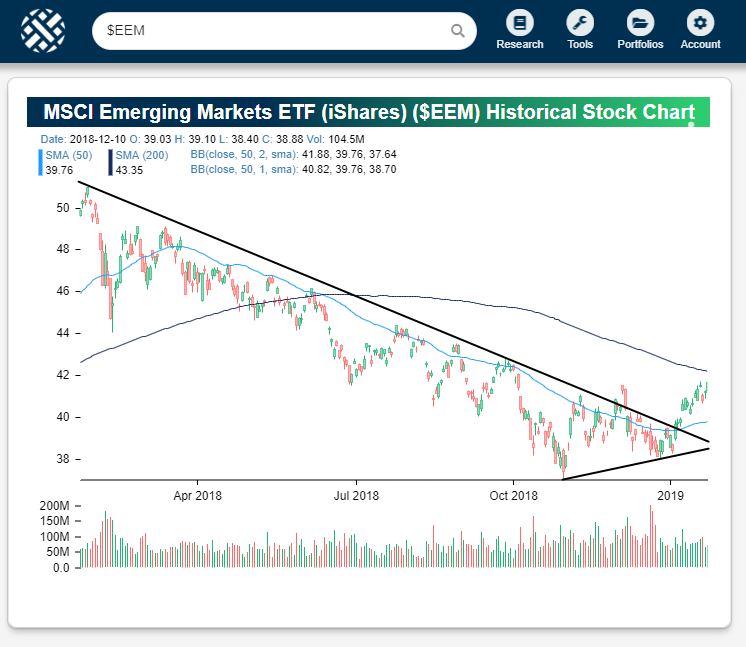
The Emerging Markets ETF (EEM) continues to trend higher in 2019 after a horrible 2018 in which it trended lower for basically the entire year. Below is a snapshot of EEM’s chart over the last year. As you can see, every time EEM got near or just above resistance at its 50-day moving average in 2018, it was stopped dead in its tracks. So far this year, the ETF has managed to break and hold solidly above resistance at its 50-day, and in the process it has broken out of the long-term downtrend channel that was in place. Also, the ETF experienced its first “higher low” at the turn of the year, and this week it has made a “higher high” by trading above prior highs seen in December.
After a very rough stretch of bearish trading, there appears to be light at the end of the tunnel for EEM bulls.
Start using Bespoke’s chart tools like the one below with a two-week free trial to Bespoke Institutional!
Trend Analyzer – 1/25/19 – Still Neutral
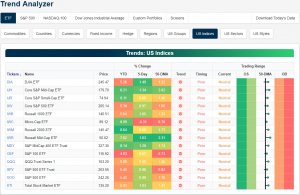
Major US index ETFs in our Trend Analyzer are still in a neutral trading range as they have been for much of the past few weeks. These ETFs have moved slightly closer to overbought territory in the past week but have a ways to go until they get there. Of these names, the Russell Mid-cap (IWR) is the closest to becoming overbought as it is 2.31% above its 50-DMA. IWR is also up the most on the week gaining 1.63%. Other Mid-Cap ETFs like IJH and MDY are some of the others that have seen the largest gains this week. On the other hand, the Micro-Cap (IWC) ETF is the only member of this group that’s down over the last week. Granted, these losses have not pressed it below its 50-DMA.
Morning Lineup – A Positive Close to the Week
Despite a 6% decline from Intel (INTC) in reaction to its Q4 earnings report, US equity futures are looking to close out the week on a positive note. These gains follow strong showings in both Asia overnight and Europe this morning. Read today’s Bespoke Morning Lineup below for major macro and stock-specific news events, updated market internals, and commentary.
Bespoke Morning Lineup – 1/25/19
Breaking downtrends. That seems to be the theme of this week as a number of charts we go through show similar patterns of breaking the short-term downtrends of the fourth quarter. Granted, longer-term downtrends remain in place, but you have to start somewhere! The example we wanted to highlight this morning is Europe’s STOXX 600. As shown in the chart below, after a brief consolidation following the upside break of the 50-DMA, today’s rally has pushed the STOXX 600 above the short-term downtrend that has been in place since last Fall.

Start a two-week free trial to Bespoke Premium to see today’s full Morning Lineup report. You’ll receive it in your inbox each morning an hour before the open to get your trading day started.

Bespoke’s Sector Snapshot — 1/24/19
We’ve just released our weekly Sector Snapshot report (see a sample here) for Bespoke Premium and Bespoke Institutional members. Please log-in here to view the report if you’re already a member. If you’re not yet a subscriber and would like to see the report, please start a two-week free trial to Bespoke Premium now.
Below is one of the many charts included in this week’s Sector Snapshot, which shows where each sector is trading relative to its 50-day moving average (the black vertical “N” line). After a period of extreme volatility that saw sectors move deeply oversold and overbought, things have settled down quite a bit over the last two weeks. Not one sector is currently overbought or oversold, which is just how things stood last week at this time as well.

To find out what this means and to see our full Sector Snapshot with additional commentary plus six pages of charts that include analysis of valuations, breadth, technicals, and relative strength, start a two-week free trial to our Bespoke Premium package now. Here’s a breakdown of the products you’ll receive.
Chart of the Day: Procter & Gamble (PG) Powers Higher
Individual Investors Bullish Again
Bullish sentiment ticked back up this week to 37.7% after falling to 33.5% last week. This comes as the S&P 500 has traded above its 50-DMA for a week now. The weekly investor sentiment survey conducted by AAII has come off of extremely low levels from the late 2018 sell-off and has maintained above 30% readings for all of 2019 so far. This jump in bullish sentiment is still slightly lower than the historical average and where we were only a couple weeks ago (38.5%).
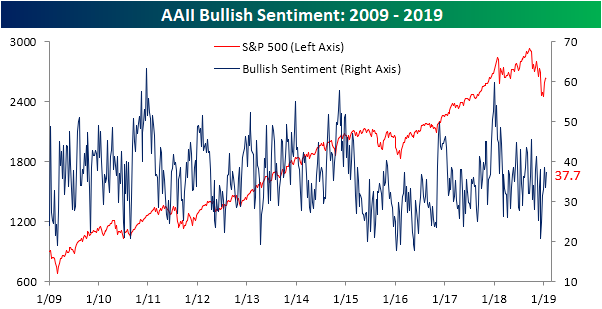
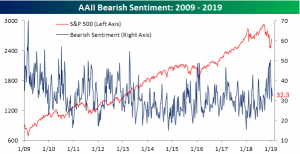
Bearish sentiment fell 4% this week down to 32.3%. Bearish sentiment has fallen off of extremely elevated levels following the Christmas Eve sell-off. While it has fallen, bearish sentiment remains above the historical average of 30.5%, though not by much.
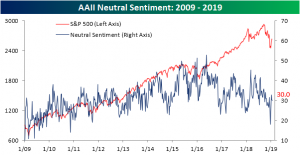
Neutral sentiment has remained essentially unchanged at 30% this week. Given this, the gain in the bullish camp seems to have entirely come from those with formerly pessimistic outlooks.
Jobless Claims: Mic Drop
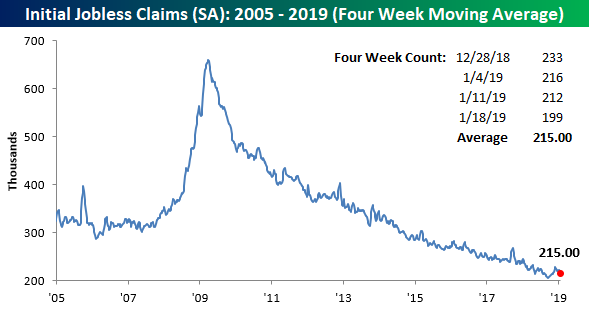
We’ve said it countless times over the last several years, and today we’re forced to say it again regarding jobless claims. Wow! This week’s report on first time claims not only came in lower than expected, but it also dropped below 200K to 199K. Not since November 1969 has a weekly jobless claims print come in with a ‘one’ handle. This week’s report represents a record 203 straight weeks that jobless claims have been at or below 300K, 68 straight weeks of at or below 250K readings, and finally one week below 200K!

With this week’s large decline in claims, the four-week moving average also dropped by over 5K to 215K. That’s still 9K above the multi-decade low of 206K from back in September, but it will continue to drop further next week as we are dropping another large weekly reading from the four-week count.
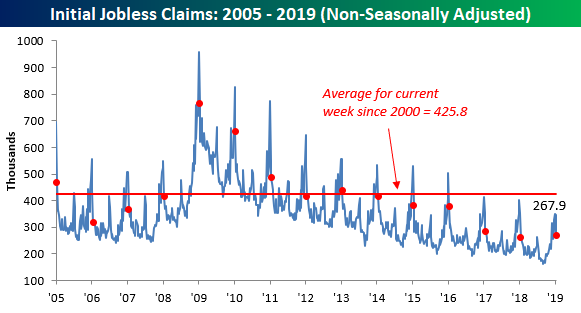
On a non-seasonally adjusted (NSA) basis, claims also saw a large decline falling to 267.9K. That’s more than 150K below the average of 425.8% for the current week of the year dating back to 2000, but it’s actually slightly higher than the reading for the same week last year (260.1K). So it’s the lowest seasonally adjusted reading in a half-century, but not nearly as extreme on an NSA basis.
Morning Lineup – Semi Rally Lifts Pre Market Futures
Semis were supposed to be out of favor, weren’t they? That’s not the case this morning, though, as positive earnings reports from Texas Instruments (TXN), Lam Research (LRCX), Xilinx (XLNX), and Teradyne (TER) are pushing the semiconductor group higher by over 2.5%. Read today’s Bespoke Morning Lineup below for major macro and stock-specific news events, updated market internals, and commentary.
Bespoke Morning Lineup – 1/24/19
The rally in US equities has taken a bit of a breather in the last couple of days as investors try to digest the gains off of the Christmas Eve lows. With the rally on pause for the time being, we wanted to take a quick moment to compare the performance of S&P 500 industries so far in 2019 (x-axis) to their performance in Q4 of 2018 (y-axis). While there are most certainly exceptions, there is a pretty clear trend where the areas of the market that worked in Q4 haven’t really worked all that well in 2019, whereas the industries that were the hardest hit in Q4 have outperformed so far in 2019.
A perfect example is the Energy Equipment Industry, which was the worst performing S&P 500 industry in Q4 (-38%) but has been the best performer so far this year (+16%). One exception? Technology Hardware. In Q4, the industry was down 29.5%, but this year it has also declined, falling 2%. You can thank Apple (AAPL) for that.

Start a two-week free trial to Bespoke Premium to see today’s full Morning Lineup report. You’ll receive it in your inbox each morning an hour before the open to get your trading day started.