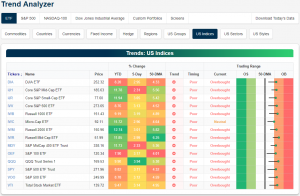
Trend Analyzer – 2/5/19 – Firmly Overbought
Tuesday is starting off with the major US indices trading much more firmly into overbought territory following Monday’s gains. Only the Micro-Cap ETF (IWC) still remains in neutral territory, but even it is right on the border, and it won’t take much for it to join the rest of the group. Every single other major index ETF is currently overbought. QQQ has been on a tear over the past week rising 3.94%, but while it has done well in the short term, since the start of the year, returns have been more middling. Also of note, while mid-caps have generally outperformed so far this year as each of the ETFs tracking these market caps are up well over 10% YTD, S&P mid-caps (MDY and IJH) have been lagging behind in the past week as the worst performers.
Morning Lineup – Positive Follow Through Despite Mixed Earnings
US equity futures are indicating a higher open this morning ahead of a light economic calendar. Overnight, China was closed for the New Year’s holiday and Europe is firmly in the green. While futures are higher, tech is a notable laggard following poorly received results from Alphabet (GOOGL) and lowered guidance from Seagate (STX). Read all about it in today’s Bespoke Morning Lineup.
Bespoke Morning Lineup – 2/5/19
After a slow start to the week Monday, investors once again started to buy stocks between the opening and closing bell as the S&P 500 finished the day up nearly 0.7% while the Nasdaq rose over a full percentage point. With the steady gains we have been seeing lately, the percentage of stocks in the S&P 500 trading at overbought levels continues to tick higher. As of yesterday’s close, a net of 51.4% of the stocks in the S&P 500 are trading at overbought levels (>1 standard deviation above 50-DMA), and that’s the highest reading since late January 2018 when the percentage reached 63.4%. Now, that was high!

Start a two-week free trial to Bespoke Premium to see today’s full Morning Lineup report. You’ll receive it in your inbox each morning an hour before the open to get your trading day started.

The Closer — Small Cap Breadth, Large Cap Revenue, Manufacturing Sales, Canada — 2/4/19
Log-in here if you’re a member with access to the Closer.
Looking for deeper insight on markets? In tonight’s Closer sent to Bespoke Institutional clients, we discuss the outlook of small caps given the Russell 2000’s strong breadth over the past several weeks. We also make note of the Consumer Discretionary sector’s outperformance relative to Consumer Staples to a greater degree than predicted by the ten-year yield. Staying on the topic of outperformance, next, we turn to synthetic credit default swap indices as they outperform cash high yield bonds. We then take a look at the S&P 500’s revenue growth to see that despite apparently peaking indicators, the economy is still healthy. Further in economic data, today saw the release of November (the indicator has been postponed due to the government shutdown) manufacturers’ orders, shipments, and inventories which we provide an update to. We finish tonight with an update on the Canadian economy by taking a look at consumer confidence and auto sales..

See today’s post-market Closer and everything else Bespoke publishes by starting a 14-day free trial to Bespoke Institutional today!
Stellar Earnings Reactions This Season
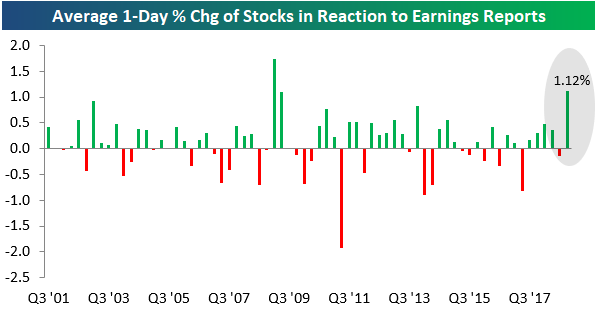
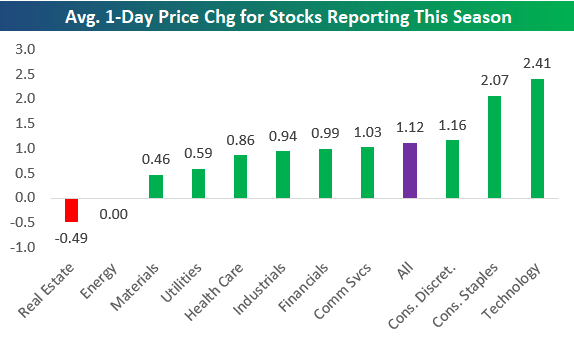
Stocks have been reacting very positively to their earnings reports so far this season. As shown below, the average stock that has reported earnings this season (since January 10th) has gained 1.12% on its earnings reaction day. Earnings season is still not even halfway complete, but if these type of gains continue, it would be the most positive season since the Q1 2009 and Q2 2009 reporting periods that ran from April 2009 through August 2009. If you remember 2009, that was the start of the bull market when the S&P 500 exploded higher off of the Financial Crisis lows.
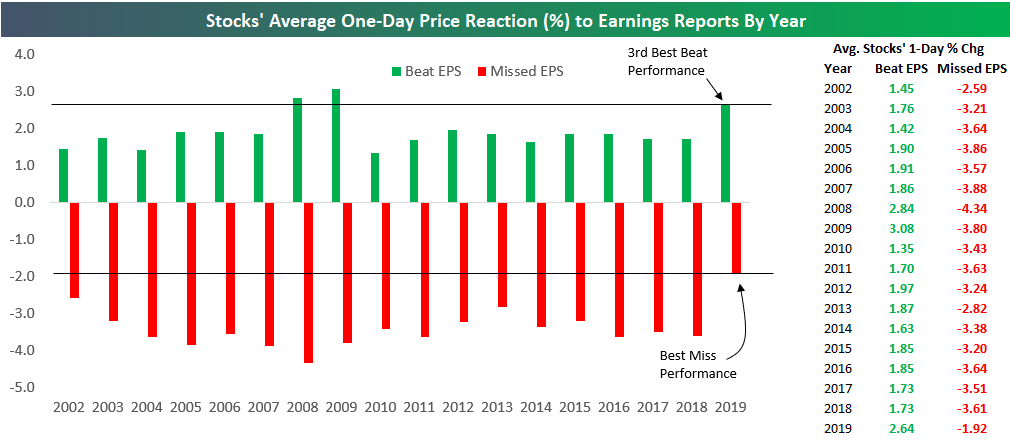
The strength this earnings season comes from earnings beats performing well and earnings misses not falling as much as usual. As shown in the chart and table below, the average stock that has beaten EPS estimates this season has gained 2.64% on its earnings reaction day, while the average miss has fallen just 1.92%. It’s extremely rare to see companies that beat go up more than companies that miss go down. Enjoy it while it lasts, because this type of action won’t last forever. We’ve never gone a full year with this being the case, as is shown below.
The one-day price change for stocks that beat or miss EPS estimates has been very consistent on a year-to-year basis over time. Generally speaking, a stock that beats will gain 1.9% on its earnings reaction day, while a stock that misses will fall 3.5%. Just have a look at the performance of beats and misses from year-to-year and see how consistent these numbers are.
Below we show how stocks are performing on their earnings reaction days this season by sector. Technology stocks are catching a huge bid after they release Q4 results with an average gain of 2.41% on their earnings reaction days. Consumer Staples and Consumer Discretionary stocks are the next best performers, followed by Communication Services and Financials. The only two sectors where stocks aren’t reacting positively to their Q4 earnings results are Energy and Real Estate. The average Energy stock has traded exactly flat on its earnings reaction day this season, while the average Real Estate stock has fallen 0.49%. Every other sector is averaging gains.
Small Cap Relative Strength Near a Turning Point
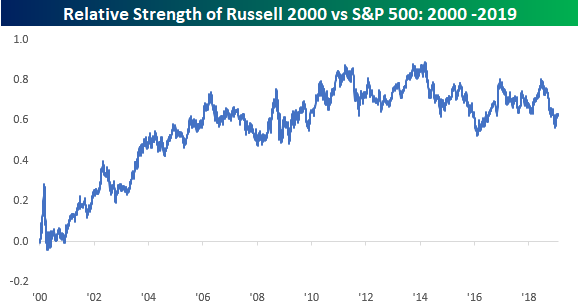
If you’ve been following the market pretty closely, you have no doubt seen the strong outperformance in small caps to kick off 2019. From a longer-term perspective, though, it’s pretty amazing to see that small caps have pretty much been trading range-bound with respect to large caps over the last ten years. The chart below shows the relative strength of the Russell 2000 versus the S&P 500 since the start of 2000. In the chart, a rising line indicates small cap outperformance relative to large-cap, while a falling line indicates that large caps are outperforming. While small caps saw steady outperformance from the start of 2000 right up until early 2006, since then it has been a series of shorter-term ebbs and flows where phases of outperformance by either large or small caps are measured in months rather than years and neither one takes a big lead over the other. To illustrate, since late January 2006, the Russell 2000 is up 114%, while the S&P 500 is up a nearly identical 115%.
Looking at the more recent dynamics between small and large cap stocks, after finally starting to make up some ground versus large caps, small caps have approached a key potential resistance level that had previously acted as support. If the index’s relative strength manages to break above this level, it would set the stage for an even more meaningful rally and quite possibly lead to 2019 being a big year for small caps.
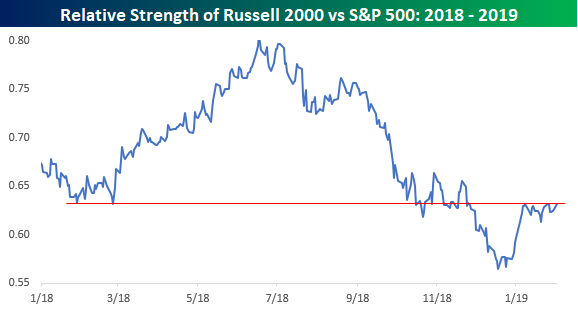
Chart of the Day: Alphabet (GOOG), Disney (DIS) Earnings This Week
Market Seasonals Have Been Bullish in Recent Years
Bespoke’s Stock Seasonality Tool is an easy way to quickly find the seasonal tendencies for US equity indices, ETFs, and individual stocks. The tool is available to you if you’re a Bespoke Premium or Bespoke Institutional member. We monitor the tool on a daily basis for periods of the calendar year that stand out as bullish or bearish. When we checked the tool today, we noticed that the upcoming weeks and months have been quite bullish for the US stock market in recent years.
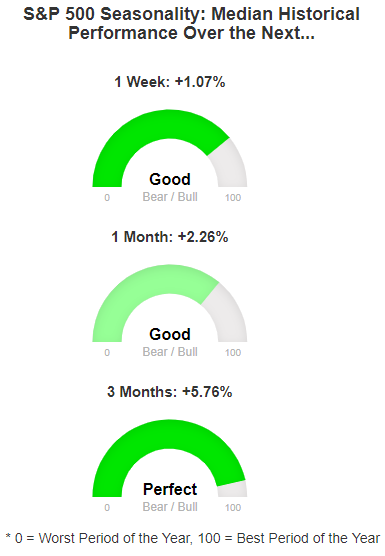
As shown in the screenshot below that we took from the tool this morning, the S&P 500 has seen a median gain of 1.07% over the next week when looking at the past ten years worth of trading data. Based on our gauge that compares the upcoming one-week period to all other one-week periods throughout the calendar year, this is typically a “good” week for the stock market.
Over the next month (February 4th through March 4th), the S&P 500 has seen a median gain of 2.26%, which is also a “good” period for the market relative to all other one-month periods on the calendar.
Finally, the upcoming three-month period (February 4th through May 4th) has been an exceptional period for the stock market over the last ten years. Our gauge measures the next three months as “Perfect” relative to all other three-month periods on the calendar. Going back to 2009, the S&P has seen a median gain of 5.76% over the next three months.
Bespoke Market Calendar — February 2019
Please click the image below to view our February 2019 market calendar. This calendar includes the S&P 500’s average percentage change and average intraday chart pattern for each trading day during the upcoming month. It also includes market holidays and options expiration dates plus the dates of key economic indicator releases.

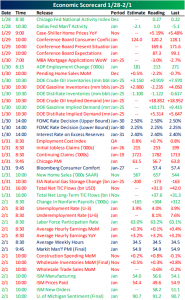
This Week’s Economic Indicators – 2/4/19
It was a busy week last week as we saw 42 economic indicators release. The results mostly surprised to the downside as 22 of these came in below estimates or were lower versus the prior period. Only 14 beat expectations while the remaining 6 came in right in line with forecasts. Chicago and Dallas Fed activity indices kicked off last week with both handily beating expectations. Tuesday saw a string of weaker confidence numbers and a slight deceleration in Case-Shiller Home Prices (although it wasn’t as weak as it looked). On top of an abysmal Pending Home Sales print and mixed EIA data, Wednesday’s FOMC rate decision was the main market mover last week. The Fed’s more dovish tone provided a boost across asset classes. Thursday saw a big miss in Initial Jobless Claims with the government shutdown likely to blame—not due to government workers filing claims, rather the increase being a result of ancillary services and government contractors. Chicago PMI also came in far weaker than expected and was lower versus the prior period. After being held back due to the shutdown, a much stronger than expected New Home Sales print was also released on Thursday. Finally on Friday, the always much anticipated Non Farm Payrolls report showed further evidence of a very hot labor market and reasonably strong economic growth.
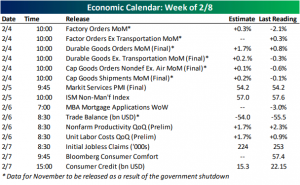
Macroeconomic data takes a bit of a breather this week as only 15 releases are scheduled. Many of the week’s releases are actually November data points that had been postponed due to the government shutdown. Later this morning we will get November Factory, Durable Goods, and Capital Goods Orders and Shipments which are forecast to come in stronger than the prior print. Tuesday will follow those releases up with the services component of global Markit PMIs. The ISM Non-Manufacturing index is set to come out not long after that. On Wednesday, the Treasury will release trade balance data for November which is expected to come in at a slightly smaller deficit. Also coming out Wednesday morning is preliminary productivity and labor cost data for Q4. While Nonfarm Productivity is expected to drop by 0.65 QoQ, labor costs are looking to rise considerably. While there are no releases scheduled for Friday, Consumer Credit on Thursday will close out a relatively quiet week for economic data. Fortunately, hundreds of earnings reports will make up for it!
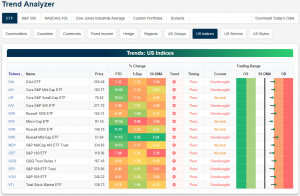
Trend Analyzer – 2/4/19 – ETFs Teeter
Heading into the first full trading week of February, major index trends are looking quite different from the extremely oversold conditions of one month ago. With last week’s gains adding to the list of overbought names, currently, there are 9 ETFs in this group that are overbought while the remaining 5 are all still neutral; though it won’t take much of a move higher to allow these neutral ETFs to join their peers and vice versa. Only the Russell Mid-Cap (IWR) is firmly sitting in overbought territory as it is coming off of strong momentum over the past week, rallying over 2%. The next best performer is the Russell 1000 (IWB) at 1.68%. The Russell 2000 (IWM) still leads the pack YTD with a gain of 11.41%.