The Closer — 200-DMAs, Trade Daze, EMFX Cachet, FX Economic Gaze — 2/6/19
Log-in here if you’re a member with access to the Closer.
Looking for deeper insight on markets? In tonight’s Closer sent to Bespoke Institutional clients, we discuss equities’ prospects of continuing on to new highs given that major indices are beginning to press against their 200-DMAs (an indicator that has proven to be tough resistance in the current drawdown). We also take a look at how EPS estimates have begun to shift. Next up, with the US Census finally releasing trade data for November after the indicator had been delayed due to the shutdown, we take a look at the decline in the trade deficit. Staying on the topic of trade, Chinese trade balance data was also released today which we provide an update to and what these trade balances could mean for growth. We finish by taking a look at the pullback in EMFX as well as what a few asset markets—including the euro-Swiss franc and a composite of nominal 10 year yields from around the globe—are indicating about the global economy.

See today’s post-market Closer and everything else Bespoke publishes by starting a 14-day free trial to Bespoke Institutional today!
Bespoke CNBC Appearance (2/6)
Bespoke Co-Founder Paul Hickey appeared on CNBC’s Squawk Box on Wednesday morning to discuss markets. To view the segment, please click on the image below.

ISM Surveys Show Little in the Way of Inflation
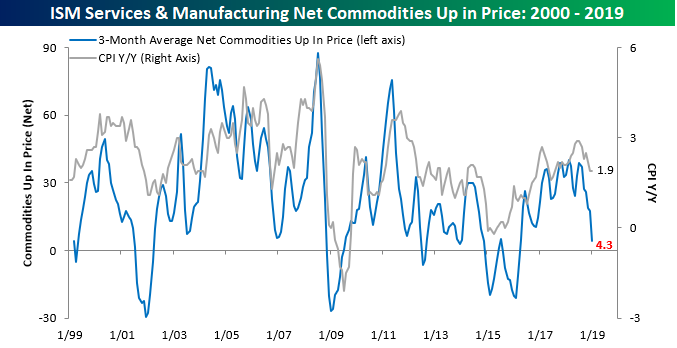
The latest releases of the ISM Manufacturing and ISM Non-Manufacturing reports for the month of January show what appears to be a rapidly declining inflation picture. In each month’s ISM report, respondents are asked which commodities have been rising and falling in prices. In this month’s survey for the Manufacturing sector, respondents noted price increases in 11 commodities and declines in 15. In the case of rising prices, this was tied for the lowest reading since August 2016, while the number of commodities falling in price was the highest since February 2016. On a net basis, the reading of -4 for the number of commodities rising in price was also the lowest since February 2016. For the Non-Manufacturing sector, it was a similar trend with just five commodities rising in price and six falling in price. That net reading of -1 was the lowest since February 2016. Combining the results of both of these surveys together, during the month of January businesses in the Manufacturing and Services sectors noted price increases in 16 commodities and declines in 21 for a net reading of-5. The last time this reading was lower was also in February 2016.
The chart below shows the three-month moving average of the net total number of commodities rising in price compared to the y/y change in CPI. Looking at the trends in both series over time, they have tended to track each other pretty closely, and in many cases, big swings in the results of the commodities survey actually preceded big moves in y/y CPI. Looking at recent moves, in the last few months, we have seen a sharp decline in the net number of commodities rising in prices from a near multi-year high of 38.7 last July to the current level of 4.3 now. During that time, CPI has also declined from 2.9% last July (highest since 2012) to 1.9% now. Based on the sharp drop in the number of commodities rising in price recently, CPI likely has further to drop as well. This should help give the Fed more cover to remain dovish.
Fixed Income Weekly – 2/6/19
Searching for ways to better understand the fixed income space or looking for actionable ideals in this asset class? Bespoke’s Fixed Income Weekly provides an update on rates and credit every Wednesday. We start off with a fresh piece of analysis driven by what’s in the headlines or driving the market in a given week. We then provide charts of how US Treasury futures and rates are trading, before moving on to a summary of recent fixed income ETF performance, short-term interest rates including money market funds, and a trade idea. We summarize changes and recent developments for a variety of yield curves (UST, bund, Eurodollar, US breakeven inflation and Bespoke’s Global Yield Curve) before finishing with a review of recent UST yield curve changes, spread changes for major credit products and international bonds, and 1 year return profiles for a cross section of the fixed income world.
In this week’s report we take a look at a range of indicators from across fixed income markets.

Our Fixed Income Weekly helps investors stay on top of fixed income markets and gain new perspective on the developments in interest rates. You can sign up for a Bespoke research trial below to see this week’s report and everything else Bespoke publishes free for the next two weeks!
Click here and start a 14-day free trial to Bespoke Institutional to see our newest Fixed Income Weekly now!
Chart of the Day: Fastenal (FAST) Sales Suggest Economy Chugging Along
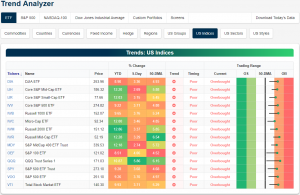
Trend Analyzer – 2/6/19 – 100% Overbought
It has finally happened: every one of the 14 major index ETFs are now reading overbought in our Trend Analyzer tool. The indices vary in the degree of how overbought they are with some firmly overbought like the Nasdaq (QQQ) while others are still pretty close to neutral like the Micro-Cap (IWC). At this time last week, none of the ETFs in this group had yet to move out of their neutral trading range. Some have even rallied from levels just above their 50-DMA. The Nasdaq is actually one of these names making big changes in a short span of time. QQQ has been surging in the past week, rising 5.86%. These gains have brought QQQ to the highest overbought levels out of these ETFs. QQQ has been greatly outperforming the other ETFs. The next best is the S&P 100 (OEF) seeing 4.06% gains over the past five days. Despite these more positive signs, each ETF has still yet to move out of its long-term downtrend and timing is now poor because of that.
Bespoke’s Global Macro Dashboard — 2/6/19
Bespoke’s Global Macro Dashboard is a high-level summary of 22 major economies from around the world. For each country, we provide charts of local equity market prices, relative performance versus global equities, price to earnings ratios, dividend yields, economic growth, unemployment, retail sales and industrial production growth, inflation, money supply, spot FX performance versus the dollar, policy rate, and ten year local government bond yield interest rates. The report is intended as a tool for both reference and idea generation. It’s clients’ first stop for basic background info on how a given economy is performing, and what issues are driving the narrative for that economy. The dashboard helps you get up to speed on and keep track of the basics for the most important economies around the world, informing starting points for further research and risk management. It’s published weekly every Wednesday at the Bespoke Institutional membership level.
You can access our Global Macro Dashboard by starting a 14-day free trial to Bespoke Institutional now!

Morning Lineup – Breadth Makes More New Highs
Equity futures are indicating a slightly lower open this morning, but they are well off their overnight lows. Earnings continue to be a big driver of individual stock moves, and while the video-game makers are down sharply, a number of software stocks are getting a boost following their reports. GM, which just reported now, also handily exceeded forecasts and is trading up nicely on the news. Read all about it in today’s Bespoke Morning Lineup.
Bespoke Morning Lineup – 2/6/19
We first highlighted it last week when the S&P 500’s cumulative A/D line made a marginal new high, but given the moves in recent days, we feel it warrants mention again. As the S&P 500 has broken through resistance around the 2,630 level, cumulative breadth has really taken off as well, easily breaking away from its prior high. Strong breadth indicates broad participation, and that’s exactly what we have seen so far this year as small caps have led the gains, and even the S&P 500 equal-weight index is outperforming the cap-weighted index by over 2% YTD.

Start a two-week free trial to Bespoke Premium to see today’s full Morning Lineup report. You’ll receive it in your inbox each morning an hour before the open to get your trading day started.

Stock Score Leaders Reporting Tomorrow
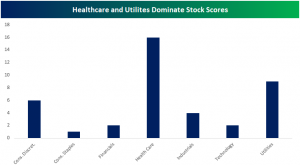
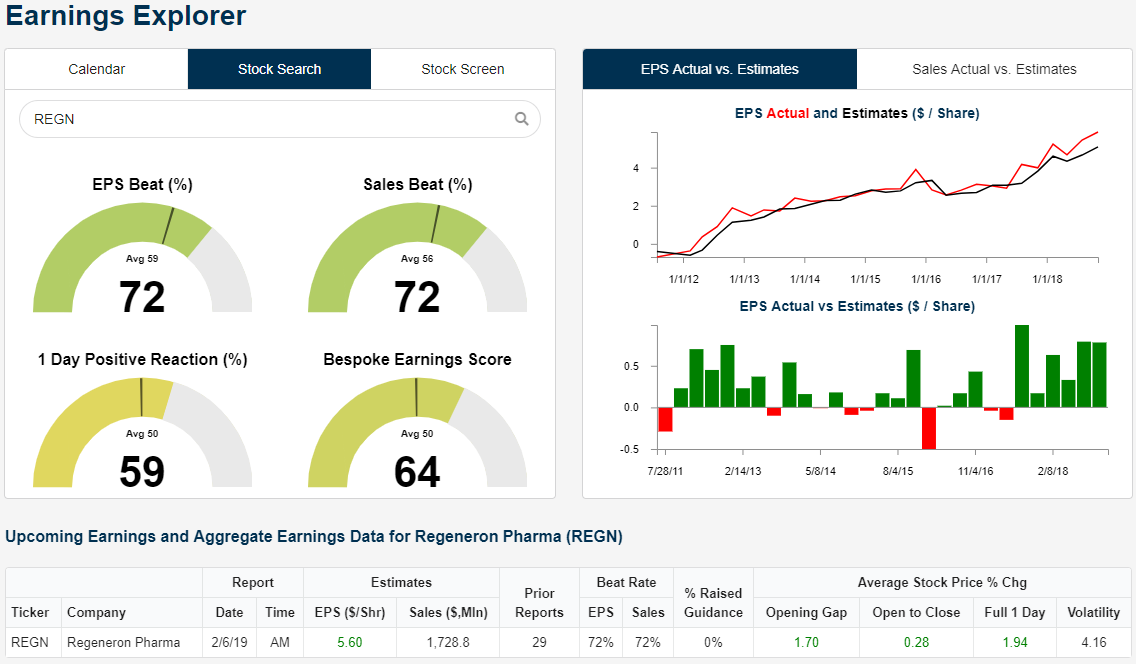
Earlier today we updated our Stock Scores which ranks the stocks in the S&P 1500 on a technical, fundamental, and sentiment basis. The top stocks this week are heavily represented by the Health Care, Utilities, and to a lesser extent, Consumer Discretionary sectors. Of the top 40 stocks in the S&P 1500, 16 are the Health Care stocks, including Regeneron Pharmaceuticals (REGN) which holds the top spot this week with a strong score of 85.83 (out of 100). REGN’s top score is timely as it tops the list just ahead of its earnings report tomorrow morning. In fact, a few of the top-rated stocks that come from these sectors are set to report earnings on Wednesday, including Chipotle (CMG) and Spire (SR).
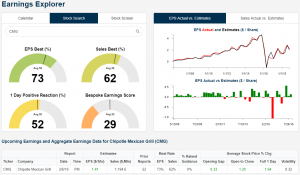
Using the Earnings Explorer tool of our new interactive site, Regeneron (REGN) has beaten both EPS and Sales 72% of the time. While it does not necessarily blow the lid off during Q4 earnings, it averages a gain of 1.94% on its earnings reaction day and is positive a little over half of the time. The stock is also coming off six straight quarters of EPS and sales beats. Given this trend, the company may very well hold onto its “perfect” fundamental score in our Stock Scores ratings while the strong technical setup (technical score of 93.1) could help the stock see a better reaction to earnings.
Also reporting ahead of Wednesday’s open is Spire (SR). The natural gas distributor does not have too many reports under its belt (tomorrow will be its 12th quarter reporting earnings) but has beaten EPS 82% of the time. Despite this, the company on average has gapped down 0.7% but pares those losses, gaining 0.69% from open to close. The company is expected to see EPS come in at $1.30 with $602.5 million in sales.
Chipotle (CMG) is set to report earnings after the close Wednesday. The stock is a bit conflicting this week as it has a very weak Bespoke Earnings Score of just 29, though the Stock Score is much stronger at 82.61, putting it at number three in the S&P 1500 Looking to Wednesday evening’s earnings report, though, it is hard to say how the stock will react to earnings seeing as the past few reports have been fairly inconsistent. Whereas the previous report saw a miss in revenues and an EPS beat, the stock rallied 3.42% on its earnings reaction day. On its prior report, CMG fell from open to close despite beating both EPS and revenue estimates.
Go ahead and use our new interactive site and our popular Earnings explorer tool.