S&P 500 Industry Groups vs 200-DMA
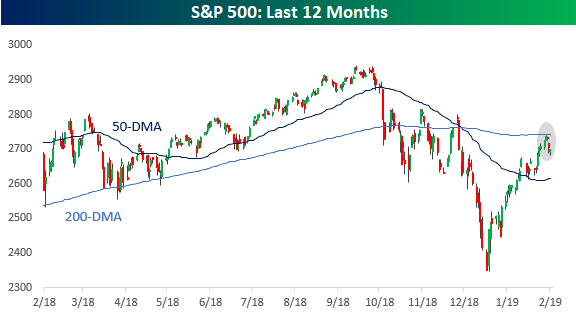
There’s been a lot of discussion regarding the S&P 500’s inability to trade above its 200-DMA after getting close to that level earlier this week.
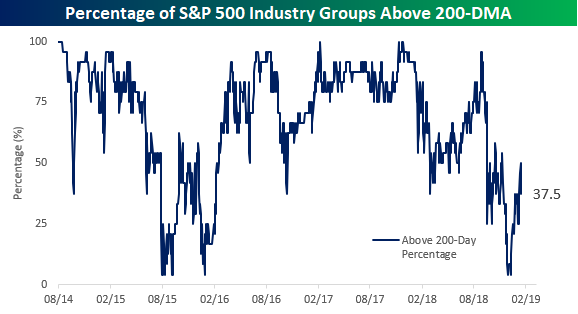
Like the index itself, the majority of the Industry Groups that make up the S&P have also been struggling to retake their 200-DMAs. The chart below shows the historical percentage of Industry Groups above the 200-DMA on a daily basis going back to 2014. Back in early January, this reading cratered all the way down to 4.3% when the only group above its 200-DMA was Household and Personal Products. In the month since then, we have seen the percentage slowly climb higher. While the percentage was close to 50% earlier this week, as the market has declined it also pulled back to the current level of 37.5%. In other words, the market still has a lot of work to do before this reading starts to look healthy again.
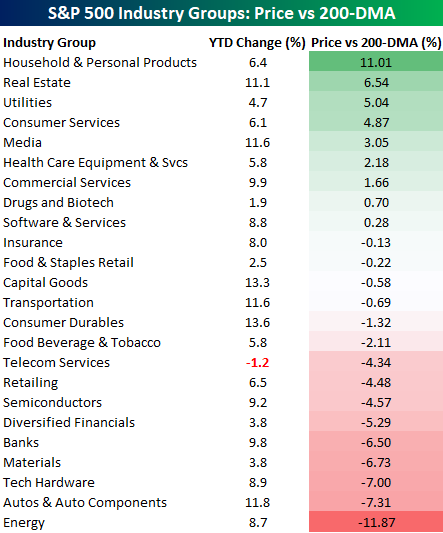
The table below shows the YTD performance of each of the 24 S&P 500 Industry Groups along with how far each of them is trading from their 200-DMA. This helps give us an idea of how quickly the percentage above their 200-DMA could theoretically rise or fall. For example, four groups are less than 1% below their 200-DMA, so even a moderate rally in the market could easily push the percentage back above 50%. After that, though, nearly a third of all the groups are still at least 4% below their 200-DMAs, so it’s going to take quite a move to get those groups on the right side. Conversely, only two of the nine Industry Groups above their 200-DMA are less than 1.5% above that level, so even if the market sees a modest sell-off, we aren’t likely to see much of a decline in the percentage trading above their 200-DMA.
So far this year, the rally in equities has been broad-based. The only Industry Group down YTD is Telecom Services, which is down just 1.2%. On the upside, Consumer Durables (13.6%) are leading the gains, but another five Industry Groups are up by over 10%. Not a bad start.
High Yield Stalls
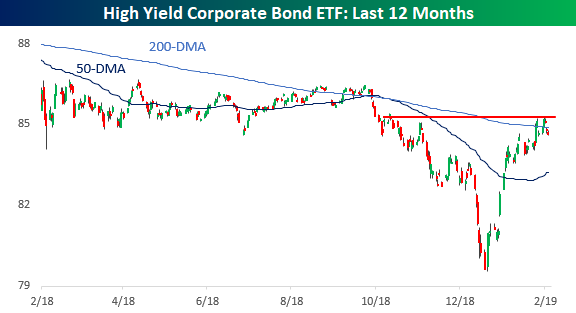
Just like the broader market this week, the rally in high yield credit stalled out a bit. Earlier on Friday, we highlighted the fact that the S&P 500 ran into resistance right at its 200-DMA earlier this week and has been pulling back ever since. In the case of the ETF that tracks the high yield credit market (HYG), we have seen a similar setup. Coming off the lows in December, high yield was a little bit late to the rally, but it quickly made up any lost ground and has since followed the move in the S&P 500 step for step. In fact, this week HYG even managed to briefly trade above its 200-DMA. In this case, though, HYG ran out of momentum pretty much right at the same spot (~$85) where recent bounce attempts also ran out of steam.
The fact that these rallies in both high yield and the broader equity market are stalling out right at key moving averages is no doubt a focus of technicians, but given the magnitude of the moves off the lows, they had to take a break at some point, so why not at a point where everyone was expecting it. The only test now is whether there are enough bids below current levels to support the market, or will sellers eventually overwhelm the balance.
Morning Lineup – Close But No Cigar
A very rough night in Asia (2% declines on the Nikkei) and weak earnings in Europe have equities on the eastern side of the Atlantic lower and credit spreads wider. Commodities are basically treading water on high volume, with oil down but products up, while the USD is at session lows along with UST yields. There’s no economic data in the US today, but there were a ton of earnings reports for investors to deal with overnight. Read all about it in today’s Bespoke Morning Lineup.
Bespoke Morning Lineup – 2/8/19
Barring a big rally today, the chart below is the one practically every technician will be brooding over this weekend. After rallying but coming up just shy of its 200-DMA on Tuesday, the S&P 500 has seen two straight days of declines and is on pace for a third down day today. The failure of bulls to get the S&P 500 above this level on the first attempt is not the end of the world, but it doesn’t help short-term sentiment either.

Start a two-week free trial to Bespoke Premium to see today’s full Morning Lineup report. You’ll receive it in your inbox each morning an hour before the open to get your trading day started.

The Closer — Dollar Opportunity, More on German Autos, ICI Fund Flows — 2/7/19
Log-in here if you’re a member with access to the Closer.
Looking for deeper insight on markets? In tonight’s Closer sent to Bespoke Institutional clients, as the dollar has rallied 1% over the past six days, we provide a look at how domestics have been performing versus international equities. Given this, we provide a list of some attractive names using our Stock Scores and International Revenues Database. Next, we continue our discussion on the German auto industry using new order and production volumes. We cap off tonight’s Closer with the weekly look at fund flows which showed a slightly less positive picture.

See today’s post-market Closer and everything else Bespoke publishes by starting a 14-day free trial to Bespoke Institutional today!
Bespoke’s Sector Snapshot — Failure at the 200-DMA
We’ve just released our weekly Sector Snapshot report (see a sample here) for Bespoke Premium and Bespoke Institutional members. Please log-in here to view the report if you’re already a member. If you’re not yet a subscriber and would like to see the report, please start a two-week free trial to Bespoke Premium now.
Below is one of the many charts included in this week’s Sector Snapshot, which shows the percentage of stocks trading above their 50-day moving averages by sector. For each sector, we show current breadth levels versus where they were one week ago. As you can see, breadth for the entire S&P 500 has fallen slightly since last week, but the majority of the decline has come from big drops for two sectors — Energy and Communication Services. Other sectors like Technology and Financials have actually seen breadth strengthen since last week.

To find out what this means and to see our full Sector Snapshot with additional commentary plus six pages of charts that include analysis of valuations, breadth, technicals, and relative strength, start a two-week free trial to our Bespoke Premium package now. Here’s a breakdown of the products you’ll receive.
Chart of the Day: Top-Down Emerging Markets
Bears in Hibernation
AAII released its weekly survey of individual investors today with a sizeable uptick in bullish sentiment. Last week, bulls and bears were dead even at 31.8%, but this week the bullish camp rose to 39.87%. A portion of this boost in optimism likely came from the more dovish and clear tone of the FOMC from their meeting last Wednesday. This week’s reading is now the highest level since the first week of November. Additionally, another sentiment reading we like to look at is the Investors Intelligence survey of newsletter writers which was released yesterday and was similar to the results of the AAII survey with bullish sentiment rising to its highest level since the final week in October.

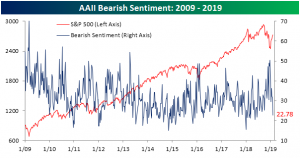
Bearish sentiment, on the other hand, fell dramatically this week, dropping to 22.78% and is now at its lowest level since May 17, 2018. This reading has brought bearish sentiment out of the range it had been stuck in for the past few weeks around the lower 30’s and also back below its historical average of 31%, which despite the post-Christmas rally, it has been above for the past few weeks.
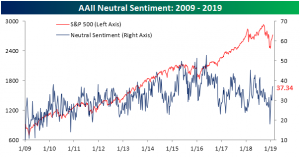
Neutral sentiment has continued to pick up off of its multi-year low at the end of December. This week, investors reporting neutral sentiment rose to 37.34% from 36.49%. That is the fourth straight week of increases in this sentiment measure.
Jobless Claims Come Back But Are Still Elevated
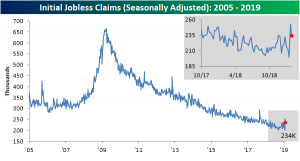
After spiking all the way up to 253K last week, breaking a 68-week long streak of readings below 250K and reaching its highest level since September 2017, Initial Jobless Claims fell a bit this week but still remain fairly elevated. Claims came in at 234K versus forecasts of 221K. Just to illustrate how strong claims have been relative to expectations for the last few years, the last two prints represent the first back to back weeks where claims were more than 10K higher than expected since March 2017. Though claims are elevated, they are still low from a historical perspective and don’t forget, just a couple weeks ago claims came in at one of its strongest levels since the late 60s. Unless it turns into a sustained trend, the increase of the last two weeks is not a major concern.
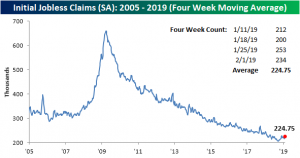
In terms of the four-week moving average, this week saw another lower reading roll off only to be replaced with a higher one, as such, the indicator ticked up to 224.75K versus 220.25K last week. This less volatile measure of jobless claims has now risen for three straight weeks. It has also now spent some time off of its lows from early September. In fact, it has now been 21 weeks since the four-week moving average made a new cycle low, which is the longest streak since April 2016 when we went 26 straight weeks without a new low. Looking to the next couple weeks, the moving average will likely continue to increase as the lower 212K and 200K prints from early January roll off of the average.
The non-seasonally adjusted number also picked up this week to 253.4K from 250.2K last week. Granted, for the current week of the year that is a normal effect to see a slight uptick from the prior week as the average also ticked up to 374.73K versus 369.39K for last week. This week’s NSA reading is still well below this average of 374.7K since 2000, but it is about 10K above the data point for last year.

Most Positive Reactions to Earnings in 5+ Years
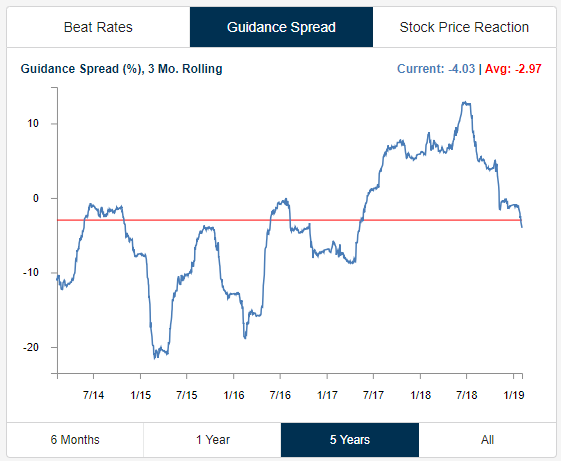
Matt Phillips at the Times wrote an article earlier this week about the positive price reactions we’re seeing from stocks reporting earnings this season, even for companies that aren’t reporting the best of numbers. Expanding on that analysis (which featured some of our work), below are two charts highlighting this trend.
In the first chart, we show the rolling three-month guidance spread for US stocks reporting earnings over the last five years. This chart shows the difference between the percentage of companies raising guidance minus the percentage lowering guidance on a rolling three-month basis. As shown, after peaking above +10 in the middle of last year, the guidance spread has plummeted, reaching -4 as of yesterday. This means that more companies are lowering guidance than raising guidance, and the current reading has moved below the long-term average.
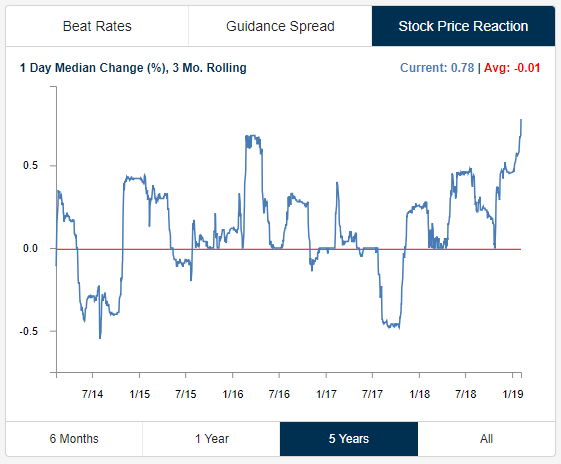
As guidance numbers have fallen, stock price reactions to earnings reports have been soaring. Below we show the median one-day change that stocks experience after reporting earnings on a rolling three-month basis. Over the last three months, stocks reporting earnings have posted a median one-day gain of +0.78%. As shown, that’s the strongest upside reaction to earnings in at least the last five years. In fact, to find a period where the three-month average was stronger, you have to go back to the early months of the bull market following the March 2009 lows. And this is coming as guidance numbers weaken.
It appears as if investors overshot the downside in Q4 2018 and are now rushing to get back in for fear of missing out.
Morning Lineup – Dollar Up For Sixth Straight Day
Overnight trade has not been kind to the US equity markets with the S&P 500 set to open down over half a percent and near session lows. Rates are at session lows as well with the US 10-year yield down for the third session running, while US credit spreads are widening out having made new lows for the current move tighter in spreads since January over the past week. In energy markets, WTI is down over 1%. EM assets generally overnight were weak, down almost 1% thanks to global risk asset weakness.
Data today includes initial claims and consumer credit from the Federal Reserve on an otherwise quiet day. Scheduled Fed speakers today include Kaplan (Dallas, 9:15), Clarida (Vice-Chair, 9:30), and Bullard (St. Louis, 7:30 PM). Read all about it in today’s Bespoke Morning Lineup.
Bespoke Morning Lineup – 2/7/19
A week ago yesterday, the FOMC surprised markets with an even more dovish than expected policy announcement. One would normally expect the dollar to sell-off following a more dovish than expected FOMC, and while we saw a sharp decline in the dollar on the day of the FOMC meeting, since then it has traded higher every single day. With today’s early strength, the index is on pace for its sixth straight day of gains and is now well above levels it was trading at before last week’s FOMC meeting.

The dollar has been strong over the last week, but from a longer-term perspective, it still remains in a downtrend. Yesterday’s bounce brought the Bloomberg US Dollar Index back above its 200-DMA, but it still has yet to break above resistance just under 1,200 at its 50-DMA. So, keep an eye on that level as a sustained rally in the dollar after last week’s Fed pivot would be quite a surprise for financial markets.

Start a two-week free trial to Bespoke Premium to see today’s full Morning Lineup report. You’ll receive it in your inbox each morning an hour before the open to get your trading day started.