The Closer — FX Signals, Delinquency, Differentials, Earnings Reactions — 2/11/19
Log-in here if you’re a member with access to the Closer.
Looking for deeper insight on markets? In tonight’s Closer sent to Bespoke Institutional clients, as the S&P 500 along with a number of other assets hover near their 200-DMAs, we look back at other times that similar situations have occurred. We also see what FX has to say about the US economy as USDJPY surged above its 50-DMA today. Ahead of the NY Fed’s quarterly breakdown of consumer credit, we look at the higher frequency of Black Knight’s mortgage monitor data on credit performance of US home buyers which is showing delinquencies hitting new lows. Moving on to commodities, we then discuss a variety of crude market geographic and grade differentials and see what they have to say about oil’s supply/demand. Turning back to equities, we take a look at the historical reactions for stocks beating earnings and revenue estimates as well as for those that raised guidance. We break this down and offer a look at each sector’s earnings reactions.

See today’s post-market Closer and everything else Bespoke publishes by starting a 14-day free trial to Bespoke Institutional today!
Chart of the Day: Still Digging
This Week’s Economic Indicators – 2/11/19
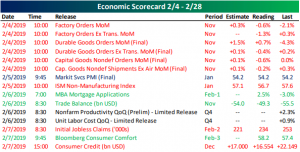
While it was a slow week for economic data last week, the releases we did get were negative for the most part. As shown below, 9 of 15 indicators released were weaker than expected (or down in the case of indicators without estimates) while just 3 were stronger.
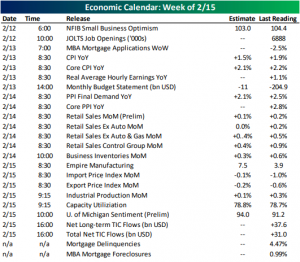
This week will be slightly busier with 24 releases. While there will be nothing released today, small business optimism kicks off the week tomorrow alongside the JOLTS report. CPI will come out on Wednesday along with the Monthly Budget Statement for December. Thursday will see the release of December Retail Sales and PPI data. Empire Manufacturing and Industrial Production will cap off the week on Friday.
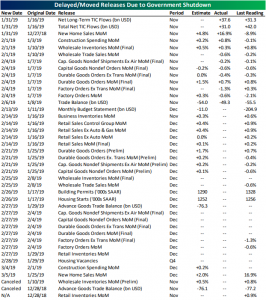
As we have highlighted in previous weeks, one of the areas that the government shutdown threw a wrench in things is in economic data. With postponed data for November and December beginning to roll in, the schedule of some indicators has shifted around to accommodate the late releases. Below is a list of indicators with their new release dates after having been changed to accommodate the shutdown. Except for Business Inventories, all of the November releases are now in. Some Preliminary readings have been canceled, though the final releases are out.
Late Day Rallies
If we could only use one characteristic to describe equity market performance so far in 2019, late day strength may be the most applicable. Heading into Monday, the S&P 500 had been up in the final hour of trading for seven straight days, and over the prior five weeks, the last hour of trading saw positive returns 90% of the time! That kind of late day strength doesn’t occur all that often.
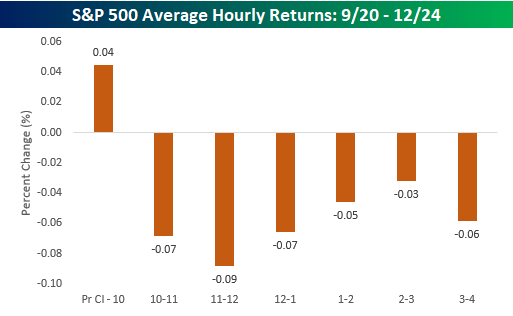
Ever since the S&P 500’s most recent low on December 24th, the intraday trading characteristics of the market have really shifted. The first chart below shows the S&P 500’s average hourly performance during the period from the 9/20/18 high through 12/24. The only time period of the day that saw any strength was the opening half hour. From 10 AM on, though, every other hour of the trading day averaged a decline, with the most weakness coming from 10 AM through 1 PM. The last hour of the trading day wasn’t particularly strong with an average decline of 0.06%.
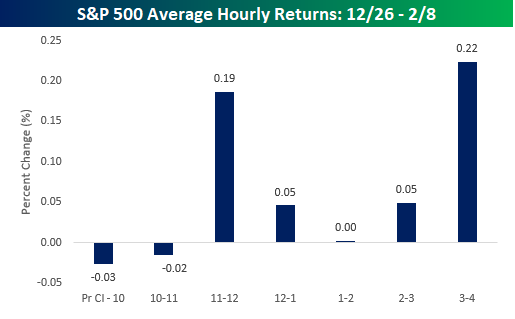
In the period since Christmas Eve, the intraday characteristics of the trading day have been completely upended. During this period, the weakest part of the trading day has been the opening half hour (formerly the strongest), while the strongest part of the trading day has been the last hour with an average change of 0.22%. Behind the last hour of the trading day, the next strongest hourly interval has been the period from 11 – 12, which has averaged a gain of 0.19%. Combined, these two hours of the trading day have accounted for 86% of the S&P 500’s gains since the Christmas Eve low. Moral of the story? If you are a bull these days, don’t take an early lunch and don’t try and cut out early to beat the traffic home!
Trend Analyzer – 2/11/19 – Still On the Edge
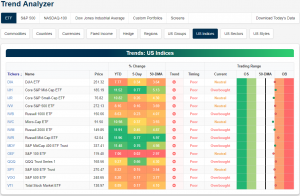
The major index ETFs are starting off the week teetering between neutral and overbought levels. In the first half of last week, this group had been largely overbought, holding onto these levels until selling in the latter half of the week. Fortunately, intraday strength from Friday prevented the year’s first weekly decline and all of the ETFs from leaving overbought territory. Now there are 8 overbought ETFs while the remaining 6 are neutral, and the Russell Mid-cap (IWR) is the only one firmly in overbought territory. Over the past five days, while small for some, each of the members of this group is in fact in the green. The greatest strength continues to come from the mid-caps as the Core S&P Mid-Cap (IJH), Russell Mid-Cap (IWR), and S&P Mid-Cap (MDY) all continue to outperform their peers. These ETFs are now up just under 12% so far this year and over three-quarters of a percent last week alone. This is more than double (or triple for some others) the gains of a majority of their peers over the last week.
With the Nasdaq (QQQ) rising 0.66% last week and the Russell 2000 (IWM) moving 0.45% higher, the next best ETF in the group was the Dow (DIA) only rising 0.34%. Turning to another large cap ETF in the group, the S&P 100 (OEF), it was not only the worst performer last week being essentially flat at 0.02% but it’s also underperforming YTD only rising 7.06%.
Morning Lineup – Drifting Higher to Start the Week
Futures have been drifting up all morning and the S&P 500 is currently on pace to open about 40 basis points higher. Meanwhile, the US Dollar Index is on pace for its 8th straight day of gains as there hasn’t been a down day for the greenback since the Fed’s pivot to a more dovish stance. Chinese equities also returned from the New Year’s holiday with strong gains. Read all about overnight events and this morning’s news in today’s Morning Lineup.
Bespoke Morning Lineup – 2/11/19
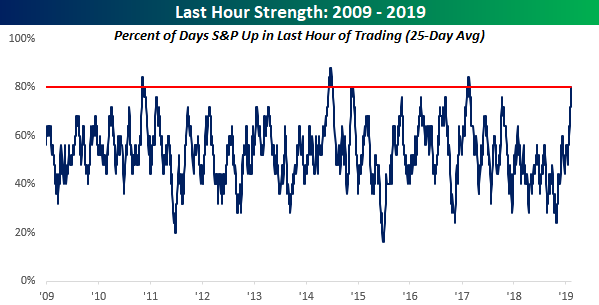
Stocks are set to open in the green this morning, but as anyone following things has no doubt noticed this year, the real action for investors has been during the last hour of trading. The chart below shows the rolling 25-day percentage of days where the S&P 500 was positive in the last hour of the trading day. As of Friday’s close, the percentage ticked up to 80%, which is a level not seen since early 2017. Since 2009, the 80% level is a level that has only been reached or exceeded a few times.

Start a two-week free trial to Bespoke Premium to see today’s full Morning Lineup report. You’ll receive it in your inbox each morning an hour before the open to get your trading day started.

Bespoke Brunch Reads: 2/10/19
Welcome to Bespoke Brunch Reads — a linkfest of the favorite things we read over the past week. The links are mostly market related, but there are some other interesting subjects covered as well. We hope you enjoy the food for thought as a supplement to the research we provide you during the week.
While you’re here, join Bespoke Premium for 3 months for just $95 with our 2019 Annual Outlook special offer.
Investing
Stocks Are Rising on Earnings, and Earnings Aren’t Even That Good by Matt Phillips (NYT)
Without controlling for beats versus misses, S&P 500 stocks have rallied over 1% in the wake of earnings this season, the best result since 2009. [Link; soft paywall]
Jack Bogle Led This Investing Fee War by Elisabeth Kashner (ETF.com)
Another look back at index investing proponent Jack Bogle, and his gift to investors in the form of higher returns not paid to more expensive active managers. [Link]
Politics
Resignations Are Political Acts, Not Moral Ones by Theodore Johnson (Brennan Center for Justice)
A reminder that the calls for resignations in the wake of Virginia Governor Ralph Northam’s blackface scandal are part of an effort to assign cost to racist behavior. [Link]
What Trump talked about in the 2019 State of the Union (Axios)
A gorgeous graphical summary of the President’s last three speeches reporting the State of the Union to Congress, divided up by topic. [Link]
CLO System
Women Claim New Turf on Wall Street by Matt Wirz (WSJ)
The explosive growth of the securitized loan market has been fertile ground for female portfolio managers, with more than 1.5x as large of a share in senior management than the finance industry as a whole. [Link; paywall]
Health “Care”
Bill would require vaccinations amid Northwest measles outbreak (CBS)
Amidst an outbreak of measles that has been attributed to under-vaccination by scientifically illiterate parents, Washington State is proposing expanding requirements for measles-mumps-rubella vaccinations. [Link]
McKinsey Advised Purdue Pharma How to ‘Turbocharge’ Opioid Sales, Lawsuit Says by Michael Forsythe and Walt Bogdanich (NYT)
New legal papers related to ongoing suits against OxyContin makers Perdue shows the role that management consultants played in helping fuel opiate dependence. [Link; soft paywall]
Economic Policy
Fed debating if balance sheet should be regular tool, Daly says (Reuters)
In a speech this Friday, SF Fed President Mary Daly reported that FOMC officials are engaged in discussions about changes the size of the Fed’s balance sheet. [Link]
How Low Interest Rates Can Freeze the Economy by David Harrison (WSJ)
Stepping back from the overdramatic headline, a paper from Liu, Mian, and Sufi argues that one of the costs of lower interest rates is lower productivity. [Link]
The Global Con Hidden in Trump’s Tax Reform Law, Revealed by Brad Setser (NYT)
Another dramatic headline, but underlying it a firm analysis on the failure of promised benefits in the Tax Cuts and Jobs Act, which has actually incentivized further offshoring of profits by US corporations to reduce tax burden. [Link; soft paywall]
Prairie Problems
‘This One Here Is Gonna Kick My Butt’—Farm Belt Bankruptcies Are Soaring by Jesse Newman and Jacob Bunge (WSJ)
With prices for agricultural products low and trade disruptions still significant, US farmers are filing a wave of bankruptcies. [Link; paywall]
Math
How a Strange Grid Reveals Hidden Connections Between Simple Numbers by Corey Brickley (Quanta)
A fascinating rundown of an abstract problem in number theory, with helpful graphical examples and a concise explanation of the details. [Link]
Poop
The Five Families of Feces by David Gauvey Herbert (New Yorker)
A quintessential story about the oligopoly sitting atop the New York market for portable sanitation facilities, full of vibrant characters, intrigue, and all the scatological a-loo-sions you could desire. [Link]
EVs
The 2019 Kia Niro EV Is What Tesla Model 3 Shoppers Should Be Buying by David Vanderwerp (Car and Driver)
A review of Kia’s entry to the mass-market electric vehicle which compares favorably to the more widely acclaimed Tesla Model 3. [Link]
Football
How Belichik crushed McVay and other Super Bowl LIII notes by Ian A. Boyd (Concerning Sports)
A very thoughtful and nuts-and-bolts analysis of both offensive and defensive schemes that the New England Patriots used to stymy the Los Angeles Rams in the Super Bowl. [Link]
Media
The Rise of the Robot Reporter by Jaclyn Peiser (NYT)
While currently relatively limited to sports and finance, automated production of journalistic content is starting to accelerate. [Link; soft paywall]
Social Media
Instagram to hide self-harm images in the wake of rising teen suicides by Ben Kesslen (NBC)
The Facebook subsidiary is working to limit the spread of images featuring self-harm and suicide, which are a niche but potentially extremely harmful subset of what the service helps users share. [Link]
China
Huawei Sting Offers Rare Glimpse of the U.S. Targeting a Chinese Giant by Erik Schatzker (Bloomberg)
Silicon Valley start-ups, corporate espionage, national security, and an FBI sting are intertwined in this story about a US effort to expose the wrongdoing of the Chinese tech giant. [Link]
Read Bespoke’s most actionable market research by joining Bespoke Premium today! Get started here.
Have a great weekend!
The Closer: End of Week Charts — 2/8/19
Looking for deeper insight on global markets and economics? In tonight’s Closer sent to Bespoke clients, we recap weekly price action in major asset classes, update economic surprise index data for major economies, chart the weekly Commitment of Traders report from the CFTC, and provide our normal nightly update on ETF performance, volume and price movers, and the Bespoke Market Timing Model. We also take a look at the trend in various developed market FX markets.

The Closer is one of our most popular reports, and you can sign up for a free trial below to see it!
See tonight’s Closer by starting a two-week free trial to Bespoke Institutional now!
The Bespoke Report — The Resistance!
The S&P 500 finished the week with a slight gain after posting positive returns early in the week and declines late in the week. Friday saw declines early in the day, but investors really stepped up their buying in the afternoon to fully erase what had been a pretty sizable decline. Friday’s late-day strength was a microcosm of the intraday buying trend we’ve seen all year.
As shown in the chart below, the S&P 500 has rallied in the last hour of trading on 80% of trading days over the last five weeks going back to the start of 2019. Readings of 80% or higher have been rare over the last 10 years dating back to the start of the bull market in 2009.
We analyze the importance of late-day strength in this week’s Bespoke Report newsletter. We also cover a number of other technical, fundamental, and sentiment measures in this week’s report. To read the Bespoke Report and also gain access to our full suite of investor tools, start a two-week free trial to one of our three membership levels. You won’t be disappointed!

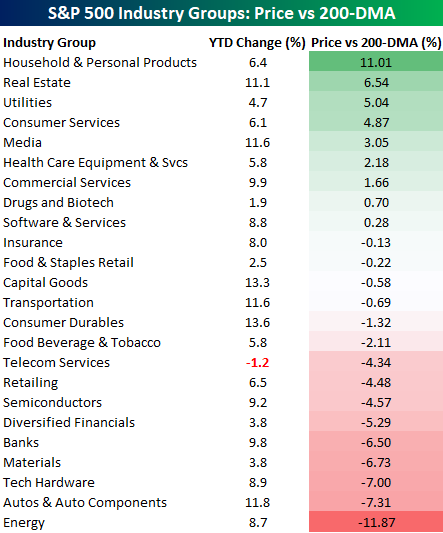
S&P 500 Industry Groups vs 200-DMA
There’s been a lot of discussion regarding the S&P 500’s inability to trade above its 200-DMA after getting close to that level earlier this week.
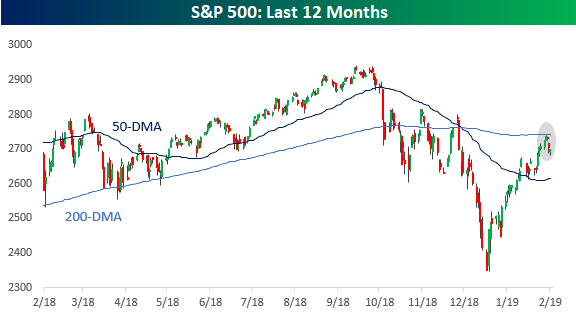
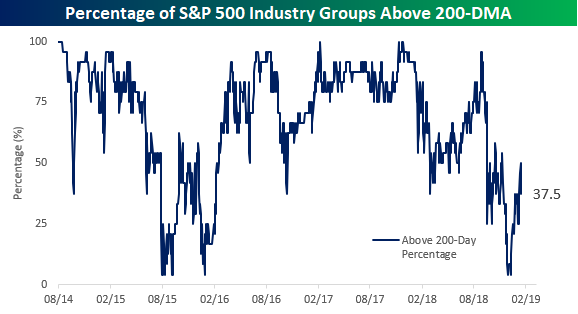
Like the index itself, the majority of the Industry Groups that make up the S&P have also been struggling to retake their 200-DMAs. The chart below shows the historical percentage of Industry Groups above the 200-DMA on a daily basis going back to 2014. Back in early January, this reading cratered all the way down to 4.3% when the only group above its 200-DMA was Household and Personal Products. In the month since then, we have seen the percentage slowly climb higher. While the percentage was close to 50% earlier this week, as the market has declined it also pulled back to the current level of 37.5%. In other words, the market still has a lot of work to do before this reading starts to look healthy again.
The table below shows the YTD performance of each of the 24 S&P 500 Industry Groups along with how far each of them is trading from their 200-DMA. This helps give us an idea of how quickly the percentage above their 200-DMA could theoretically rise or fall. For example, four groups are less than 1% below their 200-DMA, so even a moderate rally in the market could easily push the percentage back above 50%. After that, though, nearly a third of all the groups are still at least 4% below their 200-DMAs, so it’s going to take quite a move to get those groups on the right side. Conversely, only two of the nine Industry Groups above their 200-DMA are less than 1.5% above that level, so even if the market sees a modest sell-off, we aren’t likely to see much of a decline in the percentage trading above their 200-DMA.
So far this year, the rally in equities has been broad-based. The only Industry Group down YTD is Telecom Services, which is down just 1.2%. On the upside, Consumer Durables (13.6%) are leading the gains, but another five Industry Groups are up by over 10%. Not a bad start.