February Employment Report Preview
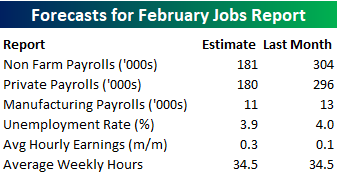
Heading into Friday’s Non-Farm Payrolls (NFP) report for February, economists are expecting an increase in payrolls of 181K, which would be a decline from January’s monster report which came in above expectations at 304K. In the private sector, economists are expecting an increase of 180K, which would imply a similar decline versus January as the headline reading. The unemployment rate is expected to tick back down to 3.9% from last month’s reading of 4.0%. Average hourly earnings are expected to grow at a rate of 0.3% versus the 0.1% reading last month. Higher wage growth is probably not something this market wants to see, but given last month’s weaker than expected reading, a move back to 0.3% would likely not be too problematic. Finally, average weekly hours are expected to be unchanged at 34.5.
Ahead of the report, we just published our eleven-page preview of the February jobs report. This report contains a ton of analysis related to how the equity market has historically reacted to the monthly jobs report, as well as how secondary employment-related indicators we track looked in February. We also include a breakdown of how the initial reading for February typically comes in relative to expectations and how that ranks versus other months.
One topic we cover in each month’s report is the S&P 500 stocks that do best and worst from the open to close on the day of the employment report based on whether or not the report comes in stronger or weaker than expected. In other words, which stocks should you buy, and which should you avoid? The table below highlights the best-performing stocks in the S&P 500 from the open to close on days when the Non-Farm Payrolls report has been better than expected over the last two years.
Of the top performing stocks on days when NFP beats expectations, nine sectors are represented, but Consumer Discretionary leads the way with eight. Mattel (MAT) has been the best performing stock with an average open to close gain of 2.46%, but another seven have seen average open to close gains of more than 1%. In terms of consistency, Cognizant Technology (CTSH) leads the way with open to close gains 85% of the time.
For anyone with more than a passing interest in how equities are impacted by economic data, this February employment report preview is a must-read. To see the report, sign up for a monthly Bespoke Premium membership now!

Chart of the Day: Chinese Stocks Gain Momentum
Fixed Income Weekly – 3/6/19
Searching for ways to better understand the fixed income space or looking for actionable ideals in this asset class? Bespoke’s Fixed Income Weekly provides an update on rates and credit every Wednesday. We start off with a fresh piece of analysis driven by what’s in the headlines or driving the market in a given week. We then provide charts of how US Treasury futures and rates are trading, before moving on to a summary of recent fixed income ETF performance, short-term interest rates including money market funds, and a trade idea. We summarize changes and recent developments for a variety of yield curves (UST, bund, Eurodollar, US breakeven inflation and Bespoke’s Global Yield Curve) before finishing with a review of recent UST yield curve changes, spread changes for major credit products and international bonds, and 1 year return profiles for a cross section of the fixed income world.
In this week’s report we discuss which fixed income asset classes have had the best return over the course of the current equity bull market.

Our Fixed Income Weekly helps investors stay on top of fixed income markets and gain new perspective on the developments in interest rates. You can sign up for a Bespoke research trial below to see this week’s report and everything else Bespoke publishes free for the next two weeks!
Click here and start a 14-day free trial to Bespoke Institutional to see our newest Fixed Income Weekly now!
Back to “MAGA” Caps
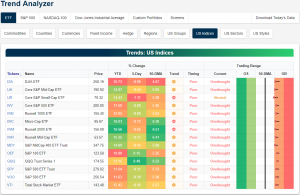
One of the main themes of 2019 has been the outperformance of small-cap stocks relative to large-caps. As with all trends, though, nothing goes in a straight line. That’s what we have seen over the last several trading days as small-cap stocks have started to pull back to a greater degree than their larger cap peers. In this morning’s update of major index ETFs in our Trend Analyzer you can see this as the smaller cap ETFs have all seen the largest declines over the last five trading days while the large caps have eked out some gains.
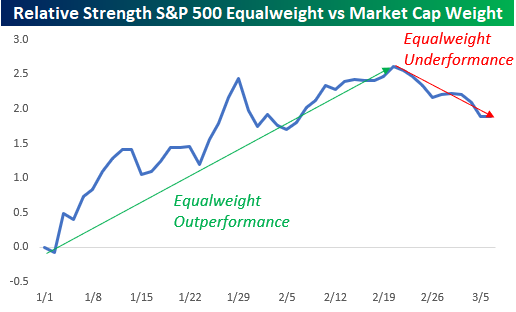
Another way to highlight this trend is to look at the relative strength of the market cap weighted S&P 500 versus its equal-weighted counterpart. From the opening bell of 2019, the equal-weight S&P 500 saw steady outperformance relative to the market cap weighting index indicating that the smaller market cap companies in the S&P were seeing bigger gains than their larger peers. More recently, though, we have seen a pause in that trend, and since 2/20 the market cap weighted index has been steadily outperforming. In fact, in the ten trading days through the close on 3/5, the market cap weighted S&P 500 was up 0.18 while the equal-weighted index was actually down over half of a percent.
To illustrate this another way, the chart below breaks up the S&P 500 into deciles based on market cap and shows the average performance of each decile from the close on 2/20 through 3/5. Of the ten deciles, the only one that has seen positive returns is the decile of the largest stocks (market caps of ~$100 billion or more). Every other decile is down over that period, and the decile that has seen the weakest returns over that period is the decile of stocks with the smallest market caps! Even more noteworthy perhaps is the fact that while 60% of the stocks in the decile with the largest market cap are up during that period, more than 60% of the stocks in the decile with the smallest stocks are down! It’s also not just that investors have plowed into large-cap stocks during this period. They’ve been going for the mega caps. Of the ten largest stocks in the S&P 500, the average gain during this period has been +2.3% and eight of them are up with Berkshire Hathaway (BRK/b) and JP Morgan Chase (JPM) the only decliners. The “MAGA” stocks of Microsoft (MSFT), Amazon (AMZN), Alphabet (GOOGL), and Apple (AAPL) have all rallied more than 2%.

Trend Analyzer – 3/6/19 – Back to Neutral
Another day of declines yesterday—albeit small—has led the major index ETFs to be less overbought once again. After having lost 1.11% over the past week (the worst performer in this time frame), the Core S&P Small-Cap (IJR) is now sitting at neutral; currently, the only one to do so. While all the other index ETFs remain overbought, they are not as firmly overbought as they have been. After spending the better portion of February entirely overbought, at one point almost reaching extreme levels, the group has all fallen off of these extreme readings and are now teetering on neutral. This comes amid broad declines for these indices. Only the S&P 100 (OEF) and Nasdaq (QQQ) have managed to edge out gains over the past five days. And these gains are nothing to write home about both under half a percentage point. Fortunately, on a year to date basis, each ETF is still up over 10%.
Bespoke’s Global Macro Dashboard — 3/6/19
Bespoke’s Global Macro Dashboard is a high-level summary of 22 major economies from around the world. For each country, we provide charts of local equity market prices, relative performance versus global equities, price to earnings ratios, dividend yields, economic growth, unemployment, retail sales and industrial production growth, inflation, money supply, spot FX performance versus the dollar, policy rate, and ten year local government bond yield interest rates. The report is intended as a tool for both reference and idea generation. It’s clients’ first stop for basic background info on how a given economy is performing, and what issues are driving the narrative for that economy. The dashboard helps you get up to speed on and keep track of the basics for the most important economies around the world, informing starting points for further research and risk management. It’s published weekly every Wednesday at the Bespoke Institutional membership level.
You can access our Global Macro Dashboard by starting a 14-day free trial to Bespoke Institutional now!

Morning Lineup – Tell Us Something We Don’t Know
ADP Private Payrolls for February were just released and came in slightly weaker than expected at 183K versus estimates for a reading of 190K. Futures are indicated modestly lower but are near their overnight highs, while oil is down and the dollar is on pace for its 6th straight positive day. Read all about everything driving the markets in today’s Morning Lineup.
Bespoke Morning Lineup – 3/6/19
One of the events getting some headlines this morning is the fact that the OECD has lowered global growth forecasts for both 2019 and 2020. Reasons behind the downgrade include trade disputes and uncertainty over Brexit. Is this really newsworthy? After all, it’s not as if any of these headwinds are anything new. The fact is that economic data around the world has been underwhelming for some time now. Check out the chart below of the Citi Economic Surprise Index for G10 economies. At a level of -34.10, it is currently just off what were its worst levels since 2012.

Start a two-week free trial to Bespoke Premium to see today’s full Morning Lineup report. You’ll receive it in your inbox each morning an hour before the open to get your trading day started.

The Closer — Markets Pause, Global Credit Growth Slows, New Home Sales Bounce — 3/5/19
Log-in here if you’re a member with access to the Closer.
Looking for deeper insight on markets? In tonight’s Closer sent to Bespoke Institutional clients, on a quiet day in macro data, we make note of the broken uptrends given the recent pause in stocks and high yield credit. We then take a look at the lack of movement in the VIX and breadth in Europe. Turning to macro data, we analyze the Bank of International Settlements (BIS) quarterly credit data which showed significant slowing. We finish with a look at today’s New Home Sales report which beat estimates giving a bit more of an optimistic tone to housing.

See today’s post-market Closer and everything else Bespoke publishes by starting a 14-day free trial to Bespoke Institutional today!
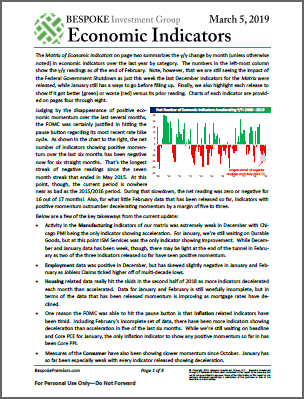
Bespoke’s Matrix of Economic Indicators: 3/5/19
Our Matrix of Economic Indicators is the perfect summary analysis of the US economy. We combine trends across the dozens and dozens of economic indicators in various categories like manufacturing, employment, housing, the consumer, and inflation to provide a directional overview of the economy.
To access our newest Matrix of Economic Indicators, start a two-week free trial to either Bespoke Premium or Bespoke Institutional now!
Bespoke’s Consumer Pulse Report — February 2019
Bespoke’s Consumer Pulse Report is an analysis of a huge consumer survey that we run each month. Our goal with this survey is to track trends across the economic and financial landscape in the US. Using the results from our proprietary monthly survey, we dissect and analyze all of the data and publish the Consumer Pulse Report, which we sell access to on a subscription basis. Sign up for a 30-day free trial to our Bespoke Consumer Pulse subscription service. With a trial, you’ll get coverage of consumer electronics, social media, streaming media, retail, autos, and much more. The report also has numerous proprietary US economic data points that are extremely timely and useful for investors.
We’ve just released our most recent monthly report to Pulse subscribers, and it’s definitely worth the read if you’re curious about the health of the consumer in the current market environment. Start a 30-day free trial for a full breakdown of all of our proprietary Pulse economic indicators.
