Bespoke Morning Lineup — An “Everything Red” Morning
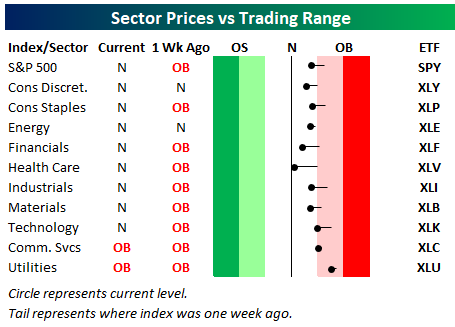
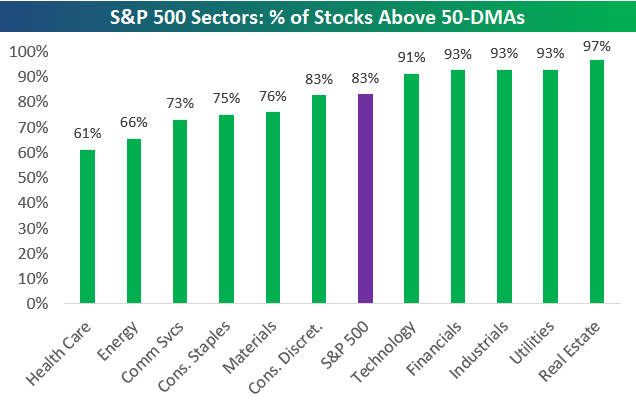
Declines over the last week or so have moved all but two S&P 500 sectors back into neutral territory from what had been pretty extreme overbought levels. No sector has yet to move below its 50-day moving average, but Health Care is sitting the closest to its 50-DMA at the moment.. For a full recap of the morning’s news and market activity, read today’s Bespoke Morning Lineup.
Bespoke Morning Lineup – 3/8/19
Start a two-week free trial to Bespoke Premium to see today’s full Morning Lineup report. You’ll receive it in your inbox each morning an hour before the open to get your trading day started.

The Closer — The Keep It Simple Stupid Market — 3/7/19
Log-in here if you’re a member with access to the Closer.
Looking for deeper insight on markets? In tonight’s Closer sent to Bespoke Institutional clients, as the S&P 500 sharply rejects resistance from Q4 highs, falling below the 200-DMA, we provide an update on the technicals of the index in addition to 10-year treasury yields and our EMFX Index. Next, we move on to cover the inversion of the term structure of the VIX curve. In economic data, we recap today’s release of quarterly productivity and labor costs data and provide some insight to the current cycle’s soft wage growth. We finish tonight’s note with an in depth look at the release of the Fed’s quarterly Z.1 report.

See today’s post-market Closer and everything else Bespoke publishes by starting a 14-day free trial to Bespoke Institutional today!
B.I.G. Tips – Smart Money Hesitates at Recent Highs
We discuss the trends of the so-called ‘smart’ and ‘dumb’ money quite often. For those unfamiliar with the terms, “dumb money” is considered to be the more reactive traders/investors who trade based on the headlines right at the open. Conversely, the more thoughtful “smart money” waits for things to shake out before acting. To track the sentiment of each group, we consider the dumb money to be the market’s action during the first half hour of the trading day, while the last hour of the trading day is representative of the smart money. The action of the smart and dumb money over the last 12 months has definitely been intriguing, and we analyze these trends in a report that was just published for Premium members. Find out what the “smart money” has been doing recently as the market has stalled out a bit.
To gain access to the report, please start a two-week free trial to our Bespoke Premium package now. Here’s a breakdown of the products you’ll receive.
Individual Investors Reach Resistance
As the S&P 500 has stalled out near late 2018 highs, sentiment readings have moved pretty much in line with what could be expected. Bullish sentiment has fallen off of its multi-month high of 41.63% reached last week. This week, bullish sentiment as seen through the AAII individual investor survey came in at 37.39%. This drop is nothing too dramatic as it brings the percentage of optimistic investors just below the historical average of the survey of 38.5%. It is also still near the upper end of the range it has been in for the past year.

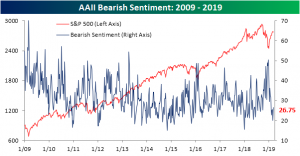
Bears have taken all of the gains from declines in neutral and bullish sentiment. Bearish sentiment rose this week to 26.75% off of 52-week lows of 20% from last week. Like bullish sentiment, while this is a solid increase it does not necessarily leave the sentiment level at any sort of extreme. At its current levels, it is under 4% away from its historical average. With that said, it remains low relative to where it had been for the latter half of 2018.
As previously mentioned, neutral sentiment fell this week by 2.5% down to 35.87%. Neutral sentiment has worked its way up since the market put in its bottom. Despite this week’s decline, it is still at fairly elevated levels. Given these readings, individual investors seem to be showing some signs of hesitation as the market reaches resistance, but at the same time, are not expressing outright bearishness at these levels.
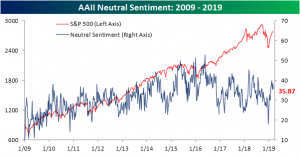
Chart of the Day: Floor & Decor Set To Soar
Jobless Claims Improve Again
After a string of semi-concerning prints, this morning’s release of the Department of Labor’s weekly Initial Jobless Claims is offering a sigh of relief coming in below forecasts and below last week’s reading. On a seasonally adjusted basis, claims came in at 223K. That is 2K below estimates of 225K and below last week’s revised 226K. At 223K, the indicator still remains in the dead middle of the range it has been in for the past few months. While there has not been progress in claims making moves to new lows for some time now, by this account the labor market still appears to be healthy. The streak of claims coming in under 300K has now grown to 209 consecutive weeks.
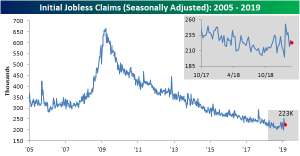
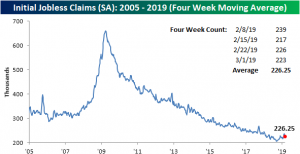
The four-week moving average for jobless claims also fell this week to 226.25K from 229.25K last week. It has now been two weeks since the indicator last saw a 52-week high. If that trend keeps up it will certainly be a reassuring sign that the labor market is not changing course. Looking ahead to next week, with a high of 239K coming off, another print consistent with the past few weeks would lead the average lower.
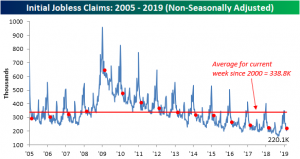
Finally, turning to the non-seasonally adjusted data, claims rose this week to 203.1K. That 17K increase from last week is right in line with seasonal patterns. The NSA number also came in well below the average for the current week of the year since 2000, 338.8K, and as the lowest reading for the week of the current cycle.
Bespoke’s Sector Snapshot — 3/7/19
We’ve just released our weekly Sector Snapshot report (see a sample here) for Bespoke Premium and Bespoke Institutional members. Please log-in here to view the report if you’re already a member. If you’re not yet a subscriber and would like to see the report, please start a two-week free trial to Bespoke Premium now.
In this week’s Sector Snapshot, we highlight real weakness that we’re seeing in a couple of sectors that had been market leaders prior to 2019. We also focus on the dip into negative territory for the 10-day advance/decline line that we saw yesterday, which broke a streak of 39 trading days with positive A/D line readings.
To gain access to the report, please start a two-week free trial to our Bespoke Premium package now. Here’s a breakdown of the products you’ll receive.
Trend Analyzer – 3/7/19 – Major Shifts
This morning, on the back of multiple days of declines, there are two notable changes in our Trend Analyzer tool. For starters, as we have repeatedly made note of in the past week, there have been fewer and fewer major index ETFs in downtrends. In spite of recent declines, a few more moved out of their downtrends yesterday. That leaves us with only the Micro-Cap ETF (IWC) still in a downtrend. Every other index ETF has left their downtrend and is currently trending sideways.
The other major shift is the vast majority of these ETFs have now moved out of overbought territory and into neutral as a result of selling pressure over the past few sessions. Currently, there are only two ETFs—the S&P 100 (OEF) and Nasdaq (QQQ)—that remain overbought. The reason for this being these two have been the best performers over the past week. Given the current market wide sell-off over the past several days, being the best performers does not necessarily mean they are in the green. Both are lower than five days prior but to a much lesser of an extent than their peers. Not a single index ETF has managed to see gains over the past week with losses ranging from very small (0.02% for QQQ) to over 3.5% (IWC). Small caps have really been hit the hardest during this pullback.

Bespoke Morning Lineup — 3/7/18
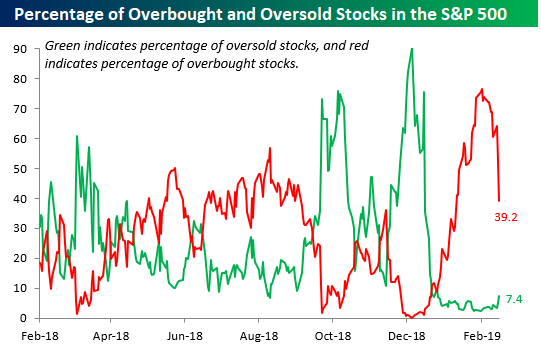
Futures have been bouncing around the flat-line this morning ahead of the weekly initial jobless claims report. We continue to see downside mean reversion as overbought conditions get worked off. You can see this mean reversion in our chart of the percentage of overbought and oversold stocks in the S&P 500 below. For a full recap of the morning’s news and market activity, read today’s Bespoke Morning Lineup.
Bespoke Morning Lineup – 3/7/19
Start a two-week free trial to Bespoke Premium to see today’s full Morning Lineup report. You’ll receive it in your inbox each morning an hour before the open to get your trading day started.
The Closer — Small Cap Collapse, Trade Tango, Oil Flow, Fund Flow Lapse — 3/6/19
Log-in here if you’re a member with access to the Closer.
Looking for deeper insight on markets? In tonight’s Closer sent to Bespoke Institutional clients, we begin with a note on the recent weakness of small caps after they saw their worst day of the year today. Next, we turn to US Census data on the December trade balance which showed a decade high deficit in 2018. We take an in depth look as to the causes of this deficit before finishing with our weekly looks at EIA petroleum data and ICI’s mutual fund flows.
See today’s post-market Closer and everything else Bespoke publishes by starting a 14-day free trial to Bespoke Institutional today!