Chart of the Day: Utilities Sector Valuation Gets Charged
Initial Jobless Claims Up Again
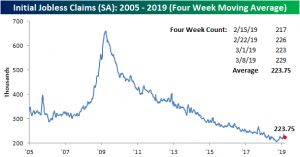
Initial Jobless Claims came in 4K above expectations at 229K on a seasonally adjusted basis; up from last week’s 223K. This is near the upper end of the range jobless claims have been in for the past few months. It has also now been two months since claims last hit a new low of 200K. On the other hand, this week marks the 210th week that claims have come in below 300K. So while perhaps the strength of the labor market could be taking a breather, by all means, it still appears healthy.

For the third week in a row, the four-week moving average of the seasonally adjusted data has declined; falling to 223.75K from 226.25K last week. It has also now been three weeks since claims last hit a 52-week high. Though more 52-week highs are certainly not out of the realm of possibilities in the near future, this improvement seems to point to these highs from the beginning of February being more consistent with random spikes that have been observed in the past rather than a new trend. An additional note now looking back at February jobs data as a whole, with all of the data for the month in—namely last week’s abysmal Nonfarm Payrolls report showing only a gain of 20K—the labor market has seemed to calm down in the tail end of the month, and conditions seem to have improved slightly from the rough first couple of weeks in February.
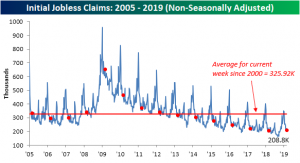
On a non-seasonally adjusted basis, claims fell this week consistent with seasonal tendencies. Declining 11.8K to 208.8K this week, the non-seasonally adjusted number came in far below the average of 325.9K for the current week of the year since 2000. Also while it is near cycle lows, the same week last year actually saw a lower number of 204.9K. Since the start of the year, there already has been five times that the non-seasonally adjusted claims number has come in worse than the prior year. That compares to only twice that it had happened in 2018 and seven times in 2017. So while still very healthy, going forward labor markets are certainly showing signs of losing momentum.
Morning Lineup – YTD Lows for the VIX
After a few quiet days outside of Boeing and Brexit to kick off the week, the flow of news is a bit more active this morning. Positive sentiment in equity futures has quickly worn off this morning as headlines indicate that the US and China have put off a planned meeting between President Trump and President XI later this month. The meeting now won’t occur until April at least. Sticking points like the treatment of intellectual property remain unresolved. The delay shouldn’t be entirely surprising given the President’s comments just yesterday that he was in no rush to sign a deal.
In economic data, Import and Export Prices rose more than expected, as was also the case with Jobless Claims. One stock to note, though, is GE. While the company lowered guidance earlier (no surprise there), it has actually erased earlier losses and is now positive.
Please click the link below to read today’s Bespoke Morning Lineup.
Bespoke Morning Lineup – 3/14/19
It shouldn’t come as much of a surprise given the market’s strength of late, but sometimes you need a chart to make it hit home. Volatility has once again sunken like a stone this year as the VIX dropped below 14 again this week and just this morning traded down to its lowest level since October 5th.

Start a two-week free trial to Bespoke Premium to see today’s full Morning Lineup report. You’ll receive it in your inbox each morning an hour before the open to get your trading day started.

The Closer — Market Gains Continue, Earnings Update, BRIC Strength — 3/13/19
Log-in here if you’re a member with access to the Closer.
Looking for deeper insight on markets? In tonight’s Closer sent to Bespoke Institutional clients, we discuss a number of reasons why the BRIC countries look bullish, including nice upside momentum versus the rest of the world. We also discuss bullish US equity market internals, recent earnings strength, and positive intraday market action.

See today’s post-market Closer and everything else Bespoke publishes by starting a 14-day free trial to Bespoke Institutional today!
Chart of the Day: New High For the DJIA Cumulative A/D Line
Boeing Still on Top of the DJIA
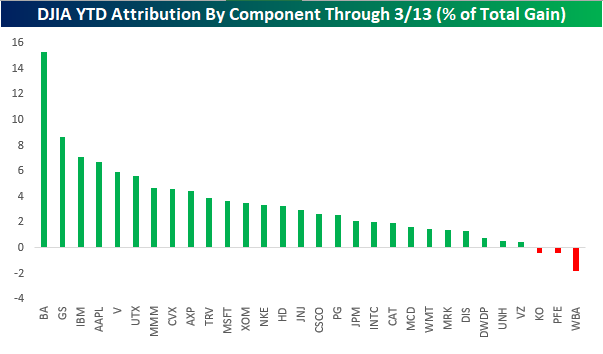
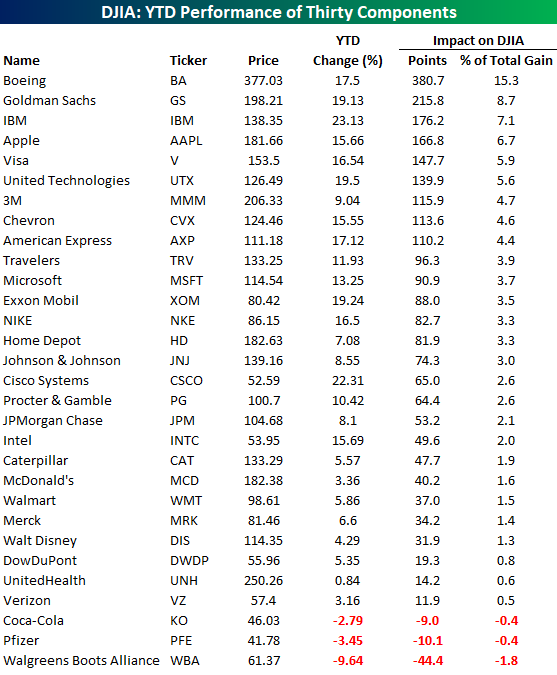
To say it has been a tough couple of days for anyone connected to Boeing (BA) would be an understatement. In terms of the company’s stock, the last two days have seen the first back to back declines of 5%+ in close to a decade (June 2009). As a result of this week’s decline, BA has lost its perch at the top of the DJIA in terms of best performers YTD, now coming in at number six. That being said, the stock is still up over 17% on the year, and because of the DJIA’s unique way of weighting components by their share price rather than market cap, BA has still been the largest contributor to the DJIA’s YTD gains. Even more amazing? It’s still not even close.
The chart below shows the YTD attribution of each of the DJIA’s 30 components to the index’s total gain YTD. Accounting for still more than 15% of the DJIA’s YTD gain, BA has had nearly twice the YTD impact on the DJIA so far this year as the next closest stock (Goldman Sachs – +8.7%). The fact that BA still has had such an outsized impact on the DJIA even after its big decline this week shows not only how extreme its move higher to kick off the year was, but also how odd it is to weight a stock index by an arbitrary measure like each component’s share price. One final note — it was somewhat ironic to see that the one stock that has had the most negative impact on the DJIA YTD is also the index’s newest component: Walgreen’s Boots Alliance (WBA) added last June.
![]()
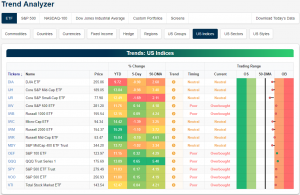
Trend Analyzer – 3/13/19 – Half and Half
Coming off of declines last week, equities have performed much better in the first half of this week. Currently, half of the major index ETFs have erased last week’s losses and moved back into overbought territory. Meanwhile, the other half which is predominantly small and mid-caps, in addition to the Dow thanks to Boeing, are still in the red. This half remains in neutral territory whereas most had been overbought this time last week. Despite some of these ETFs having managed to recoup losses from the past week, small and mid-caps still have a little ways to go until they do the same. Each of these are still down over 1% with the Core S&P Small Cap (IJR) down the most at 1.69%. Even with this recent pullback, small and mid-caps remain some of the best performing indices so far in 2019.
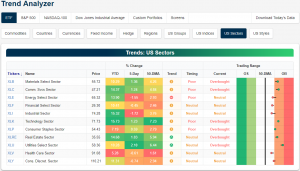
Taking a look by sector, it is just about the same story. Of the eleven sectors, six are now overbought while the remaining five are neutral. In the same way that those with a loss over the past week are still neutral, the others that have edged out gains have pushed deeper into overbought territory. As we mentioned in last night’s Closer, the Utilities sector is of particular interest. The sector’s Water, Multi, and Electric industries are the closest to their respective 52-week highs. Utilities is currently the most overbought approaching extreme levels (2 standard deviations or more above the 50-DMA). Over the past week it has gained the most at 2.1%, while on a YTD basis, the sector’s gains have been more middling. Conversely, the weakness in the Health Care sector ETF should be addressed as it is up only 5.28%; far worse than its peers.
Morning Lineup – Positive Bias in a Quiet Tape
Besides Brexit and Boeing again today, there really isn’t a lot going on in markets this morning. US futures are indicated modestly higher, and Boeing is trading down again. The stock is off its lows, though, as it attempts to bounce back from its first back to back declines of 5%+ in nearly a decade.
Please click the link below to read today’s Bespoke Morning Lineup.
Bespoke Morning Lineup – 3/13/19
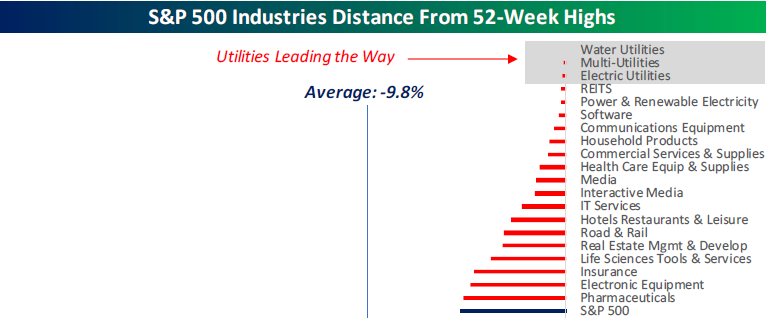
After bouncing back nicely from its early lows on Friday, the S&P 500 is currently less than 5% from its September all-time high, while the 60+ industries in the index are down an average of close to 10%. What’s most surprising about where individual groups stand relative to their highs, though, is that the groups at the top are all Utilities. As shown below, Water, Multi, and Electric Utilities all hit 52-week highs yesterday and closed out the session less than 1% from those highs.
Start a two-week free trial to Bespoke Premium to see today’s full Morning Lineup report. You’ll receive it in your inbox each morning an hour before the open to get your trading day started.
The Closer — Boeing in the Penalty Box, Utilities Lead, Miners Bounce, Labor Bites — 3/12/19
Log-in here if you’re a member with access to the Closer.
Looking for deeper insight on markets? In tonight’s Closer sent to Bespoke Institutional clients, we provide a recap of today’s rejection of the Brexit deal and the continued turbulence in Boeing (BA). Next, we break down the S&P 500 industries distance from their 52-week highs. We note that the three industries closest to their 52-week highs are all Utilities. On the other hand, we look at Metals and Mining which currently sits the furthest from its highs, though, we show why the industry is not necessarily unattractive. We finish with a look at today’s release of NFIB Small Business Optimism and CPI.

See today’s post-market Closer and everything else Bespoke publishes by starting a 14-day free trial to Bespoke Institutional today!