The Closer: End of Week Charts — 3/15/19
Looking for deeper insight on global markets and economics? In tonight’s Closer sent to Bespoke clients, we recap weekly price action in major asset classes, update economic surprise index data for major economies, chart the weekly Commitment of Traders report from the CFTC, and provide our normal nightly update on ETF performance, volume and price movers, and the Bespoke Market Timing Model. We also take a look at the trend in various developed market FX markets.

The Closer is one of our most popular reports, and you can sign up for a free trial below to see it!
See tonight’s Closer by starting a two-week free trial to Bespoke Institutional now!
The Most Loved Stocks in the S&P 500
Earlier this week we provided a full update on analyst sentiment across sectors and individual stocks in our Closer report. Below are a few charts and tables that we’ve pulled from the big report in case you’re interested.
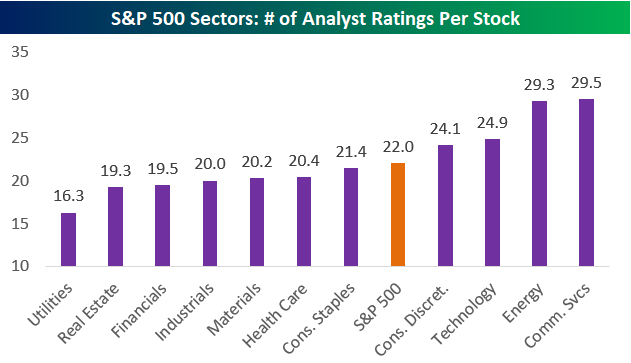
As shown below, there are 22 analyst ratings per stock in the S&P 500 on average. But Energy and Communication Services have more than 29 ratings per stock! It’s hard to find an edge with nearly 30 analysts covering a name.
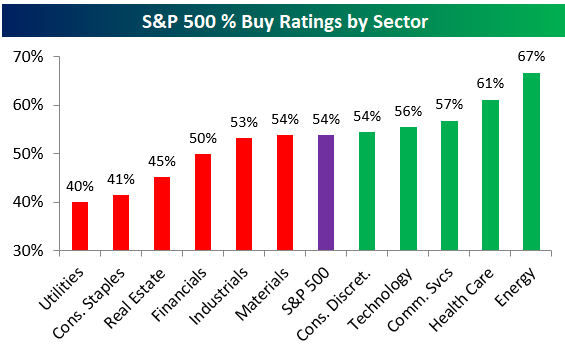
Notably, the Energy sector also has the highest percentage of analyst Buy ratings, which is surprising given that Energy has been the weakest sector of the market since the S&P peaked last September. It looks like analysts think the sell-off for Energy has caused valuations to become more attractive.
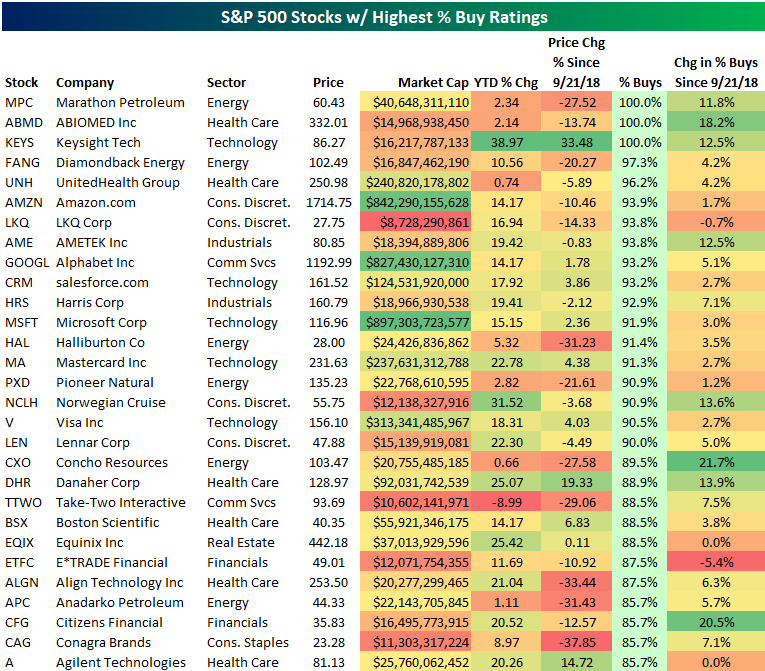
Below is a table listing the S&P 500 stocks with the highest percentage of Buy ratings right now. There are 3 stocks in the index that have 100% Buy ratings — Marathon Petroleum (MPC), ABIOMED (ABMD), and Keysight Tech (KEYS). Both MPC and ABMD are basically flat this year, but KEYS is up 39% YTD. Even after the gains, though, analysts still love KEYS.
Other notables on the list of most loved stocks include mega-caps like Amazon.com (AMZN) with 93.9% Buy ratings, Alphabet (GOOGL) with 93.2% Buy ratings, and Microsoft (MSFT) with 91.9% Buy ratings. Diamondback Energy (FANG) is the most loved Energy sector stock, while AMETEK (AME) is the most loved Industrials stock.
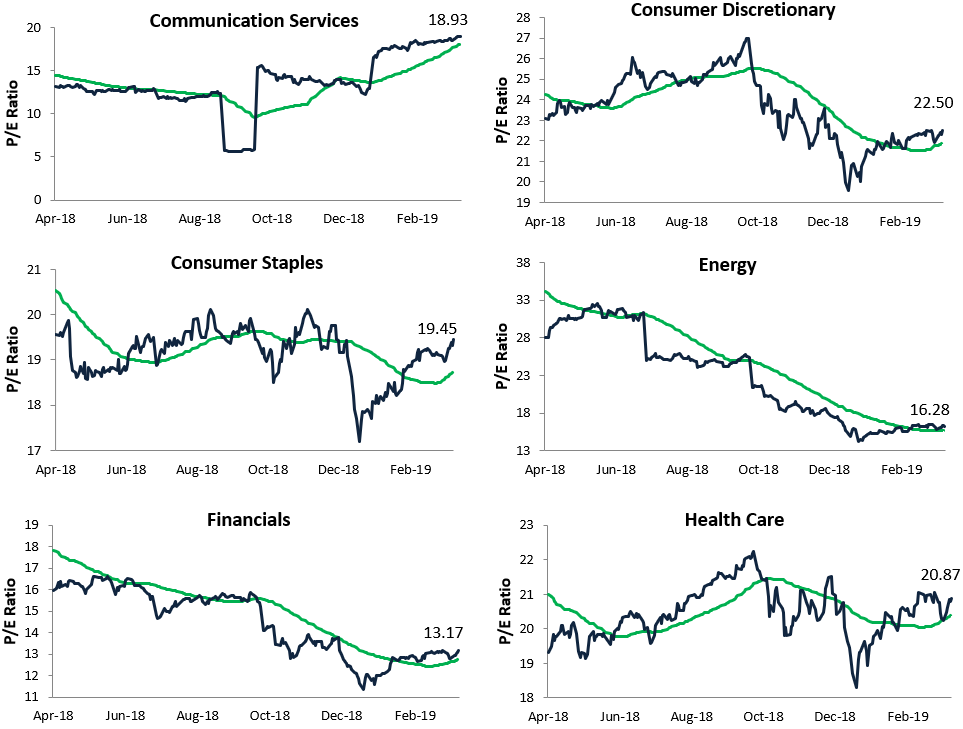
S&P 500 Sector Trailing 12-Month P/E Ratios
The S&P 500’s trailing 12-month P/E ratio got down into the low 15s at the bottom in late December, but we’ve seen huge P/E expansion as the market has rallied back. As of this afternoon, the S&P’s trailing 12-month P/E sits at 18.61. Even still, that’s well below readings in the 20s that were seen for a number of weeks in 2018.

Below we show one-year P/E ratio charts for major S&P 500 sectors. Since the December lows, we’ve seen P/E expansion in every sector, but the one that stands out the most is Utilities.
We went into detail on extended valuations for the Utilities sector in yesterday’s Chart of the Day for members, but you can see the spike up to 19.80 in the one-year chart for Utilities below. At 19.80, only Technology, Health Care, and Consumer Discretionary have higher trailing 12-month P/E ratios than Utilities right now.

Key Test for S&P 500 Coming Down to the Wire
This morning prior to the open, we noted that the S&P needed to gain roughly 50 basis points today to eclipse key resistance in the 2,815-2,820 range. As of early afternoon trading, the bulls have indeed pushed the index above this resistance level. But with the S&P trending slightly lower so far in afternoon trading, it’s going to come down to the wire. With 90 minutes left in the trading day, the S&P is currently trading at 2,824 — up 55 basis points. Today is certainly a day where investors would like to see last hour strength!
Morning Lineup – Strong End to a Strong Week
Global equities are finishing the week on a positive note and capping off what has been a very strong week. Chinese equities regained their footing after two days of 1% declines, and Europe is up across the board. Will this be the day that the S&P 500 can finally really break out of its range in the low 2,800s?
Please click the link below to read today’s Bespoke Morning Lineup.
Bespoke Morning Lineup – 3/15/19
With equities rallying around the globe, you would think that interest rates would be rising as risk looks to be coming off the sidelines. Not this week. US 10-year yields are on pace to finish the week right where they started, and the yield curve is below 20 basis points for the fourth straight day, which is a streak that hasn’t been seen at all in this cycle.

Start a two-week free trial to Bespoke Premium to see today’s full Morning Lineup report. You’ll receive it in your inbox each morning an hour before the open to get your trading day started.

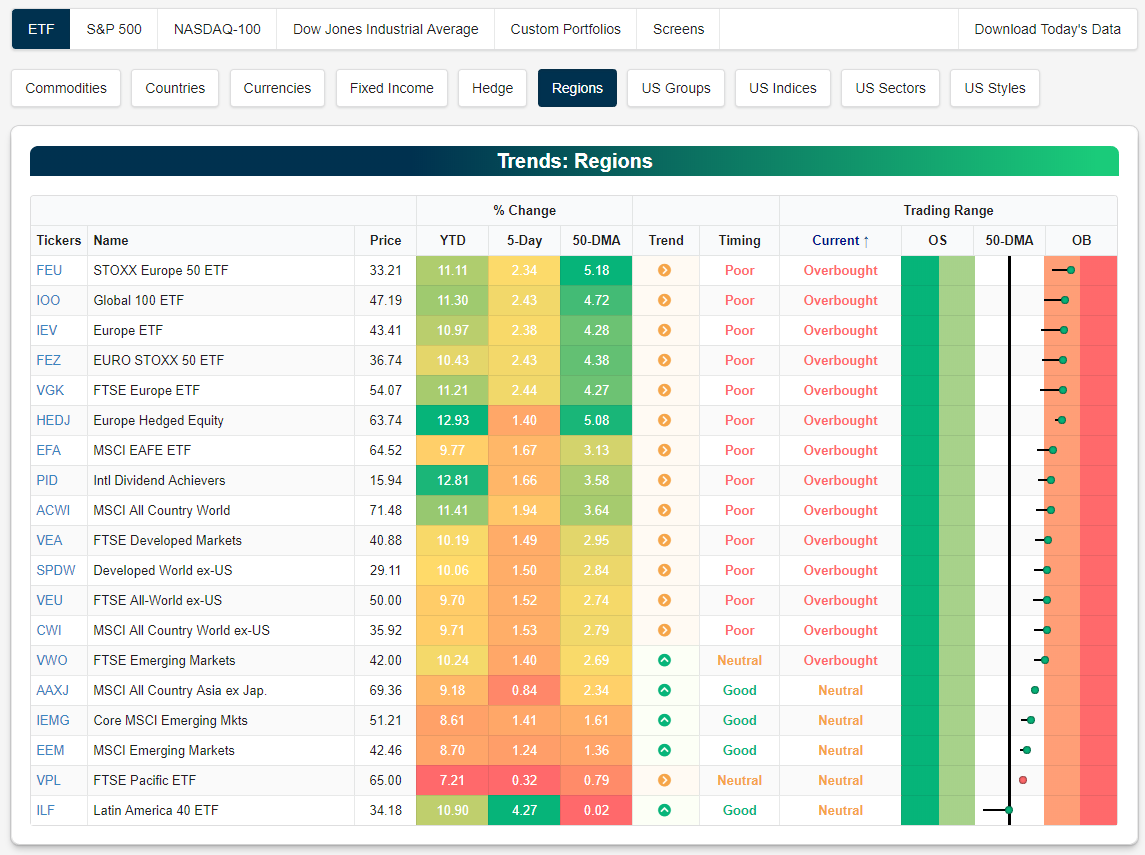
All Regional Equity ETFs Back Above 50-DMAs
Below is a snapshot of regional ETFs from our Trend Analyzer tool. We’re highlighting this snapshot this morning because every single ETF in this group has moved back above its 50-day moving average, indicating broad participation from equity markets around the world.
The Euro STOXX 50 ETF (FEU) is now the most overbought of the group at nearly two standard deviations above its 50-day moving average. The Global 100 ETF (IOO) is second-most overbought, followed by the Europe ETF (IEV).
Note that the snapshot below is pulled directly from the Tools section of our membership area. You can start using all of Bespoke’s helpful trading tools by starting a 2-month free trial to Bespoke Interactive today.
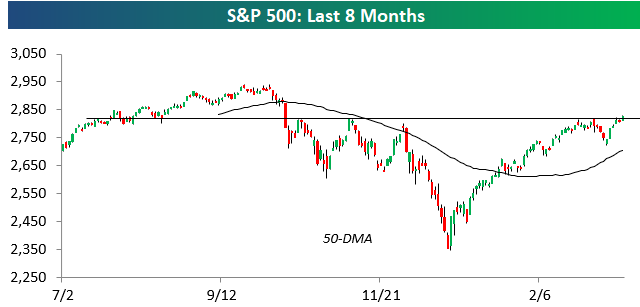
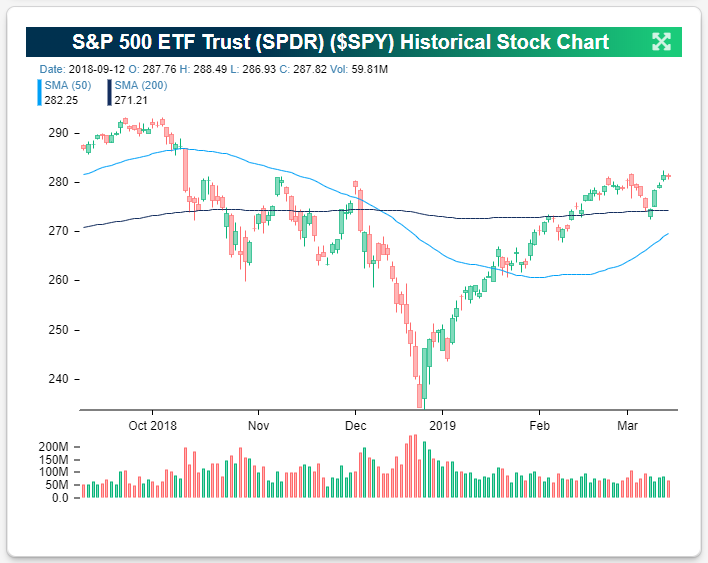
S&P 500 (SPY) Ending Week at Key Resistance Point
The S&P 500 has managed to close above 2,800 this week and make a new 2019 high, but the index is still dealing with resistance between 2,815-2,820. As shown in the charts for SPY below, this is an area that the index has tested (and failed) five times already over the last six months. It would be a fitting end to what has been a strong week for US equities if the S&P could finally break through resistance today. All it will take to push through is a gain of roughly 50 basis points today. Happy Friday trading!
Note that the charts below are pulled directly from the Tools section of our membership area. You can start using all of Bespoke’s helpful trading tools by starting a 2-month free trial to Bespoke Interactive today.

The Closer — Treading Water, Shorts Sinking, Claims Floating, Fund Flow Flailing — 3/14/19
Log-in here if you’re a member with access to the Closer.
Looking for deeper insight on markets? In tonight’s Closer sent to Bespoke Institutional clients, we begin with a note on small cap’s drastic underperformance so far this month. As the VIX reached a 100-day low yesterday and again today, we show the returns of the S&P 500 following other times that the VIX has seen these kinds of movements. Next, we highlight an interesting trend in Initial Jobless Claims so far this cycle as the indicator shows some signs of slowing momentum. Staying on the topic of labor markets, we also show the pickup in Continuing Claims which, like Initial Claims, are turning yellow. We finish with a brief look at investors hesitation to reenter equities based on fund flows into mutual funds and ETFs.

See today’s post-market Closer and everything else Bespoke publishes by starting a 14-day free trial to Bespoke Institutional today!
Less Optimism Among Individual Investors
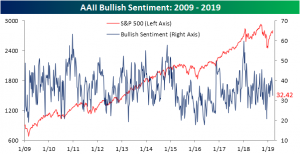
Bullish sentiment as seen through AAII’s weekly survey of individual investors released this morning showed another drop in bullish sentiment. This comes following the first weekly decline that equities have seen so far in 2019. The percentage of investors expressing optimism dropped to 32.42% from 37.39% last week. The week prior to that was a recent high, and the highest since early November, at 41.63%. Given this week’s strong rally so far, it would not be surprising if bullish sentiment picks back up again in next week’s survey.
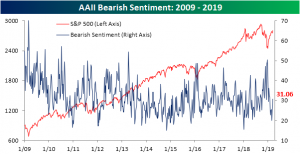
Conversely, bearish sentiment rose to its highest level since the final days of January coming in at 31.06% versus 26.75% last week. Bearish sentiment has come well off of its lows of 20% only a couple of weeks ago. Where it currently sits is much more in line with its historic average of 30.5%.
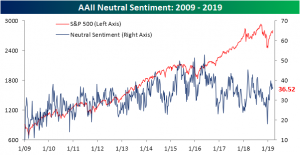
Meanwhile, neutral sentiment (investors not predicting any change in the stock market) moved slightly higher to 36.52% after dropping to 35.87% last week. Unlike bullish and bearish sentiment which have seen a degree of mean reversion, neutral sentiment has remained fairly elevated for most of the new year. Seems to make sense that investors largely report neutral sentiment as Q4 highs continue to be stiff resistance.
Bespoke’s Sector Snapshot — 3/14/19
We’ve just released our weekly Sector Snapshot report (see a sample here) for Bespoke Premium and Bespoke Institutional members. Please log-in here to view the report if you’re already a member. If you’re not yet a subscriber and would like to see the report, please start a two-week free trial to Bespoke Premium now.
In this week’s Sector Snapshot, we update breadth and valuation levels for the S&P’s major sectors. We take a look at Tech’s move back into the #1 slot in terms of YTD performance and discuss why we think the Financial sector is looking more bullish.
To gain access to the report, please start a two-week free trial to our Bespoke Premium package now. Here’s a breakdown of the products you’ll receive.