The Bespoke Report — We Have Inversion!
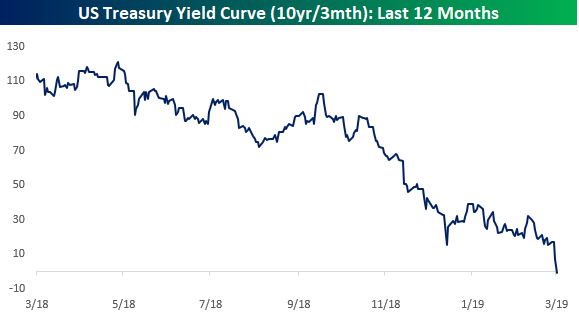
After nice gains over the past week and a half, the S&P 500 fell sharply on Friday as the yield curve inverted for the first time in more than 3,000 days. You can see the dip into negative territory in the chart below:
Along with a recap of all of this week’s economic data and major market events, we also provide an updated take on our market view. We cover everything you need to know as an investor in this week’s Bespoke Report newsletter. To read the Bespoke Report and access everything else Bespoke’s research platform has to offer, start a two-week free trial to one of our three membership levels. You won’t be disappointed!

The Closer: End of Week Charts — 3/22/19
Looking for deeper insight on global markets and economics? In tonight’s Closer sent to Bespoke clients, we recap weekly price action in major asset classes, update economic surprise index data for major economies, chart the weekly Commitment of Traders report from the CFTC, and provide our normal nightly update on ETF performance, volume and price movers, and the Bespoke Market Timing Model. We also take a look at the trend in various developed market FX markets.

The Closer is one of our most popular reports, and you can sign up for a free trial below to see it!
See tonight’s Closer by starting a two-week free trial to Bespoke Institutional now!
Russell Falls Apart
While the rest of the market was rallying and holding up, the Russell has been struggling for close to a month now. After peaking above its 50-DMA back on 2/25, the Russell has had a hard time holding onto any gains lately. Earlier this week it made a lower high when the rest of the market was making higher highs, and to close out the week, it declined 3.6% for its worst day of 2019, making a lower low. Not a pretty chart at all.

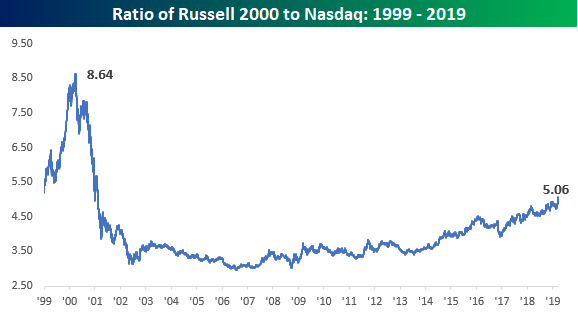
The Russell’s underperformance can really be seen in the ratio of the Nasdaq to the Russell 2000. This week, the ratio between the two really become unglued, topping 5 for the first time since February 2001.

On a longer-term basis, the only time the Nasdaq has been outperforming the Russell 2000 by such a wide margin was during the period from November 1998 through February 2001. And if you think the ratio is extreme now, during that period it got as high as 8.64 on March 28, 2000. In order for the ratio to get to that sort of extreme now, the Nasdaq would need to top 13,000 (assuming the Russell remained at the same level).
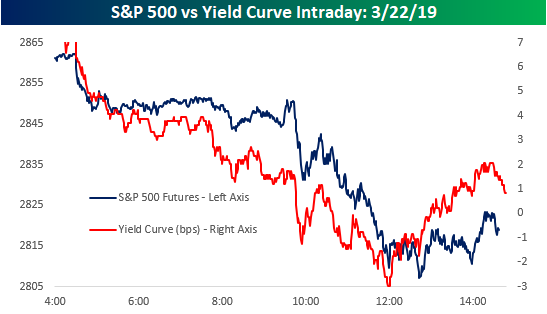
Yield Curve, Yield Curve, Yield Curve
If you are anything else besides the yield curve today, the market doesn’t care. After inverting for the first time since 2007 earlier today, the spread between the yields on the 10-year and 3-month US Treasuries has sucked up all the oxygen in the room as investors, traders, and their algos fret over the ominous economic signal that an inverted yield curve historically implies. Who cares whether the onset of a recession usually comes several months or even a couple of years after the curve first inverts; investors are using this as an excuse to take profits, and take profits is what they’re doing.
Just to illustrate how captivating the yield curve has been to the equity market, check out an intraday chart of S&P 500 futures versus the yield curve since very early this morning. Moves in the yield curve are clearly leading equities. When the curve started flattening early this morning, equities started heading south with the pace of selling accelerating when the curve inverted. Then, as the curve made its intraday low right after noon, the low in equities followed less than 40 minutes later. It’s like the school playground, where the yield curve is the ‘cool kid’ and equities are the followers.
STIRs Carried Away
With regards to the outlook for the rest of the year, there’s no other way to describe the current STIRs market other than “getting carried away.” As shown below, the Fed Funds Futures market has moved from pricing a greater than 90% chance of no hikes in 2019 to a more than 50% chance that we will see a rate cut by the end of the year! For context, as recently as mid-October the odds of either one hike, two hikes, or three-plus hikes were all around 1-in-4. While rate hikes being taken off the table for this year makes sense given the Fed’s extremely dovish shift since financial markets collapsed and global data gave up the ghost late in 2018, markets are going considerably further.

Stocks Feeling Sensitive
Investors are wondering what the right number is for the market as stocks leg lower on bad global data to close the week. Without taking a view on what the “right” price for the S&P 500 is, below we show a way to organize thinking about valuation in the short-term. In the table below we show a range of EPS growth rates relative to 2018 and a range of multiples on the resulting EPS numbers. The result is where the S&P 500 should trade given hypothetical earnings and how those are valued. For example, if you estimate EPS will fall 2% in both 2019 and 2020, and you value those EPS at a multiple of 15.0x, the S&P 500 is almost 700 points above where it should be! Alternatively, if you think EPS will be stable but should be valued at a relatively aggressive 19.0x, the S&P 500 should be trading near 3100. In the grid below, we’ve highlighted ~2800 values (roughly where the S&P 500 sits right now) to show the implicit EPS growth and multiple assumptions embedded in the price. Again, we don’t know the “right” combination of multiples and EPS growth, but if you’re extremely beared up with the Friday drop or think stocks are set to surge thanks to a dovish Fed, this analysis can help you see what sort of assumptions would need to play out for that to happen.
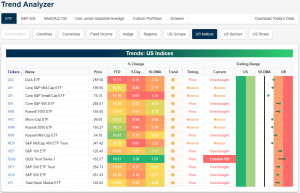
Trend Analyzer – 3/22/19 – Tech Getting Extended
As equities recovered losses from Wednesday’s FOMC meeting with strong gains yesterday, the major index ETFs have made another move towards overbought levels. Five index ETFs are neutral, while the other nine are overbought with one of these now to an extreme degree. Small and mid caps continue to lag behind their larger cap peers. Each of these ETFs in addition to the Dow (DIA), while still positive, have only seen modest gains of under 1% relative to other large cap ETFs gains which are all up well over 1%. The Nasdaq (QQQ) continues to blow the rest of the market out of the water with almost double the returns of the next best ETF over the last week. QQQ is up 3.5%, but these gains come with a cost as it is now in extreme overbought territory, sitting 7.57%, or more than 2 standard deviations, above its 50-DMA.
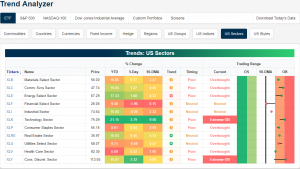
The Nasdaq’s strength comes thanks to the Technology sector (XLK). On top of outperforming YTD with a gain of over 21%, it is now up 3.79% this week and at extreme overbought levels. Additionally, Consumer Discretionary (XLY) has also rallied over 3% in the past 5 days bringing it to extremely overbought levels as well. In spite of these two sector’s outstanding performance, no other sector has managed to edge out gains that are as impressive. For example, the next best performing sector is Energy (XLE) which is only up 1.88%. On the other hand, Financials (XLF) have gotten hammered thanks to less favorable rates. The sector is now down 1.96% this week falling all the way back to its 50-DMA after sitting just barely below overbought levels last Friday.
Morning Lineup – Red Finish
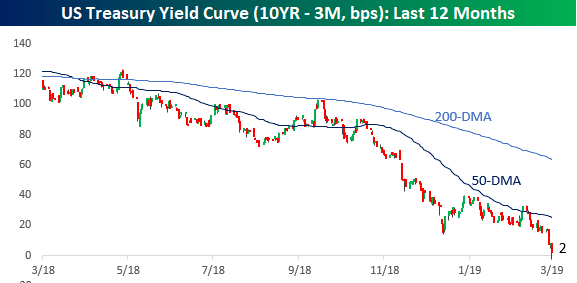
Investors are scrambling for fixed income this morning after some truly bad economic data in Europe. 10-year bunds are back to negative yields and the US Treasury yield curve (10y vs 3m) is just 2 basis points (bps) from inversion. As you might expect, equity futures aren’t taking too kindly to the moves in fixed income and are looking to close out the week on a down note.
Please click the link below to read today’s Bespoke Morning Lineup.
Bespoke Morning Lineup – 3/22/19
As noted in our Closer report last night, one of the defining characteristics of the rally off the Christmas Eve lows for the stock market was the trend of strong buying in the last hour of trading and right into the closing bell (light blue line), which is generally considered a positive market signal. That strength stood in stark contrast to the period from 9/21 through 12/24, where the S&P 500 typically sold off towards the close (red line). Over the last two weeks, late day buying power has started to weaken (dark blue line). Up to this point, we haven’t seen it turn outright negative, but it has shifted to a more neutral trend and something that bears watching in the weeks ahead.

Start a two-week free trial to Bespoke Premium to see today’s full Morning Lineup report. You’ll receive it in your inbox each morning an hour before the open to get your trading day started.

The Closer — Bank Stumble, Late-Day Rumble — 3/21/19
Log-in here if you’re a member with access to the Closer.
Looking for deeper insight on markets? In tonight’s Closer sent to Bespoke Institutional clients, we take a look at the rally in credit which has brought it right up to resistance. Staying on the topic, we pivot towards the underperformance of banks which have been moving contrary to what credit would lead one to believe. After making note of recent late session trends, we turn to macro data with an update to our Five Fed Manufacturing Composite which—with the addition of the Philly Fed’s release—is showing strong shipments but weaker forward-looking indicators. We finish tonight covering the lackluster labor productivity in some Eurozone countries and Chinese auto sales dragging down the global metrics.

See today’s post-market Closer and everything else Bespoke publishes by starting a 14-day free trial to Bespoke Institutional today!
Bespoke’s Sector Snapshot — 3/21/19
We’ve just released our weekly Sector Snapshot report (see a sample here) for Bespoke Premium and Bespoke Institutional members. Please log-in here to view the report if you’re already a member. If you’re not yet a subscriber and would like to see the report, please start a two-week free trial to Bespoke Premium now.
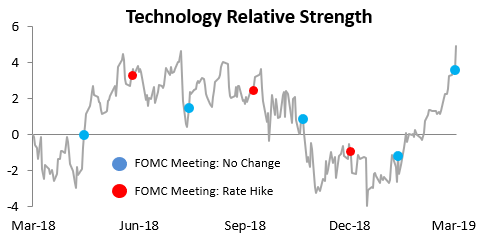
In this week’s Sector Snapshot, we highlight quite an extreme move for the Technology sector over the last couple of weeks. As shown in the chart below, Tech’s relative strength versus the S&P 500 just hit its highest point over the last year.
To gain access to the report, please start a two-week free trial to our Bespoke Premium package now. Here’s a breakdown of the products you’ll receive.