S&P 500 Total Return Inches Away From New High
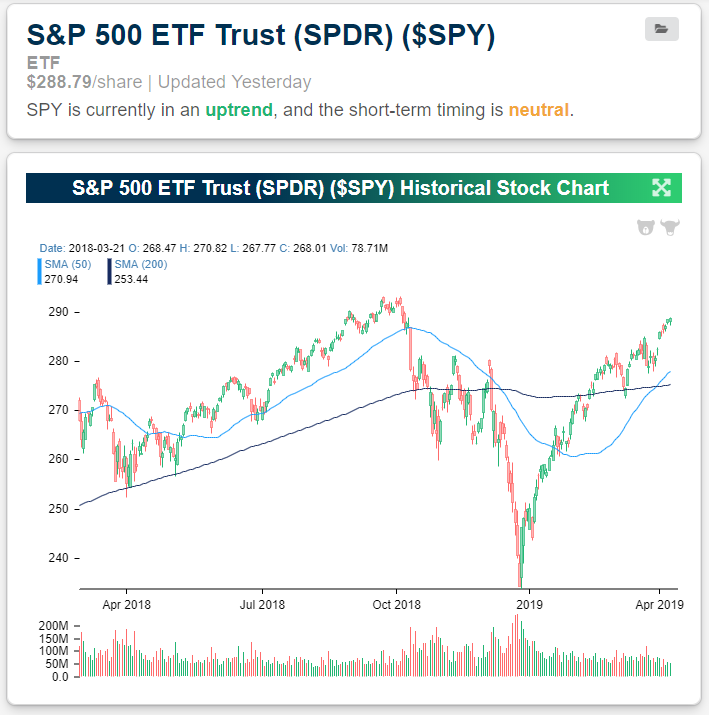
Below is a snapshot of the S&P 500 (SPY) ETF using our Security Analysis tool. Our proprietary Trend algo now rates SPY as being in an “uptrend,” and from a timing perspective it gets rated as “neutral.”
Note that SPY is still a little more than 1% away from its prior all-time high reached last September.
Start a two-week free trial to Bespoke Institutional to access our popular Security Analysis tool and much more.
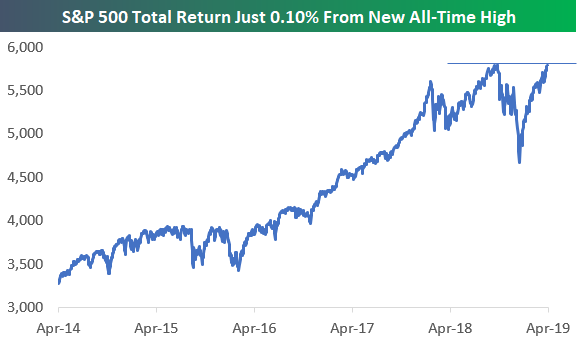
While SPY is still more than 1% away from new highs, the S&P 500 Total Return index, which includes dividends, is now just 0.10% away from eclipsing its prior high. At this point, US equities have effectively re-gained their Q4 2018 losses. Now investors just need to give stocks one last push to get the major indices above this last resistance level.
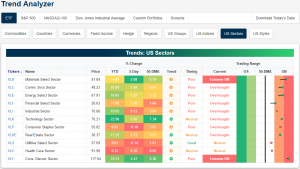
Trend Analyzer – 4/9/19 – Dow Lagging
The Dow (DIA) has lagged other major US indices over the last week due once again to weakness from Boeing (BA), which was downgraded yesterday. Turning to overbought/oversold levels, the Core S&P Small Cap ETF (IJR) and Micro-Cap (IWC) are still neutral while all others are overbought with most nearing extreme levels (>2 standard deviations above the 50-DMA).
Start a two-week free trial to Bespoke Premium to access our Trend Analyzer tool and much more.

While the major indices may not have reached extreme levels, both the Materials (XLB) and Consumer Discretionary (XLY) sectors have done so. Two others — Communication Services (XLC) and Energy (XLE) — have been pressing closer as well. Most others are also overbought with the exception of Utilities (XLU) and Health Care (XLV).
Bespoke Morning Lineup — 10 bps!
We’ve just published today’s Morning Lineup featuring all the news and market indicators you need to know ahead of the trading day. To view the full Morning Lineup, start a two-week free trial to Bespoke Premium.

Here’s a snippet from today’s report:
This morning is about as quiet as it gets in terms of domestic news for equity markets. One thing to note — while the cap-weighted S&P 500 remains about 1.2% below its all-time closing high of 2,930.75 (reached on 9/20/18), the S&P 500 Total Return index (which includes dividends) is now just 10 basis points away from a new all-time high. The US equity market has effectively re-gained all of its Q4 losses at this point; now it just needs to clear one final resistance hurdle.
Start a two-week free trial to Bespoke Premium to see today’s full Morning Lineup report. You’ll receive it in your inbox each morning an hour before the open to get your trading day started.
The Closer — New Spread Lows, Oil Rips, Rates At A Pivot, Positioning — 4/8/19
Log-in here if you’re a member with access to the Closer.
Looking for deeper insight on markets? In tonight’s Closer sent to Bespoke Institutional clients, as an increasing share of S&P 500 companies are becoming overbought as seen through RSI, we take a look at the forward returns in the next week. We then take a look at high yield spreads which are confirming the current rally. We also show how crude oil’s current rally could begin to stall. Moving on to the stock market’s internals, we show a decile analysis of the S&P 500 given metrics like performance during and after the Q4 2018 sell-off, P/E, and market cap. Next, we turn to the technicals of the 30 year yield as it approaches a major pivot point and how the market is beginning to price in rate hikes again. We finish with a note on Canadian housing data which has seen a slowing in starts.

See today’s post-market Closer and everything else Bespoke publishes by starting a 14-day free trial to Bespoke Institutional today!
The Most and Least Volatile Stocks on Earnings
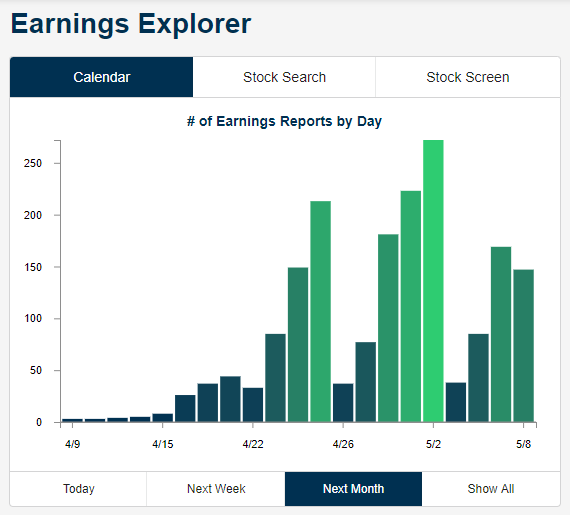
The next earnings reporting period kicks off later this week with the first of the big banks set to report. Below we show the number of earnings reports on each trading day over the next month. As you can see, things don’t really pick up until the last part of April, but from then through early May, we’ll see a number of days with 100-250+ reports on the calendar.
(You can monitor this chart in real time at our Earnings Explorer page available to Bespoke Premium and Bespoke Institutional members.)
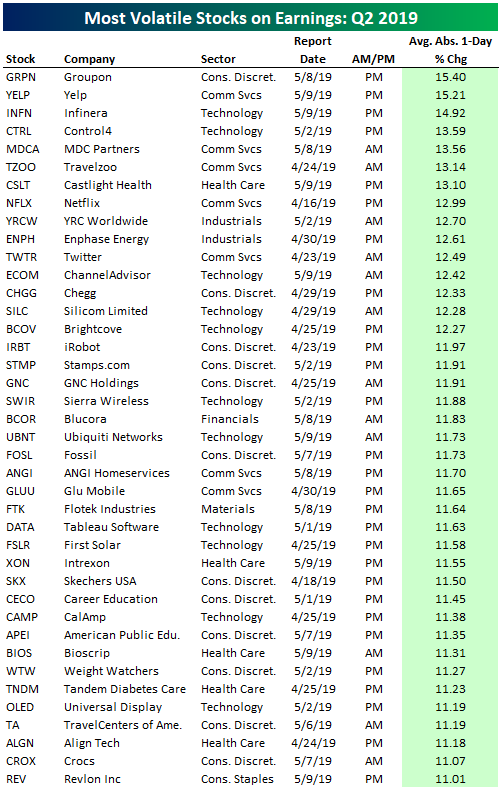
As we do prior to the start of each earnings season, below is an update to our list of the most volatile stocks on earnings. These are stocks that typically see the biggest one-day share price moves in response to their earnings reports. In order to make the list, the stock has to have at least 20 quarterly reports (5 years worth) as a public company. It also must be set to report its Q2 numbers sometime in the next month.
Groupon (GRPN) ranks first as the most volatile stock on earnings with an average one-day change of +/-15.4%! Yelp (YELP) is a close second with an average one-day change of +/-15.2%. Infinera (INFN), Control4 (CTRL), and MDC Partners (MDCA) round out the top five.
Netflix (NFLX) is the most notable name on the list. Even though it’s now a $100+ billion company, NFLX has an average one-day change of +/-12.99% on its earnings reaction day. Another well-known name is Twitter (TWTR) which sees an average move of +/-12.49% on earnings. Other notables on the list include iRobot (IRBT), Tableau Software (DATA), First Solar (FSLR), Weight Watchers (WTW), and Crocs (CROX).
Start a two-week free trial to Bespoke Premium to access our popular Earnings Explorer tool and much more.
If you don’t like earnings volatility, below is a list of the least volatile stocks on their earnings reaction days. As you can imagine, most of the stocks on this list are from the low-growth but stable Utilities and REIT sectors. Empire State Realty (ESRT) ranks first on the list with an average one-day change of just +/-1.01% on its earnings reaction day. Other notables include Con Edison (ED), Southern Co (SO), Dominion Energy (D), Altria (MO), Duke Energy (DUK), and Johnson & Johnson (JNJ). These names are as boring as it gets, but they’re certainly not going to cause you many headaches when earnings roll around every quarter either! Instead, they’ll likely just pay you a pretty nice dividend.

Chart of the Day: Flat Dollar
This Week’s Economic Indicators – 4/8/19
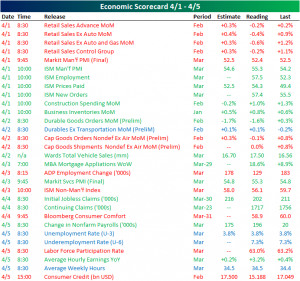
It was a mixed week in economic data last week as the same number of releases that beat either estimates or the previous period also missed. Yet another weak retail sales report for February kicked things off on Monday. Rather than another increase like in January, the February data showed worse sales across the board. Also out on Monday was the ISM Manufacturing PMI which came in stronger as well as improved Construction Spending in February. Tuesday saw a mixed Durable and Capital Goods print, though Vehicle Sales were solid in the US with 17.50 mm vehicles SAAR. On Wednesday, MBA Mortgage Applications continued to see strong demand as rates have fallen. The second half of the week saw solid labor data as Initial Jobless Claims came in at the lowest level since 1969, and following a very weak 20K change last month, the Nonfarm Payrolls report saw solid job creation in March.
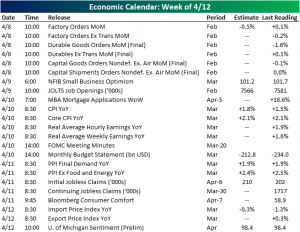
Final Goods Orders and Factory Orders for February were released this morning. Factory Orders declined in line with expectations of a 0.5% drop MoM. Tomorrow, the NFIB releases Small Business Optimism data for the month of March. Whereas February saw a print of 101.7, the March number is forecasted to weaken to 101.2. JOLTS Job Openings will be out later that day which is also expected to come in slightly weaker. CPI for March will come out on Wednesday. While headline inflation is forecasting a pick up, the Core reading is not expected to see any change. The FOMC’s Meeting Minutes from their March 20th meeting will also come out that day. CPI’s producer counterpart will come out the following day with the opposite expectations: the headline reading is not expecting any change while the core reading is expecting a decrease from February. Preliminary University of Michigan Sentiment for April will round out the week on Friday.
Start a two-week free trial to Bespoke Premium to access our interactive economic indicators monitor and much more.
Trend Analyzer – 4/8/19 – Hello Uptrends
Friday’s gains seemed to have been a tipping point for major US indices as almost half (six) are now in uptrends. At the same time, conditions have become pretty overbought as only two are trading in neutral territory. Not only are twelve of the ETFs overbought, but they are also approaching extreme levels. Only the large-cap Dow (DIA) and S&P 100 (OEF) saw gains of less than 2% last week.
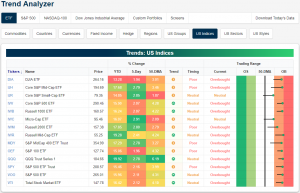
Glancing at the charts, there are two noticeable patterns between large caps and the others. In spite of some stalling recently, large caps have made a push into the range from 2018 highs and highs from the Q4 sell-off. For the likes of the Dow (DIA), Russell 1000 (IWB), and the S&P 500 (IVV, SPY, VOO) those 2018 highs will be the next resistance to be watched. Unlike large caps, small and mid caps have recently made lower lows and lower highs, but late last week’s trading helped to bring the ETFs out of these short term downtrends.

Morning Lineup – Grounded
We’ve just published today’s Morning Lineup featuring all the news and market indicators you need to know ahead of the trading day. To view the full Morning Lineup, start a two-week free trial to Bespoke Premium.
Here’s a snippet from today’s report:
It’s a pretty quiet start to the trading week with just modest moves overnight and this morning in foreign markets, and little in the way of movement in treasuries. Dow futures are being weighed down by Boeing (BA), which cut production guidance on Friday after the close and received a downgrade over at Merrill Lynch this morning. General Electric (GE) is also trading down 5% after JP Morgan downgraded the stock to underweight.
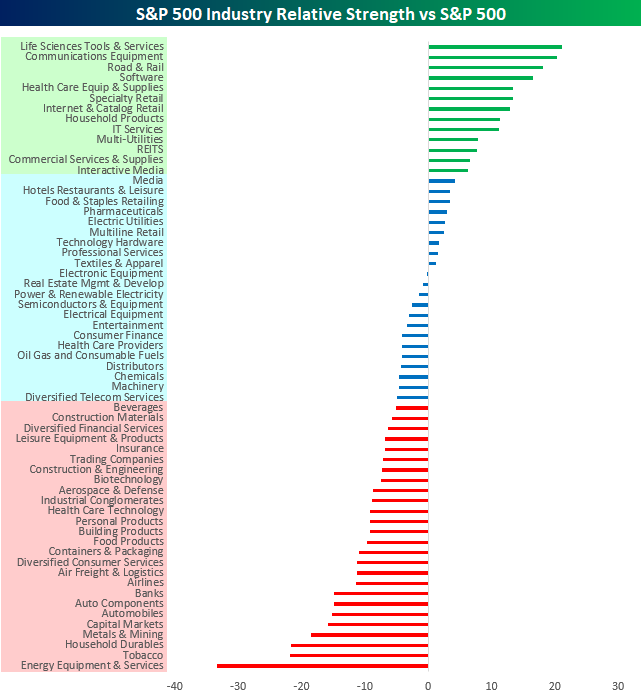
In this weekend’s Bespoke Report, we provided a detailed chart check-up and included snapshots of the setups for each of the S&P 500’s industries. To summarize how things looked on a group by group basis, the chart below summarizes the relative strength of each S&P industry’s performance versus the S&P 500 over the last year. Groups with green performance bars have significantly outperformed the S&P 500 over the last year, groups in blue are either modestly outperforming or underperforming the S&P 500, while groups in red have significantly underperformed in the last year. Leading the way higher, Life Sciences, Communications Equipment, and Road & Rail have been the top three performing groups, while Energy Equipment, Tobacco, and Household Durables have been the biggest laggards.
Start a two-week free trial to Bespoke Premium to see today’s full Morning Lineup report. You’ll receive it in your inbox each morning an hour before the open to get your trading day started.
A Solid Encore to a Strong Quarter
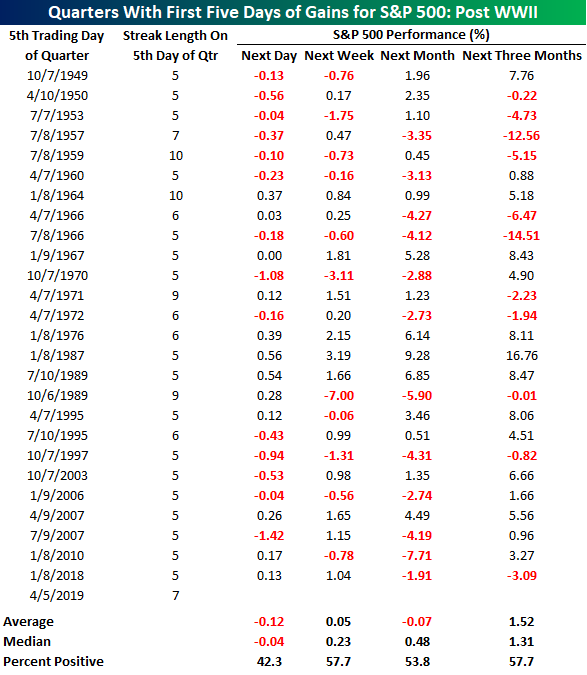
The first quarter returns for the S&P 500 were quite strong, but if you thought the market wouldn’t have enough energy for a good encore, the first full week of Q2 proved otherwise. With gains on every trading day of the quarter’s first week, the S&P 500 heads into Monday riding a seven-day winning streak and the first five-day winning streak to kick off a quarter since the beginning of 2018. Before that, though, you had to go all the way back to 2010 to find another time where the S&P 500 kicked off the quarter with a five-day winning streak.
The table below shows every quarter in the post-WWII periods where the S&P 500 was up in the first five trading days of a quarter. For each period we show the date of the S&P 500’s fifth trading day for that quarter, how long the winning streak was as of that date, and then how the S&P 500 performed over the following day, week, month, and quarter. While one would think that a strong ‘first impression’ for the quarter would lead to solid gains going forward, the results don’t back that up. in the 26 prior periods shown, the S&P 500 actually saw an average decline of 0.12% on the sixth trading day of the quarter with gains less than half of the time. One week later, the S&P 500 saw an average gain of just 0.05% (median: 0.23%) with positive returns just under 58% of the time.
Moving out three months, the S&P 500’s average and median return are both over 1.3%, but here again, the S&P 500 was only up less than 60% of the time. That’s hardly anything to get excited about, although the one silver lining is that more recently, the S&P 500’s average return is considerably better. In the last thirty years, the S&P 500 has seen positive returns over the next three months in eight out of eleven periods for an average gain of 3.2%. Start a two-week free trial to Bespoke Premium to access our interactive research portal. You won’t be disappointed!