Key Earnings Reports to Watch This Week
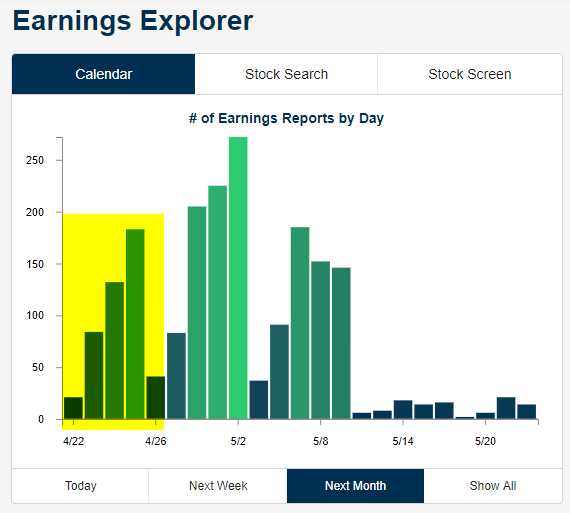
Earnings season really picks up this week with 400+ companies set to report. The chart below shows the number of earnings reports by day over the next month and can be found updated daily at our Earnings Explorer page. Start a two-week free trial to Bespoke Institutional to access this page along with everything else we have to offer!
Below is a list of the 40 most important companies set to report earnings this week. These stocks are pulled from our Earnings Calendar table at the same Earnings Explorer page mentioned above.
A number of Dow 30 stocks like Coca-Cola (KO), Procter & Gamble (PG), United-Tech (UTX), and Verizon (VZ) will report Q1 earnings Tuesday morning ahead of the open. On Wednesday, we’ll hear from more big Industrials companies like Boeing (BA), Caterpillar (CAT), General Dynamic (GD), and Northrop Grumman (NOC) in the morning, while in the afternoon, investors will be focused on names like Facebook (FB), Microsoft (MSFT), Tesla (TSLA), and Visa (V).
On Thursday, we’ll get 3M (MMM), Altria (MO), and UPS in the morning, followed by Amazon (AMZN), Intel (INTC), and Starbucks (SBUX) after the close. Finally, Chevron (CVX) and Exxon Mobil (XOM) will round out the week with reports on Friday.
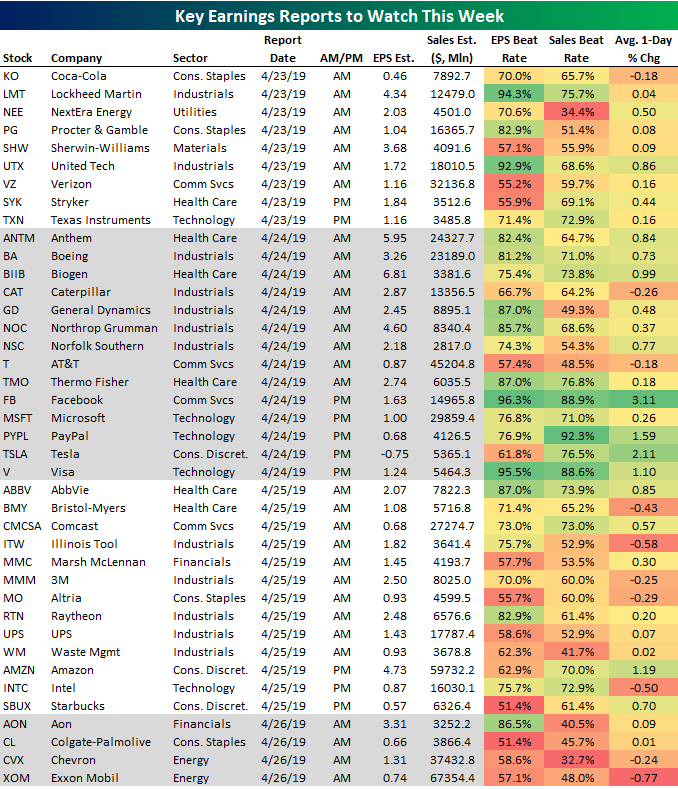
You’ll notice a number of additional data points in the table above to go along with each company’s report date, EPS estimate, and sales estimate. Also included are the historical earnings per share and sales beat rate that we track for every US stock. These two data points show how often a company beats estimates on both the top and bottom line. The final column in the table shows the average one-day price change that the stock has historically experienced on its earnings reaction day. For example, Facebook (FB) has historically averaged a huge gain of 3.11% on its earnings reaction day, while Exxon Mobil (XOM) has averaged a one-day decline of 0.77%.
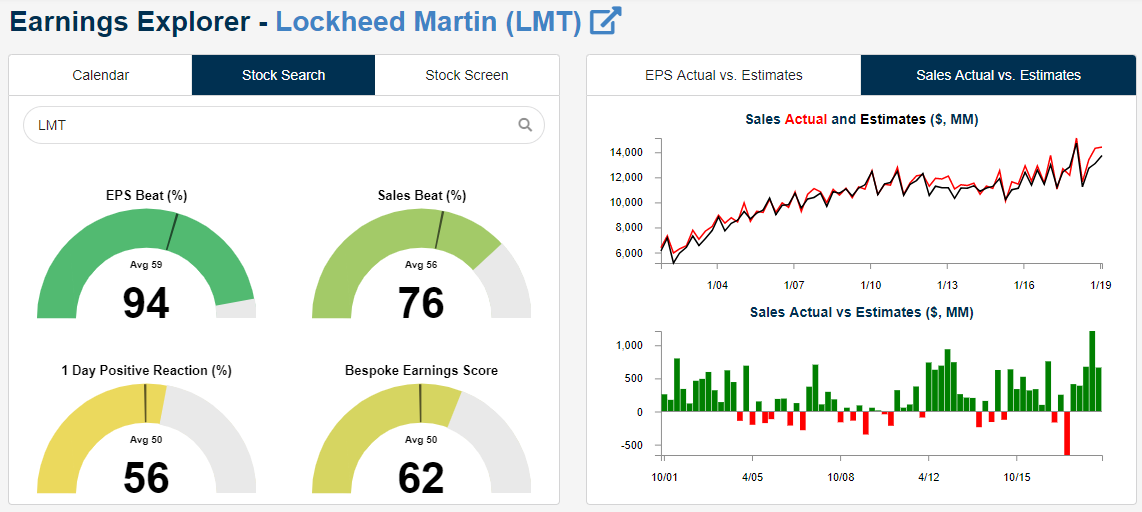
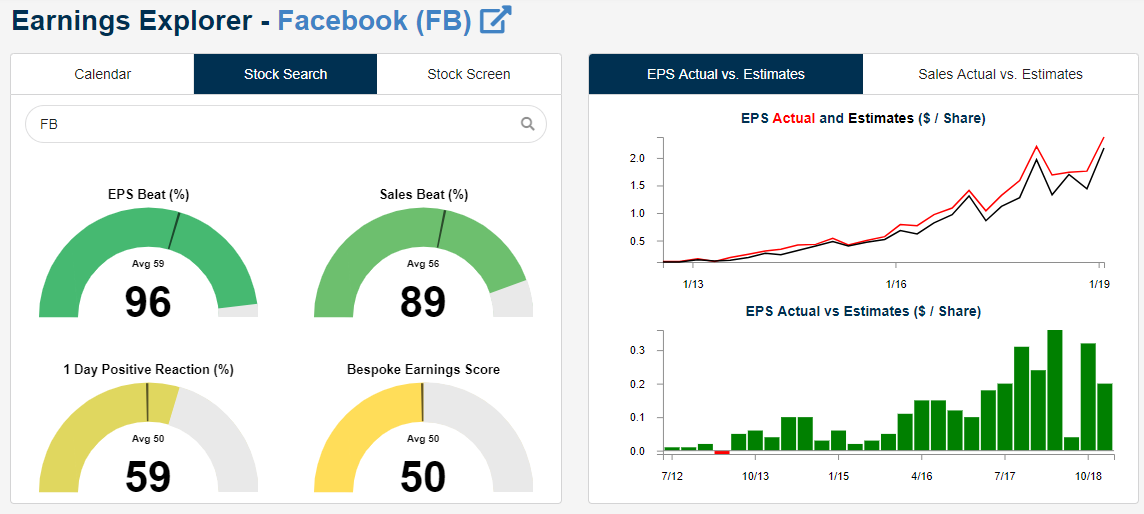
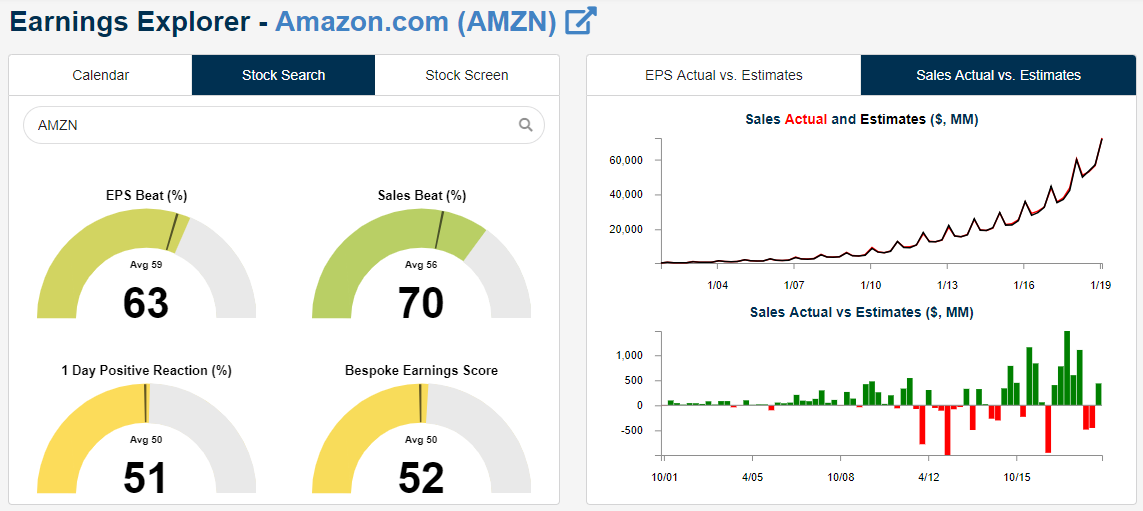
Within our Earnings Explorer tool, users can pull up key information for individual stocks with our Stock Search feature. Below are snapshots pulled from the Earnings Explorer for Lockheed Martin (LMT), Facebook (FB), and Amazon (AMZN), which all report this week.
You’ll notice huge EPS beat rates for both Lockheed Martin and Facebook. Facebook also has an extremely high sales beat rate. A high beat rate for a stock means that expectations heading into future reports will also be high.
On the right side of the stock-specific snapshot from our tool, there are charts showing historical actual versus estimated EPS and sales so you can easily see how these two important measures are trending. For LMT, sales have really picked up over the last few years after a multi-year sideways period from 2010 through 2016. Facebook has had a few bumps in the road for sales but is still trending higher. When looking through these charts for individual companies, it’s easy to tell which ones are performing well and which ones are struggling.
One company that’s definitely not struggling when it comes to revenues is Amazon (AMZN). In the third snapshot below, you can see a basically parabolic trajectory for AMZN sales over time. In Q1, AMZN sales are projected for $60 billion, which would be $9 billion more than the $51 billion in sales that the company recorded in Q1 2018. There are a number of additional features in our Earnings Explorer that aren’t shown in this write-up. We urge you to try it out and see for yourself just how helpful it is during earnings season! You can access it now with a two-week free trial to Bespoke Institutional.
Qualcomm (QCOM) Continues to Roll
Shares of Qualcomm (QCOM) are trading higher again to kick off the week after last week’s monster surge in the wake of the royalty settlement with Apple (AAPL). In just the last four trading days, the stock has rallied more than 43%. Now, it’s rare enough to see small cap stocks rally 40% in the span of four trading days, but for a mega-cap stock like QCOM, it’s practically unheard of. In just the last four trading days, QCOM”s market cap has jumped by nearly $30 billion from $69 billion to just under $99 billion. In the process, it has passed stocks like CVS, Morgan Stanley (MS), Goldman Sachs (GS), Caterpillar (CAT), Lowe’s (LOW), Starbucks (SBUX), and American Express (AXP) among others.
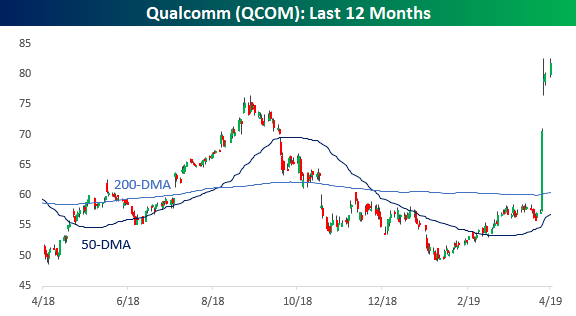
For QCOM itself, the move over the last four trading days is also reaching historical proportions. The chart below shows the historical rolling four-day rate of change for QCOM, and the current rate of 43.2% now ranks as the second all-time behind only the 53.2% four-day rally in April 1999. What makes that rally in 1999 even more impressive, though, was that even before it started, QCOM was already up 139% YTD after announcing in March of that year that it had settled all outstanding patent litigations with Ericsson related to CDMA technology. After that four day rally, QCOM was up more than 250% YTD and finished the year with a gain of more than 2,600%! The late 1990s sure were fun! Start a two-week free trial to Bespoke Institutional to access all Bespoke’s research and new interactive tools!

This Week’s Economic Indicators – 4/22/19
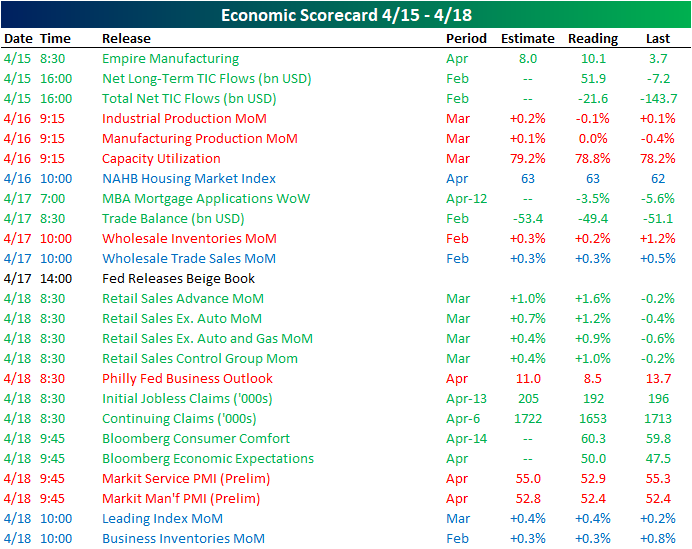
In spite of a shortened week as a result of the Easter Holiday, last week was fairly busy in economic data. There were 26 releases spread throughout the week with just under half coming in better than forecasts or the prior period. Empire Manufacturing for April kicked off the week with a much stronger print of 10.1 versus 3.7 in March. More positive treasury flows were also seen in Monday’s TIC flows. Industrial Production showed weakness on Tuesday while homebuilder sentiment came in line with forecasts of 63. Thursday was filled to the brim with data. March retail sales came in much stronger than the February print and handily above forecasts. The Philly Fed’s Business Outlook Index echoed the weaker manufacturing data from earlier in the week and a weaker preliminary Markit PMI for April. The service portion also came in weaker than forecasts. Initial Jobless Claims continues to surprise as it came in at another 50-year low. Markets may have been closed on Friday, but the government was still open and Housing Starts and Building Permits both released below estimates.
Start a two-week free trial to Bespoke Premium to access our interactive economic indicators monitor and much more.
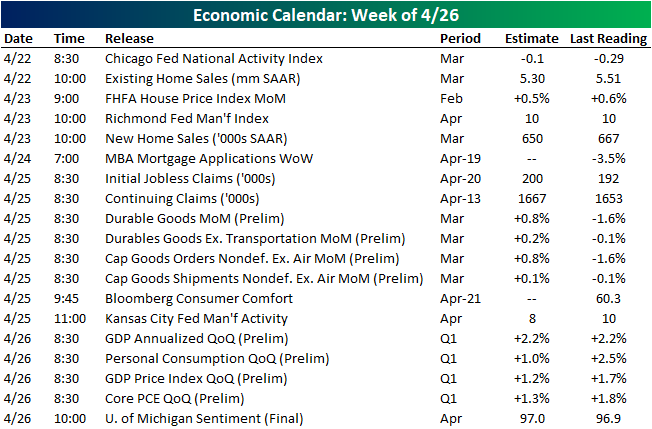
Even though the holiday has passed, this week is much quieter on the data front with only 19 releases. The Chicago Fed’s National Activity Index was the first release this week, coming in lower than forecasts at -0.15, but still improved from the February print of -0.29. Existing home sales also came in weaker this morning at 5.21mm SAAR. Tomorrow we will get FHFA home prices for February. Further in housing data, we will also see New Home Sales for March which are expected to come in slightly lower. The Richmond Fed’s Manufacturing index is also due out tomorrow with no forecasted change. Wednesday will be very light with only MBA Mortgage Applications releasing but things will pick back up on Thursday with Durable and Capital Goods data. We will also see if Initial Jobless Claims can continue to impress at record lows. We cap off the week with the first release of Q1 GDP data. While productivity is not expected to see any change, inflation data is forecasted to come in much softer.
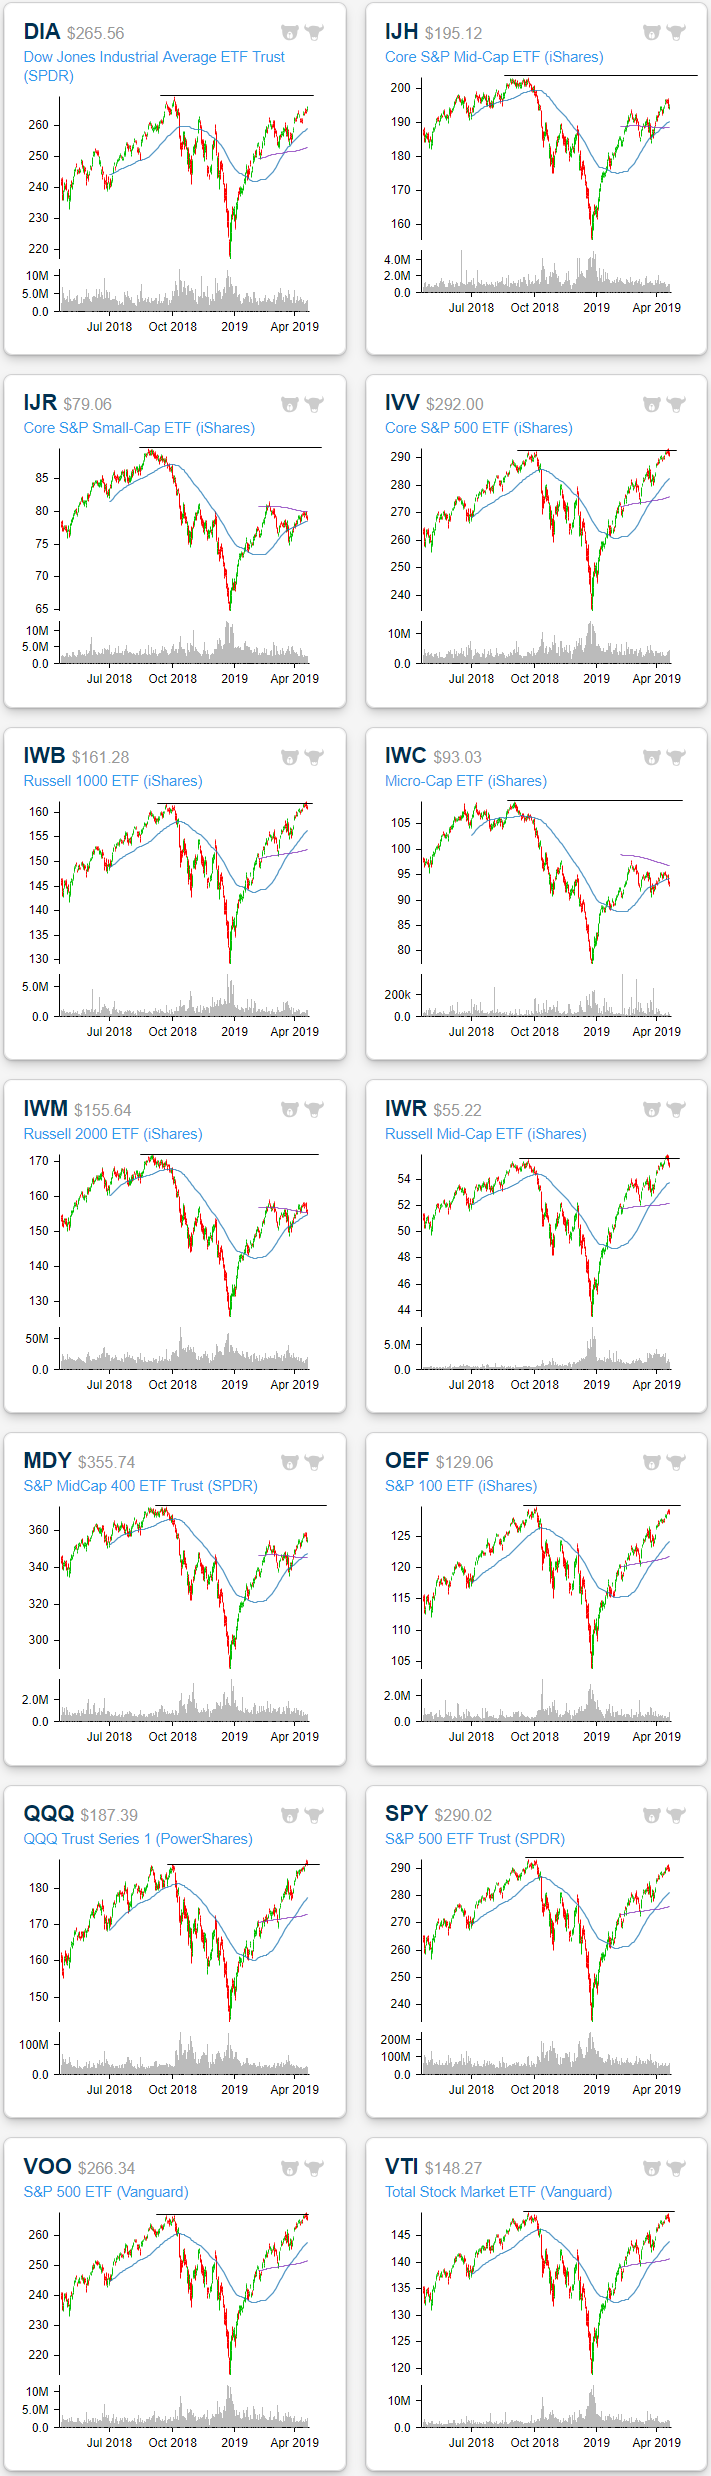
Trend Analyzer – 4/22/19 – Small Caps Lagging
A busy week of earnings is kicking off with eleven of the major US index ETFs overbought while the remaining three are neutral. Of those that are overbought, large caps have done the best in the past five days with the Dow (DIA) leading the way with a 1.59% gain. The S&P 100 (OEF) and Nasdaq 100 (QQQ) have also seen solid gains of 1.15% and 1.28%, respectively. The performance of mid-caps has been a bit more mixed while small caps have started to lag. Currently, each one is neutral; the same as last week except for the Russell 2000 (IWM) which had been slightly overbought. Of the small-cap indices, the Core S&P Small Cap (IJR) has held up the best only down 0.34%. Meanwhile, the Micro-Cap (IWC) has gotten battered. IWC heads into the new week 2.1% lower than where it stood at the beginning of last week. It now also has the smallest YTD gain of the major index ETFs and is the only one to have fallen below its 50-DMA and is now approaching oversold territory. As we noted in a Chart of the Day earlier this month, the small-cap space has a heavy weight in Health Care, so that sector’s weakness is causing a lot of the recent underperformance versus the large-cap space. Start a two-week free trial to Bespoke Premium to access our interactive Trend Analyzer tool and much more.
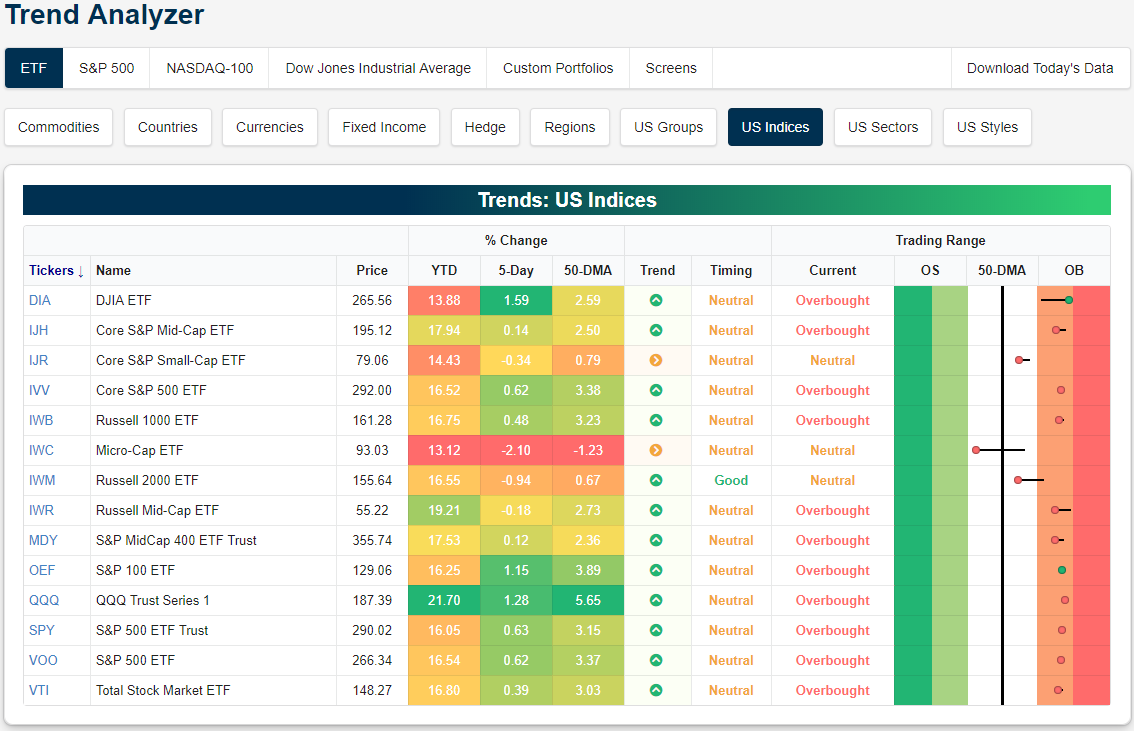
As the S&P 500 nears its all-time highs set last fall—currently over 1% away—some of the other major index ETFs have managed to breakthrough though they have not stayed there. Some like the Core S&P 500 (IVV), Russell 1000 (IWB), Russell Mid-Cap (IWR), and S&P 500 (VOO) all briefly broke above these levels last week but could not hold them. Meanwhile, the Nasdaq (QQQ) has actually broken out and managed to close out the week above last year’s highs.
Morning Lineup – Slow Start to a Busy Week
Markets are easing investors back into the mix after the three-day weekend as European markets remain closed. US futures are trading lower this morning, while crude oil is ripping after the US will reportedly not extend Iranian oil waivers when they expire on 5/2. The economic calendar is relatively quiet today with the Chicago Fed NAI at 8:30 and Existing Home Sales at 10:00 Eastern.
We’ve just published today’s Morning Lineup featuring all the news and market indicators you need to know ahead of the trading day. To view the full Morning Lineup, start a two-week free trial to Bespoke Premium.

Here’s a snippet from today’s report:
You wouldn’t know it by the pace of reports today but this week and next are the two busiest of the Q1 earnings season as more than 300 companies in the S&P 500 are scheduled to report. The peak day for earnings of S&P 500 companies comes on Thursday (4/25) when 64 companies will report. Today, though, only seven companies are on the calendar. The next time there will be a day with fewer reports isn’t until May 10th!

Start a two-week free trial to Bespoke Premium to see today’s full Morning Lineup report. You’ll receive it in your inbox each morning an hour before the open to get your trading day started.
Bespoke Brunch Reads: 4/21/19
Welcome to Bespoke Brunch Reads — a linkfest of the favorite things we read over the past week. The links are mostly market related, but there are some other interesting subjects covered as well. We hope you enjoy the food for thought as a supplement to the research we provide you during the week.
While you’re here, join Bespoke Premium for 3 months for just $95 with our 2019 Annual Outlook special offer.
Real Estate
College Kids Are Living Like Kings in Vancouver’s Empty Mansions by Natalie Wong and Natalie Obiko Pearson (Bloomberg)
A new vacancy tax has dragged some of the highest-end inventory in the housing market into rental status, giving college students a chance to live in the lap of luxury. [Link; soft paywall]
Wealthy Greenwich Home Sellers Give In to Market Realities by Katherine Clark (WSJ)
Extremely high prices, changes in the finance industry, and preference for urban New York have put the Greenwich real estate market into something of a tailspin. [Link; paywall]
Billionaire Whimsy
Why are Silicon Valley billionaires starving themselves? by Ruth Margolis (The Week)
Eating once a day during the week and never on weekends sound good to you? Us neither, but Twitter CEO Jack Dorsey is a fan. [Link]
In San Francisco, Making a Living From Your Billionaire Neighbor’s Trash by Thomas Fuller (NYT)
It’s possible to take home over $1200 per month picking through the trash of San Francisco’s elite in order to sort out valuables. [Link; soft paywall]
Social Media
How a Former Vine Comedian and His Frat Brother Created the Ultimate Birthday Wish by Cameron Albert-Dietch (Inc.)
How two Duke University frat brothers came up with a service that connects celebrities and influencers to their fans with short video shout-outs. [Link]
The Influencer’s Dilemma by Nir Kabessa, Noam Levenson, and Vernon Johnson (Hacker Noon)
An investigation of the new world of social capital, quantified and globalized by social media websites and a massive new market for human interaction novel to human history. [Link]
Malfeasance
Sears sues former CEO Edward Lampert, claiming he stripped $2 billion in assets as it headed to bankruptcy by Lauren Zumbach (Chicago Tribune)
A new lawsuit alleges that the utterly failed Sears turnaround was an exercise in asset-stripping by Eddie Lampert and his hedge fund. [Link]
The Rise And Fall Of A New York Shock Jock by Nick Paumgarten (The NYer)
Inside the downfall of Craig Carton, who went from the center of New York City’s talk radio universe to federal prison thanks to a gambling addiction and the fraud that funded it. [Link]
The Truth About Dentistry by Ferris Jabr (The Atlantic)
How dentists abuse their expertise in order to conduct unnecessary procedures and pad their income, thanks to low oversight and little understanding from patients. [Link]
Political Economy
If Trump Country Soars, Will the President Glide to a Second Term? by Thomas B. Edsall (NYT)
As the national labor market tightens, smaller and more rural states which tended to support President Trump in 2016 have seen modestly faster payrolls growth and lower unemployment than states won by Hillary Clinton in 2016. [Link; soft paywall]
Our Lady
Four years ago, an art historian used lasers to digitally map Notre Dame Cathedral. His work could help save it by Michelle Lou (CNN)
A miniature lidar system helped Vassar College art professor take an extremely detailed snapshot of the cathedral’s interior; that snapshot may prove extremely helpful in efforts to rebuild. [Link]
We Built an ‘Unbelievable’ (but Legal) Facial Recognition Machine by Sahil Chinoy (NYT)
Using $60 worth of Amazon cloud services, a New York Times team used webcam images and public pictures on employer websites to track pedestrians in the busy crowd around Bryant Park in Manhattan. [Link; soft paywall]
Climate Change
One man’s two-decade quest to suck greenhouse gas out of the sky by James Temple (MIT Technology Review)
The quixotic quest to come up with a scalable way to remove greenhouse gasses from the atmosphere, unwinding the rising CO2 levels that are changing the climate. [Link]
Research
The evolution of financial fragility: A quantile decomposition of firm balance sheets by Leila E. Davis, Joao Paulo A. de Souza, and Gonzalo Hernandez (The Next Recession)
Firms are holding more cash, but a rising share of firms can’t cover debt loads. How is that possible? The authors argue that the attributes of new entrants (changing composition) drive the change; in other words, new firms are entering the market with more cash and less debt, allowing an increase in both cash holdings and inability to cover debt. [Link; 39 page PDF]
Outside The Acela
Bachelorettes, Bibles and Amazon: is Nashville the perfect model for a second-tier city? By Kuhsbu Shah (The Guardian)
Start-ups dedicated to bachelorette parties, jammed bars, and 14 million visitors a year: how Nashville found its niche as a mid-sized metropolis. [Link]
Whiffs & Dingers
The Average Umpire Is Almost 50. The Best Ones Might Be in Their 30s. by Jared Diamond (WSJ)
With a greying force of diamond wardens, MLB needs to face facts that the young guns have the better eye for balls. [Link; paywall]
Gambler who won $1.2 million on Tiger Woods’ 2019 Masters victory: “I had never placed a bet on sports in my life” by Stephen Hennessey (Golfworld)
A Wisconsin man walked from casino to casino in Vegas ahead of The Masters, trying to find someone to take action on an $85,000 wager for Tiger to win another green jacket. [Link; paywall]
Read Bespoke’s most actionable market research by joining Bespoke Premium today! Get started here.
Have a great weekend!
The Closer — Thursday Grab Bag: Markets & Economic — 4/18/19
Log-in here if you’re a member with access to the Closer.
Looking for deeper insight on markets? In tonight’s Closer sent to Bespoke Institutional clients, we begin with a look at the VIX which has continued to grind lower. Turning over the macro data, we expand on this morning’s look at Markit Flash PMIs with the addition of the US print. Next, we show our Five Fed Manufacturing Composite with the New York and Philly Fed inputs. After that, we show what the Conference Board’s Leading Indicators index is signaling in terms of a recession. We finish with an analysis of crude oil prices which have stalled near $65 while Brent and crack spreads have held up better; we go further to explain what this means for refiners.

See today’s post-market Closer and everything else Bespoke publishes by starting a 14-day free trial to Bespoke Institutional today!
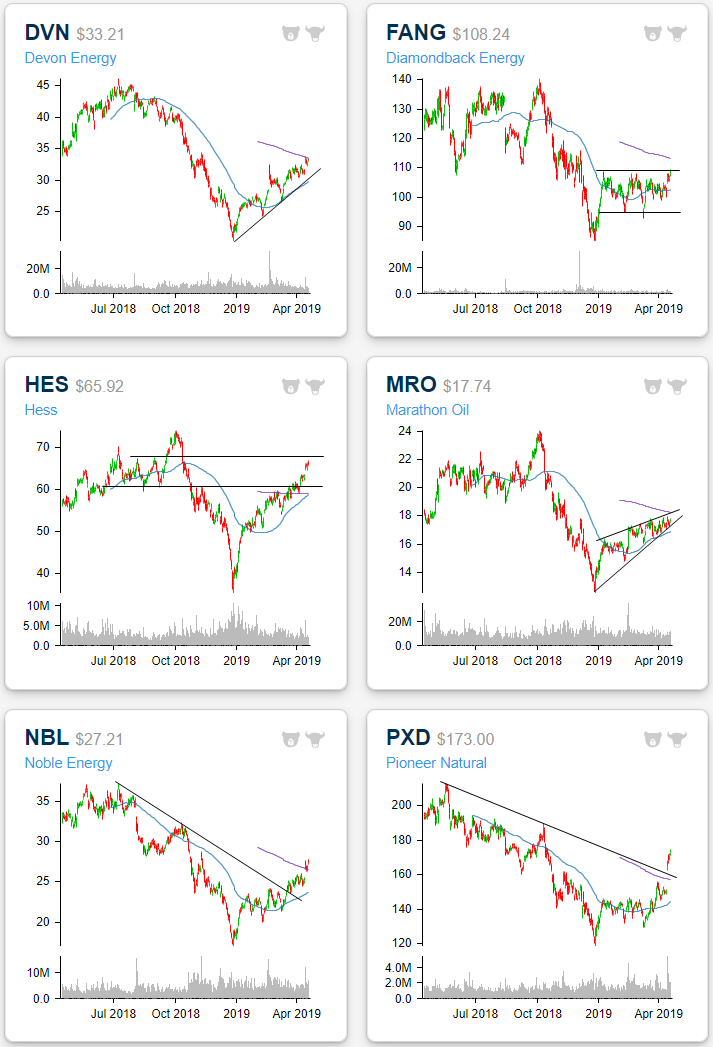
Sector Charts – 4/18/19 – Energy
Oil has surged all year as one of the best-performing asset classes, and the S&P 500 Energy sector has benefited from oil’s move with a year-to-date gain of nearly 18%. We highlight a few Energy sector stock charts below.
Similar to crude prices, Devon Energy (DVN) and Marathon Oil (MRO) have been in solid uptrends this year. DVN has now seen the third best YTD gains (47.73%) of the S&P 500 stocks in the sector, bringing it right up to the 200-DMA. In Thursday’s trading, it has made a move above the 200-day and is looking to close there. Marathon Oil (MRO) has also traded in a nice uptrend this year right between the 50-DMA and 200-DMA. The two moving averages are converging on each other, and price has been similarly trading in a tighter range though it has continued to make higher highs. As it continues in its uptrend, the 200-DMA will be a point to watch as it could break out as Hess (HES) and Helmerich & Payne (HP) did. Other stocks like Apache (APA), Chesapeake (CHK), EQT (EQT), and Phillips 66 (PSX) are showing similar patterns.
Hess (HES) has actually outperformed the entire sector and the commodities it deals in this year by a sizeable margin having now risen 63.45% YTD. After a rough end to 2018, this rebound has brought it right back towards the upper end of the range from last year. If it breaks through this resistance around $67, the next area to watch would be last year’s highs above $74.
Looking solely at Diamondback Energy (FANG), you would never be able to tell that oil has seen such a strong run this year. While it is up over 13% YTD, the stock has been trading sideways all year. But at its current levels, FANG is eying a break out above this consolidation and back to the levels it was at for much of 2018. Intraday over the past couple of sessions, the stock managed to push above YTD highs to the highest levels since early December. While FANG is overbought, a close above this range would be promising.
Noble Energy (NBL) has also outperformed oil so far this year with a 45.86% gain. The stock has been in a solid uptrend since the start of the year, breaking a long term downtrend line. More recently, the large gap up on last week’s news of Anadarko and Chevron’s merger has brought the stock above the 200-DMA for the first time since October. So far NBL has managed to hold above these levels. Similarly, Pioneer (PXD), which has been in a downtrend for the past year, got a solid boost to the technical picture following the news of the merger. For most of this year, the stock has been range bound, though, in late March it did begin to break above this range. The response to last week’s news led to a large gap up above the 200-DMA. More importantly, it is also now above that former downtrend line. Since then, the stock has yet to reject these new levels rallying over 6% in the past week.
Start a two-week free trial to Bespoke Premium to access our Chart Scanner, Trend Analyzer, and much more.
Individual Investors Remaining Neutral
Last week, bullish sentiment as indicated by the AAII’s weekly survey of individual investors came in at the second highest level of the year at 40.29%. Declines this week seemed to have weighed on bulls as the percentage of investors reporting as bullish fell to 37.56%. That is back below the historical average of 38.2%, though, it is also not far away from where bullish sentiment has stayed for much of the year. This week’s level deviates slightly from the Investors Intelligence survey which saw bearish sentiment unchanged while optimism rose to the highest levels since October.
Start a two-week free trial to Bespoke Institutional to access our Closer which includes our Market Timing Model which uses these sentiment indicators to forecast the market.

The bearish camp seems to have borrowed from the bulls as 21.83% of investors reported bearish sentiment versus 20.38% last week. This is a fairly small movement relative to what could be observed in the past couple of months. For example, last week and in the final week of March, bearish sentiment fell by over 7%. In other words, bearish sentiment seems stable around the lower end of the range from the past few years, now several percentage points below the historical average of 30.31%.

While bullish and bearish sentiment remains high and low, respectively, neutral sentiment is also very elevated. At 40.61%, the percentage of investors reporting neutral sentiment is now slightly over one standard deviation above the historical average. The last time this happened was in late July of last year.