The Closer — Overrated Rebalancing, EURUSD Pop, US Data Dollop — 4/30/19
Log-in here if you’re a member with access to the Closer.
Looking for deeper insight on markets? In tonight’s Closer sent to Bespoke Institutional clients, we begin by evaluating the theory that monthly rebalancing has been driving the market at month’s end. In FX, we then take a look at the dollar’s weakness versus the euro. Turning to macro data, we review this morning’s release of MNI’s Chicago PMI which is pointing to a questionably bad ISM Manufacturing reading. We also look at today’s pending home sales data and the S&P/Case-Shiller home prices before finishing with an update on the Employment Cost Index.

See today’s post-market Closer and everything else Bespoke publishes by starting a 14-day free trial to Bespoke Institutional today!
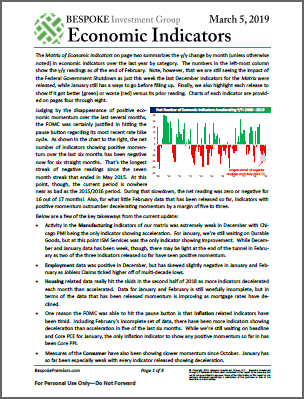
Bespoke Matrix of Economic Indicators: 4/30/19
Our Matrix of Economic Indicators is the perfect summary analysis of the US economy. We combine trends across the dozens and dozens of economic indicators in various categories like manufacturing, employment, housing, the consumer, and inflation to provide a directional overview of the economy.
To access our newest Matrix of Economic Indicators, start a two-week free trial to either Bespoke Premium or Bespoke Institutional now!
Consumers Confident About Jobs Again
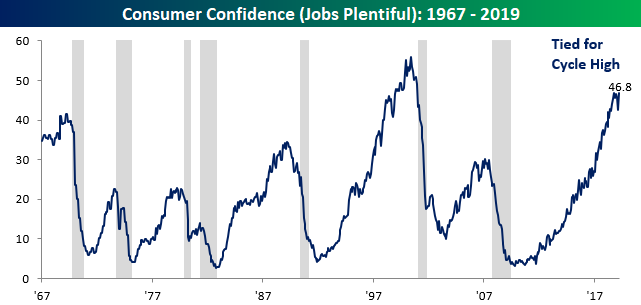
Consumer Confidence for the month of April was released earlier this morning and handily topped expectations coming in at a level of 129.2 vs 126.8. Despite the rebound, the headline confidence reading remains well off its cycle high reading of 137.9 from six months ago back in October.

One reason for the bounce in sentiment was jobs. After a sharp decline in sentiment towards the employment environment last month, the percentage of consumers who feel that jobs are ‘plentiful’ erased all of February’s weakness and is once again back at its highest levels of the economic cycle. That didn’t take long! This is an important development given the fact that this reading tends to roll-over ahead of recessions. When we saw the sharp decline last month, it raised some concerns, but now that it’s right back at its prior highs, those fears can be set aside.
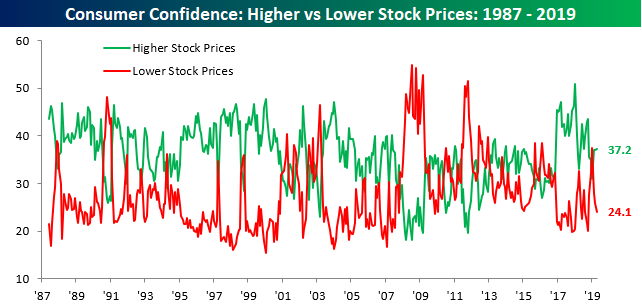
Finally, with sentiment improving and the stock market rallying, consumers are feeling more confident about the stock market too. In this month’s survey, the percentage of consumers expecting higher stock prices rose to 37.2% from 37.1%, while the percentage expecting lower stock prices dropped from 25.8% down to 24.1%. While it is never a good thing to see complacency towards the market on the rise, these readings aren’t near the extreme levels we saw at points in 2018. Start a two-week free trial to Bespoke Institutional to access our full suite of market and economic research.
Bespoke Market Calendar — May 2019
Please click the image below to view our May 2019 market calendar. This calendar includes the S&P 500’s average percentage change and average intraday chart pattern for each trading day during the upcoming month. It also includes market holidays and options expiration dates plus the dates of key economic indicator releases. Start a two-week free trial to one of Bespoke’s three premium research levels.

Morning Lineup – It’s Not Just Alphabet
When a stock is set to open down over $100 in reaction to earnings, people notice, even if that decline is coming off a base of $1,200. That’s exactly the case this morning as shares of Alphabet (GOOGL) are on pace to have their most negative gap down in reaction to earnings since the company’s IPO in 2004. For more on how GOOGL tends to perform following negative reactions to earnings, please check out our Chart of the Day.
Even if it is one of the largest companies in the world, there’s a lot more to the economy than GOOGL, and this morning we are seeing that. Since the close yesterday, nearly 150 companies have reported earnings and 68% of those exceeded EPS forecasts, while a pretty impressive 60% have exceeded revenue forecasts.
We’ve just published today’s Morning Lineup featuring all the news and market indicators you need to know ahead of the trading day. To view the full Morning Lineup, start a two-week free trial to Bespoke Premium.

In yesterday’s Closer report, we highlighted the fact that a number of secondary indices/sectors that outperformed ahead of the December lows did not make new highs yesterday. Another indicator that hasn’t been keeping up with the equity market is high yield spreads. As shown in the chart below where we have plotted high yield spreads on an inverted basis, for well over a week now, we have seen stock prices make new highs but high yield spreads haven’t been keeping up. If the rally, is going to keep going, spreads will need to catch up.

Start a two-week free trial to Bespoke Premium to see today’s full Morning Lineup report. You’ll receive it in your inbox each morning an hour before the open to get your trading day started.
Chart of the Day: Alphabet (GOOG) Set For Biggest Gap Down on Earnings Ever
The Closer — Friendly Data, Golden (Double) Crosses, Secondary Indices Lag, Ratios — 4/29/19
Log-in here if you’re a member with access to the Closer.
Looking for deeper insight on markets? In tonight’s Closer sent to Bespoke Institutional clients, after what was a quiet day of trading, we recap some of today’s economic data points including Personal Spending which rose by the largest amount on an MoM basis since 2009. We also take a look at the miss in today’s release of Personal Income and PCE. Next, with each having seen a golden cross recently, we review how AMZN, AAPL, and the Financial Sector (XLF) perform after golden crosses. We finish by going over four secondary indices; all of which have failed to make new highs. We also look at the ratios of Consumer Discretionary to Consumer Staples and Technology to Utilities.
See today’s post-market Closer and everything else Bespoke publishes by starting a 14-day free trial to Bespoke Institutional today!
The Fed is Not Alone
On Wednesday, while no change is anticipated, the FOMC’s rate decision and Fed Chair Powell’s subsequent presser are sure to be closely watched by markets. Investors will attempt to get a read on the Fed’s tone following some more positive shifts in economic data and equity markets since the beginning of the year. Over the next two weeks, the Fed is not alone though; like earnings and general economic data, it will also be busy on the central bank front.
On Thursday morning, the Bank of England and the Czech National Bank are also due out with rate decisions of their own. Similarly, neither of these two national banks are expected to make any adjustments in their policy rates. But with global risks like Brexit and a soft global backdrop at play, this expected no change is not a guarantee. For the Czech Republic, previous comments by the CNB seemed even slightly hawkish alluding to accelerating inflation making things a tad more difficult to leave rates where they have been. In APAC next Tuesday, we will also get decisions from the Reserve Bank of Australia and the Reserve Bank of New Zealand. Once again no change is expected for either country, but cuts are seen as more likely than hikes.
One week after the FOMC decision, the Central Bank of Brazil is expected to leave the Selic Rate unchanged as well in spite of dovish tones from the chief policymaker. Coming off of a hike to 1% in their last meeting, Norway’s Norgesbank will cap off next week in Central Bank meetings. Institutional members can always stay up to date with central bank tones and rate decisions with our Fedspeak Monitor and Central Bank Monitors. Start a two-week free trial to Bespoke Institutional to access our interactive Fedspeak and Global Central Bank monitor and much more.

Not Just a Busy Week of Earnings
It may be the busiest week of earnings season, but quarterly reports are not the only catalysts to watch. There is also a heavy slate on the US Economic Scorecard over the next week with 72 releases (including indicator releases, Treasury Auctions, and Federal Reserve member speeches) on the docket. You can always keep an eye on these releases using our Economic Monitors. For today, all of the data is now in with some disappointment. Personal Income and the PCE deflator both missed estimates earlier this morning while the Dallas Fed’s Manufacturing Activity index came in below expectations by the widest margin since September of 2011. Meanwhile, Personal Spending on both a real and nominal basis showed solid improvements while beating estimates. In fact, the nominal number was the strongest MoM print since 2009. Real Personal Spending was also strong with the highest MoM increase since early 2017.
Scheduled for tomorrow is the first quarter’s Employment Cost Index and Conference Board sentiment readings for April in addition to a couple of housing data points. Wednesday morning will see the release of both ISM and Markit manufacturing gauges for the month of April ahead of an FOMC meeting later in the day. While no change in rates is anticipated, this meeting will be followed by comments from Fed Chair Powell which will be closely watched for how the Fed has reacted to more positive tones from economic data in the first quarter. On top of the standard weekly Jobless Claims, preliminary numbers for Nonfarm Productivity and Labor Costs are scheduled for Thursday morning before the open. The Nonfarm Payrolls report is out on Friday after last month’s huge rebound of 196K jobs. There are also a number of speeches on Friday by Fed presidents from around the country. Start a two-week free trial to Bespoke Institutional to access our interactive economic indicators monitor and much more.
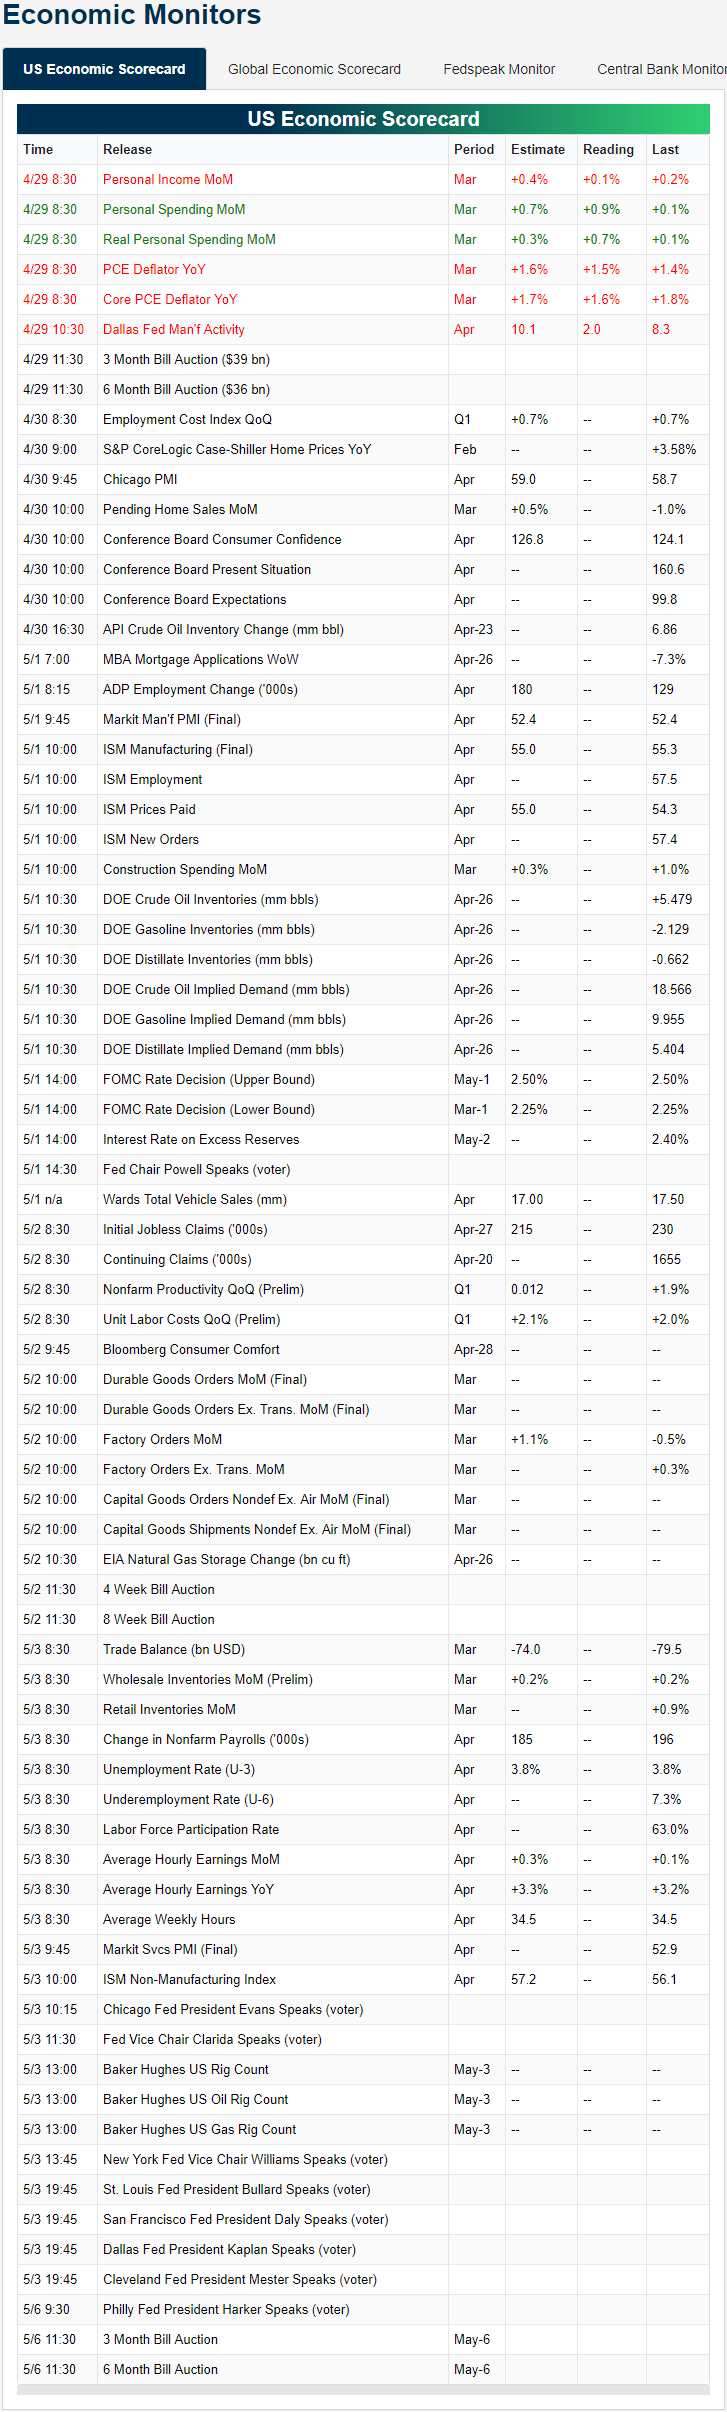
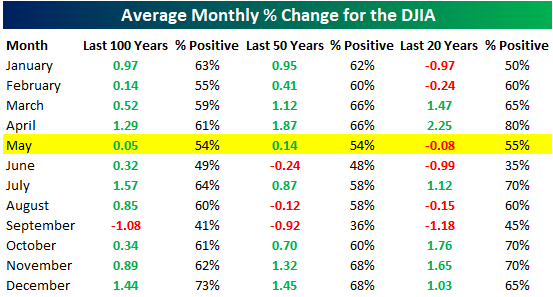
Chart of the Day: May Seasonality + Sell in May
One of the best months of the year from a seasonal perspective (April) is quickly coming to an end, and now investors are set to enter a period of the year that usually produces sub-par returns relative to other periods. There is also a significant difference in performance during the month of May based on whether the stock market is up or down year-to-date through April.
And what about the old saying “Sell in May and Go Away”? Is there any truth to it? Each year the “Sell in May” theory gets trotted out, but we have the data to prove whether investors really should hit the “Sell” button and then wait for six months until November rolls around.
Continue reading this Chart of the Day by starting a two-week free trial to any of our research membership levels.