Bespoke’s Sector Snapshot — Tech Cools
We’ve just released our weekly Sector Snapshot report (see a sample here) for Bespoke Premium and Bespoke Institutional members. Please log-in here to view the report if you’re already a member. If you’re not yet a subscriber and would like to see the report, please start a two-week free trial to Bespoke Premium now.
In this week’s Sector Snapshot, we note weakening market internals and a much-needed rollover for the Technology sector.
To gain access to the report, please start a two-week free trial to our Bespoke Premium package now. Here’s a breakdown of the products you’ll receive.

Sentiment Not Reflecting Declines
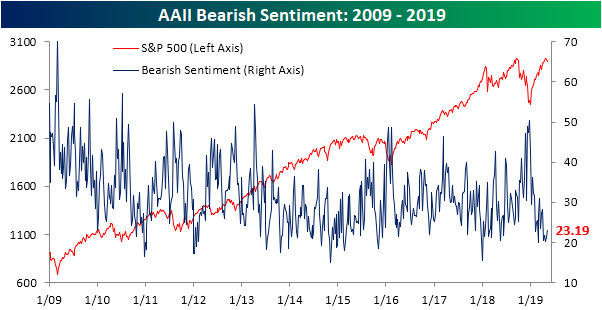
Declines over the past week have been some of the sharpest of 2019, but in spite of this price action, investor sentiment—as measured by the AAII’s weekly investor sentiment survey—has yet to blink. In fact, 43.12% of survey respondents reported bullish sentiment up from 39.02% last week. While still within its normal range by historic standards (within one standard deviation of the historical average of 38.23%), that is the highest degree of bullish sentiment since October 4th of last year, just before the market rolled over. Start a two-week free trial to Bespoke Institutional to access our interactive economic indicators monitor and much more.

Again, counter to what might have been expected, investors have yet to broadly turn more negative on the market as bulls continue to outweigh bears with the bull-bear spread at its widest since late February. But that doesn’t mean bearish sentiment did not pick up at all this week. In fact, it rose to 23.19% from 21.34% last week. This is still well below where it has been for the better portion of the past few years, currently sitting just over 7% below the historical average.
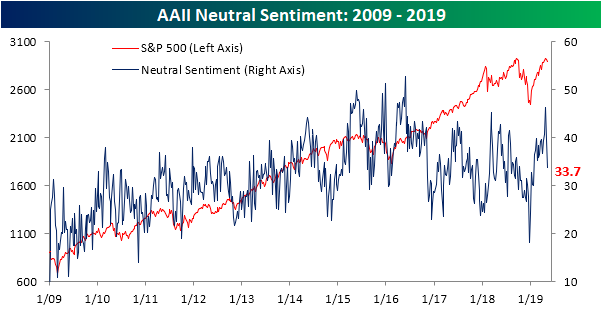
Bulls and bears came entirely from the neutral camp this week as the percentage of investors reporting neutral sentiment continues to collapse, falling to 33.7%. Only two weeks ago neutral sentiment came in at a multi-year high of 46.31%, far above what has historically been observed. That 12.61% drop is the largest two-week decline in neutral sentiment since April 2004 when it fell only slightly more (12.68%) in a two-week span.
A Semi-Serious Decline
One sector that has been hit especially hard this week has been semiconductors. On top of the escalating trade tensions with China of which the sector is highly exposed, weak commentary from Intel (INTC) hasn’t helped. While off its lows of the day, the S&P 500 Semiconductor and Semiconductor Equipment group is still down more than the broader market with a decline of over 1.5% as of the early afternoon. If that weakness holds into the close, it will mark the fourth straight day of 1%+ declines. To put that kind of streak into perspective, since the lows of the financial crisis, there have only been three other four-day stretches where the group showed declines of a similar magnitude and the last time the group had a longer streak was 15 years ago in April 2004! The most recent of the three prior four-day streaks of 1%+ declines was back in August 2015.
As far as the semiconductor group’s price chart is concerned, the picture isn’t any prettier. For now, today’s drop has pushed the sector below its 50-DMA for the first time since January. In the process, the group also sliced right through what was potential support at levels that acted as support in the late summer/ early fall of 2018. Start a two-week free trial to Bespoke Institutional to access our interactive economic indicators monitor and much more.

Initial Jobless Claims Remain Higher
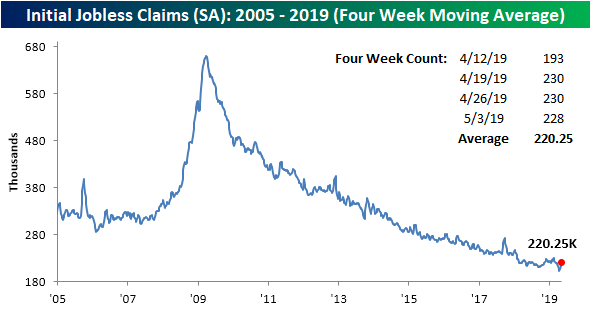
After coming in at 230K two weeks in a row, seasonally adjusted Initial Jobless Claims fell this week down to 228K. While off of the highest level in recent weeks, this small 2K decline leaves claims still near the upper end of where they have recently been. This comes after two straight weeks in early April where the indicator came in at its lowest level in 50 years. Though it has not made new lows, this was the 69th week with claims below 250K and the 218th week below 300K, so claims still appear healthy.
Start a two-week free trial to Bespoke Premium to access our interactive economic indicators monitor and much more.

With the first week of April, when claims came in at a 50-year low of 196K (which has since been revised up to 204K), rolling off of the four-week moving average, the less volatile look at claims has risen to 220.25K from 212.5K last week. This uptick is pretty predictable given the addition of higher readings over the past few weeks. Looking towards next week, it is very plausible that another uptick will be seen as the last of the April lows again rolls off the average. While the moving average has also yet to make a new low since its 50-year lows last month, like the seasonally adjusted number, it still remains at solid levels and is not flashing signs of significant moves higher.
Non-seasonally adjusted (NSA) claims were pretty flat this week with a decline of only 1.3K to 203.5K. While this is still a very healthy reading well below the average for the current week of the year since 2000 (303.5K), there has been one trend in the NSA data to make note of. This week marked the eighth time this year that the NSA number saw a year-over-year increase. That is the highest number of weeks with a YoY increase for a year since 2016 when there were ten throughout the whole year. This week also makes 2019 tied with 2013 for the second highest number of such increases in a year since the crisis. Again, 2013 saw eight over the span of all 52 weeks. Given that it is only May, the last time claims rose as many times by this point in the year was 2009. Fortunately, things are still better than in 2009 as every single week up through the end of October saw a YoY increase that year. In other words, the high frequency of increases versus one year ago in the NSA number, while it could still be much worse, is a bit of a concern as it could be showing last year as a potential bottom for claims. But the fact that deterioration has not been rapid is reassuring.
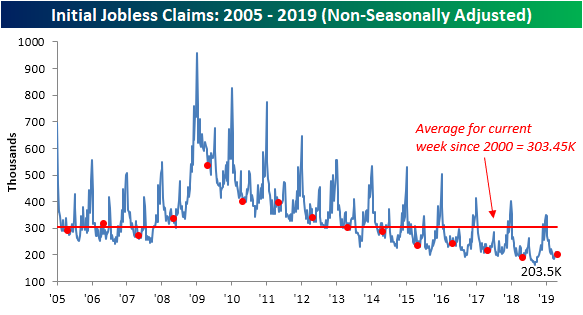
Chart of the Day: Worst Back-To-Back Earnings Ever
Morning Lineup – Semi-Concern
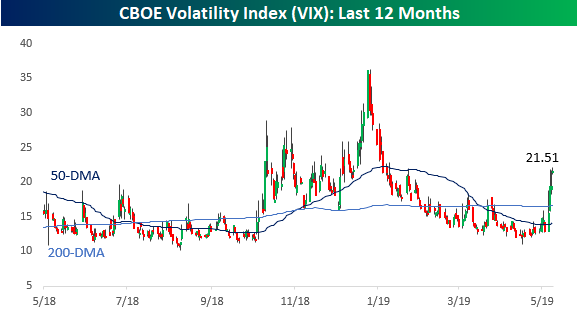
The usual headlines with regards to China are circulating this morning, and there’s more where that came from for the next two days as a Chinese delegation arrives in Washington today. Further complicating things, North Korea launched its second missile test in less than a week overnight which just happened to coincide with a visit from a US envoy to South Korea. Geopolitics are no doubt starting to heat up, and so is the VIX as it poised to close above 20 for the first time since early January!
Outside of geopolitics, there’s also a fair amount of US economic data today after a number of days this week with few or no reports. PPI for April was inline with expectations at the headline level (0.2% m/m) but weaker than expected at the core level (0.1% vs 0.2%). Jobless claims, meanwhile, came in higher than expected at 228K versus estimates for a reading of 220K. On the earnings front, we saw a little bit of a switch this morning as the pace of revenue beats is actually ahead of the pace of EPS beats since yesterday’s close. Of the over 150 companies that have reported since Wednesday’s close, just 56% have exceeded EPS forecasts by 59% have beat top-line forecasts. It would have been preferable to see the switch take place as a result of an improvement in the revenues beat rate rather than a big drop in the EPS beat rate.
We’ve just published today’s Morning Lineup featuring all the news and market indicators you need to know ahead of the trading day. To view the full Morning Lineup, start a two-week free trial to Bespoke Premium.

As shown below, the VIX has seen quite a surge in the last week. Last Friday, it wasn’t even a teenager and today it’s over the legal drinking age. My how they grow up!
Start a two-week free trial to Bespoke Premium to see today’s full Morning Lineup report. You’ll receive it in your inbox each morning an hour before the open to get your trading day started.
The Closer — Price Action, Sector Performance, Carbon Intensity, Fund Flows — 5/8/19
Log-in here if you’re a member with access to the Closer.
Looking for deeper insight on markets? In tonight’s Closer sent to Bespoke Institutional clients, we review the S&P 500’s price action over the past few sessions, highlighting the large amount of buying from open to close. We also take a look at a few cyclical sector’s recent performance versus defensive counterparts. With little in the way of major economic data, we then turn our attention to the relationship between carbon emissions and economic growth. We finish tonight’s report with a look at ICI Fund Flows continued outflows from equities and EIA data showing a large drawdown in crude inventories.

See today’s post-market Closer and everything else Bespoke publishes by starting a 14-day free trial to Bespoke Institutional today!
VIX Positioning: It’s Different This Time
With the drop in stock prices over the last few days, equity markets have fallen and the VIX index – a measure of volatility implied by short-term options on S&P 500 stocks – has surged, as it typically does when the market drops. Last night we discussed the situation in our daily post-market note, The Closer. As shown in the chart below, this is the third time the VIX has surged over the last 18 months, with the first being a huge uptick relative to a more modest equity price decline than the huge drop in Q4. That first spike was driven by a collapse of products designed to profit from low or falling volatility.
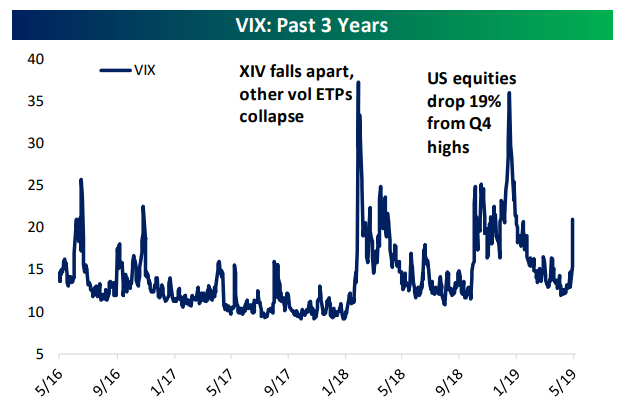
Similar to the last drop, speculators in volatility futures have built up large short positions in volatility recently. Of the outstanding open interest in VIX-linked futures, about 40% is net short exposure for traders classified as speculators in the CFTC’s Commitment of Traders report. Are we due for another stratospheric move in the VIX as weak hands are shaken out of VIX future shorts?

While a further rise in implied volatility isn’t something we can rule out, this time does look pretty different from the early 2018 volatility market blow-up. First of all, exchange traded products (ETPs) that are exposed to the VIX are very long volatility. In 2017, a huge short position had built up via these ETPs, with a VIX short market cap of almost $4bn. At the time, long volatility ETPs had a combined market cap of less than $1bn. Now, the market cap imbalance is completely reversed: short vol products have only about $500mm in market cap while long vol products are north of $3.5bn. So retail traders – the primary customer base for this type of product – are positioned in the opposite manner. Furthermore, total VIX futures exposure has fallen dramatically. Back in September of 2017, there were more than 704,000 VIX futures open, with more than 650,000 outstanding in mid-January of 2018. Today, that number is 36% below the peak and 31% below where things stood in January of 2018. So not only are retail traders positioned the opposite way, total market size and therefore exposure to the VIX has dropped considerably. Start a two-week free trial to Bespoke Institutional to access The Closer and all of our other market analysis.
Fixed Income Weekly – 5/8/19
Searching for ways to better understand the fixed income space or looking for actionable ideals in this asset class? Bespoke’s Fixed Income Weekly provides an update on rates and credit every Wednesday. We start off with a fresh piece of analysis driven by what’s in the headlines or driving the market in a given week. We then provide charts of how US Treasury futures and rates are trading, before moving on to a summary of recent fixed income ETF performance, short-term interest rates including money market funds, and a trade idea. We summarize changes and recent developments for a variety of yield curves (UST, bund, Eurodollar, US breakeven inflation and Bespoke’s Global Yield Curve) before finishing with a review of recent UST yield curve changes, spread changes for major credit products and international bonds, and 1 year return profiles for a cross section of the fixed income world.
In this week’s report we take a look at the evolution of real yields since before the financial crisis.

Our Fixed Income Weekly helps investors stay on top of fixed income markets and gain new perspective on the developments in interest rates. You can sign up for a Bespoke research trial below to see this week’s report and everything else Bespoke publishes free for the next two weeks!
Click here and start a 14-day free trial to Bespoke Institutional to see our newest Fixed Income Weekly now!
Markets Keep Pushing the FOMC
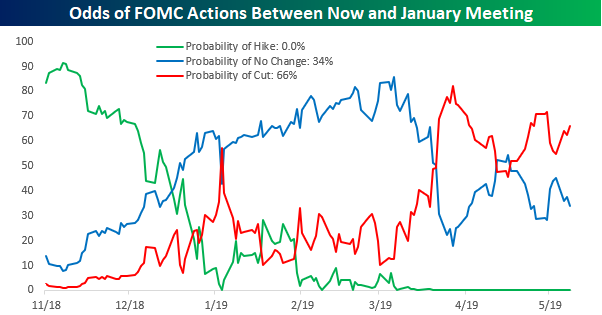
Heading into last week’s FOMC meeting, futures markets were pricing in close to an 80% chance of at least one rate cut from the FOMC between now and the January 2020 meeting in less than eight months. In his press conference following that meeting, Fed Chairman Jay Powell did his best to reset market expectations by arguing that recent low inflation readings are transitory and by saying that the FOMC wasn’t currently leaning in one direction or the other with respect to its next move on rates.
The result of Powell’s non-dovish remarks (but definitely not hawkish either) was a relatively sharp reversal in equity prices and a re-pricing in the futures markets regarding the likelihood of rate cuts between now and January. By last Friday, the market was only pricing in a slightly better than 50-50 chance of a rate cut by the January 2020 meeting.
In the span of the last three trading days (and a Sunday tweetstorm from the President regarding China), though, traders in Fed Funds futures are once again back to pressing their bets on the possibility of rate cuts. As of this morning, those odds have moved back up to 66%.
Recent moves in the yield curve are also starting to suggest that the FOMC may have to blink. After a brief inversion in late March, the yield curve, which we measure as the spread between the yields on the 10-year and 3-month treasuries, started to steepen again in April, which likely caused a sigh of relief in the halls of the Federal Reserve. Over the last few days, though, the flattening trend has returned with vigor and as of this morning is just one basis point from inversion again. If that happens, there’s a good chance that it won’t sit well with markets.Start a two-week free trial to Bespoke Institutional to access all of our market, earnings, economic, and FOMC analysis.