Chart of the Day – Japan at New Highs But Little Changed Over the Last 35 Years
Economic Optimism Returns Among Small Businesses
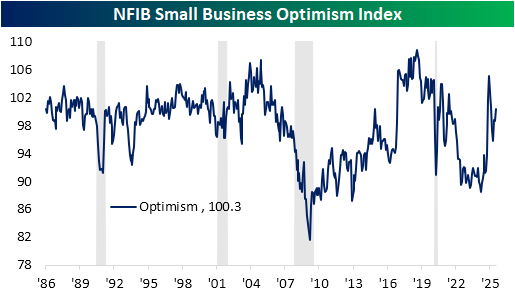
This morning’s release of the NFIB’s Small Business Optimism Index saw a return in positivity. After peaking post-election at 105.1 in December, the headline index went on to fall to a low of 95.8 in April and has since erased about half of that decline. At 100.3 in July, it is back above the historical median and at the highest level since February.
As shown in the table below, breadth throughout the sub-indices of this month’s report was solid, with five inputs to the optimism index rising versus two falling and the remaining two going unchanged month over month. Categories that were not inputs to that headline number saw weaker breadth. Of those, five of the eight were lower month over month, including a couple of bottom decile declines from categories like higher prices and compensation.
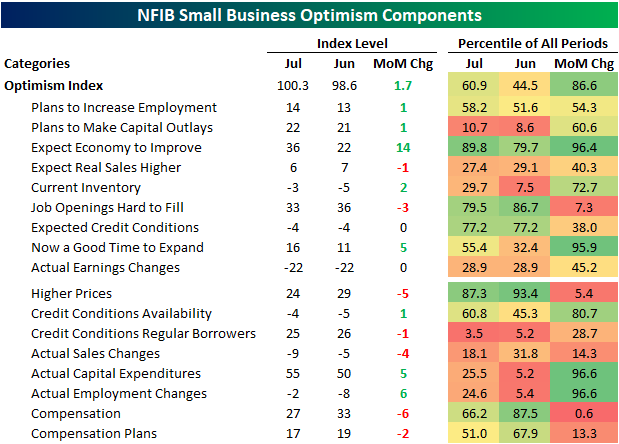
Of the rising categories, two of the most notable were for expectations for the economy to improve and evaluating now as a good time to expand. For the former, the index surged 14 points month over month to 36. While that is only the highest reading since February and the largest one-month gain since December, the monthly gain ranks in the 95th percentile of all monthly moves on record. Similarly, the 5-point jump in seeing now as a good time to expand also ranks highly in the 95th percentile of monthly changes for that index.
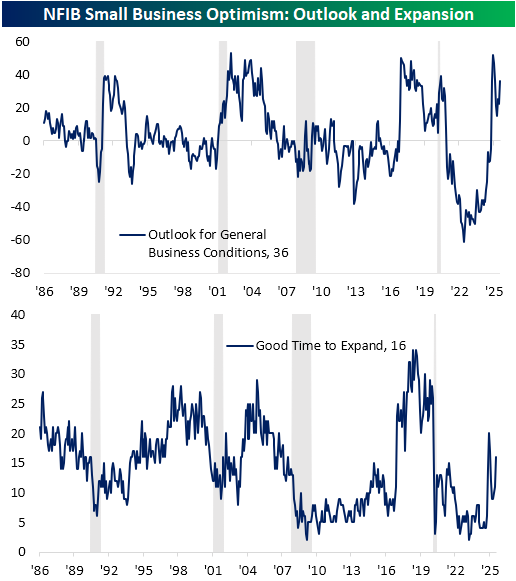
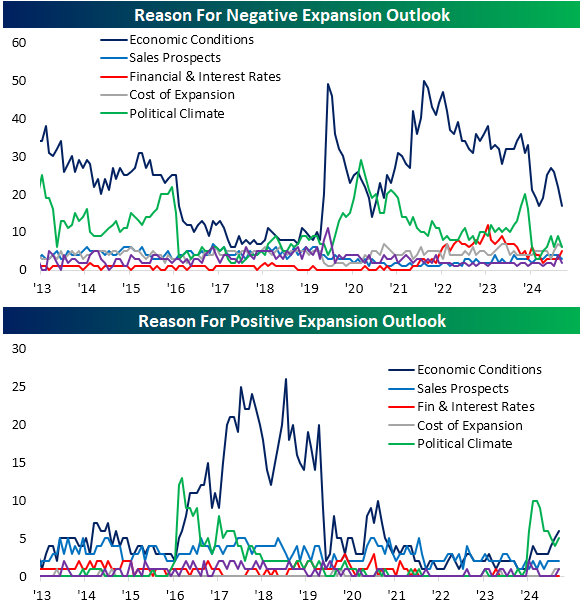
Those two indices appear to be correlated. In other words, when small businesses see the economy as healthier, they will, in turn, see it as a good time to expand. This comes up when looking at the given reasons for different expansion outlooks. For both positive and negative outlooks, economic conditions were the leading reason given as each one was at or tied with multi-year highs and lows. Additionally, as we often note, the NFIB survey has the downside of being politically sensitive. Typically, a Republican administration translates into stronger sentiment and vice versa. With regards to positive expansion outlooks, the political climate is the second most popular reason, and current levels—even though they are off recent highs—are around some of the most elevated readings since the first half of the first Trump administration.
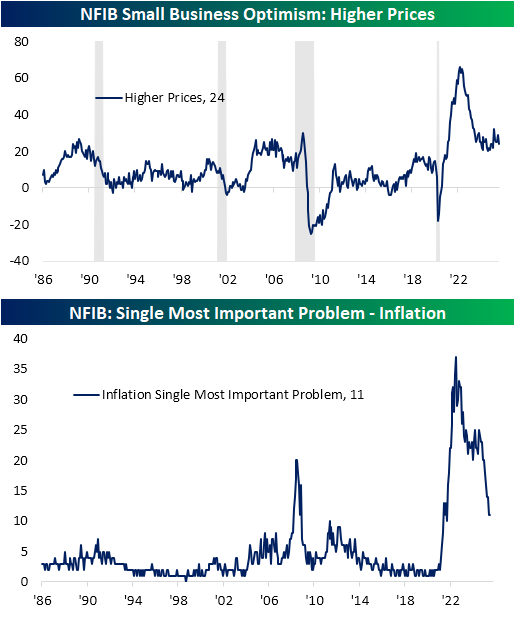
As for indices that declined, one of the bigger drops was for higher prices. While it may not jump out in looking at the chart of the index, that five-point decline ranks as a 5th percentile monthly move for its history, and current levels remain in the middle of the past couple of years’ range since the peak inflation readings in 2021-2023. The reading that points to more substantial progress is with regard to the percentage of firms reporting inflation as their biggest problem. That reading is down to 11%, unchanged month over month, following a number of steep drops in the past year.
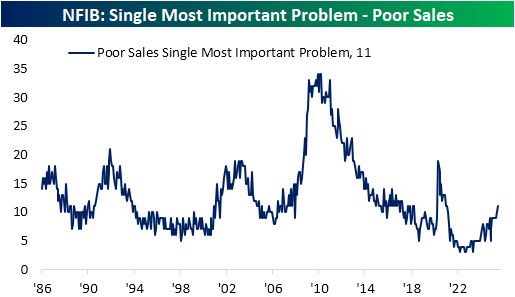
Looking across other most commonly reported problems, an equal share of respondents highlighted poor sales. That is the highest reading since February 2021, when that reading was declining off of pandemic highs. While that may sound concerning, we would note it is not far off the average reading (10.5%) observed in the five years from 2014 through 2019.

Bespoke’s Morning Lineup – 8/12/25 – Micro Caps Have Their Day
See what’s driving market performance around the world in today’s Morning Lineup. Bespoke’s Morning Lineup is the best way to start your trading day. Read it now by starting a two-week trial to Bespoke Premium. CLICK HERE to learn more and start your trial.
“Reading the record, it is striking how many calamities that I anticipated did not in fact materialise.” – George Soros

Below is a snippet of commentary from today’s Morning Lineup. Start a two-week trial to Bespoke Premium to view the full report.
After a quiet day yesterday, futures aren’t doing much this morning either as investors await the release of July CPI. European markets started the day higher but have been selling off throughout the day (sound familiar?), and Asia had a mixed session, although Japan rallied more than 2% after being closed for trading on Monday. While Japanese stocks traded higher, there was literally no trading in Japan’s 10-year JGBs. That was the first time that had happened since March 2023.
July CPI came in right in line with expectations as the headline reading increased 0.2% and core rose 0.3%. On a y/y basis, headline CPI was a tenth weaker than expected at 2.7% while the core reading was a tenth higher than expected (3.1%). The initial reaction to the move was slightly lower yields and higher stock prices.
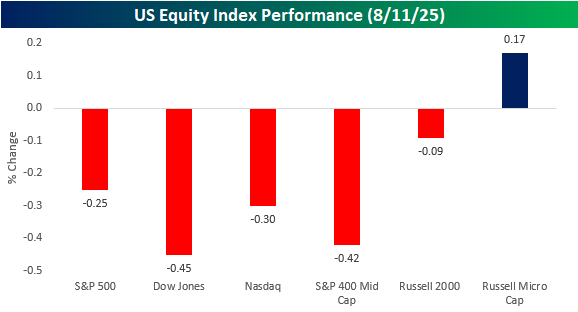
It’s hard to read too much into market activity on a quiet day in August, but the trend of intraday weakness continued to start the week as the S&P 500, as measured by SPY, closed lower than it opened for the tenth time in the last fifteen trading days. When the bell finally rang, the S&P 500 finished down 0.25%, the Dow was down 0.45%, while the Nasdaq fell 0.30%. Besides those major large-cap indices, mid-caps slumped 0.42% while small caps held up relatively well with a decline of 0.09%. The only small ray of sunshine yesterday was in the Russell Microcap Index, which finished the day 0.17% higher. When we say small, we mean it, though. The combined market cap of the companies in the index is just $426 billion, which is smaller than Netflix (NFLX), and the average market cap of companies in the index is under $400 million, with an M!
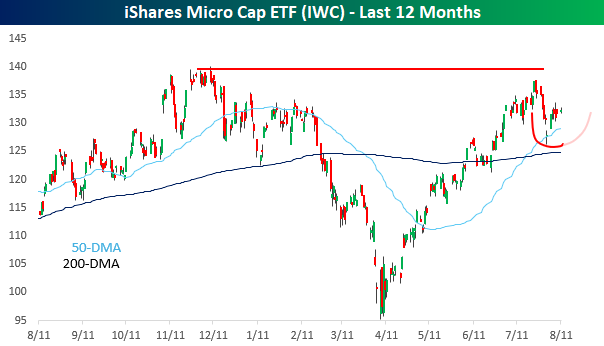
Looking at the performance of micro-caps, as measured by the iShares Microcap ETF (IWC), after testing the Q4 highs in late July, they pulled back to the 50-day moving average, where they bounced to kick off August. It’s still early, but if the bounce holds, the index could be rounding out the right side of a cup and handle formation.
The Closer – Growth and Value, EV Efficiency, Housing – 8/11/25
Log-in here if you’re a member with access to the Closer.
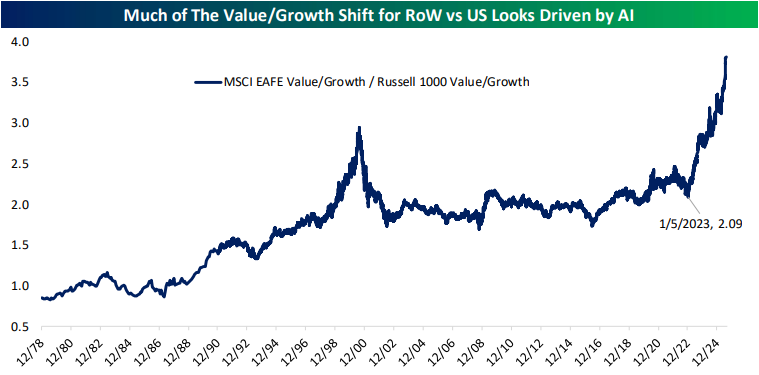
Looking for deeper insight into markets? In tonight’s Closer sent to Bespoke Institutional clients, we start off by looking at the outperformance of value versus growth overseas and compare that to the two factors’ performance in the US. (page 1). We then discuss the announcement from Ford (F) regarding their manufacturing (page 2). We finish with updates on the latest housing delinquency (page 3) and inventory data (pages 4 and 5).
See today’s full post-market Closer and everything else Bespoke publishes by starting a 14-day trial to Bespoke Institutional today!
The Rich get Richer
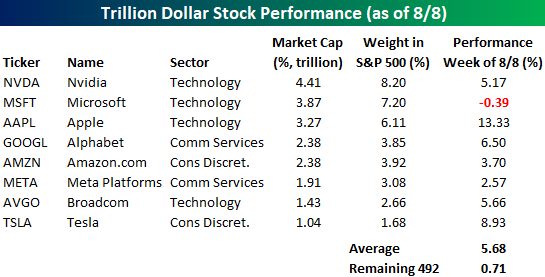
The mega-cap stocks took the baton last week and drove the market higher. While the S&P 500 was up about 2.4%, the 492 stocks in the index with market caps of less than a trillion dollars were up an average of just 0.71%. Meanwhile, the eight $1+ trillion dollar stocks were up an average of 5.7%, led higher by stocks like Apple (AAPL) and Alphabet (GOOGL) with gains of more than 5%. Weren’t these two stocks that the street had written off for dead just a couple of weeks ago?
Collectively, the eight $1+ trillion stocks account for over 35% of the S&P 500. These are, and will continue to be, the main drivers of the market.
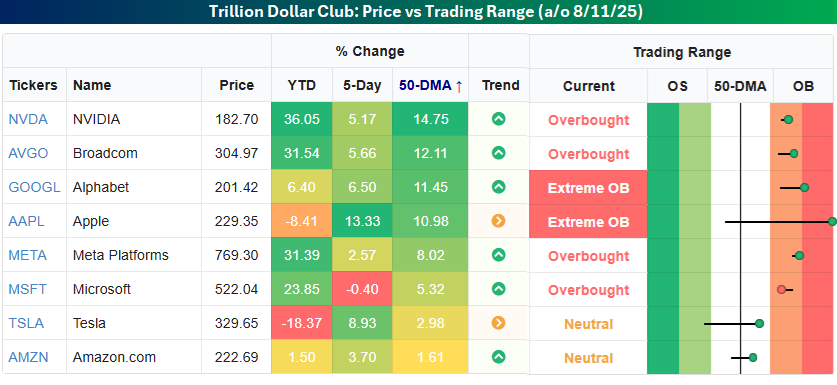
Some of the trillion dollar stocks have gotten quite extended, with Nvidia (NVDA), Broadcom (AVGO), Alphabet (GOOGL), and Apple (AAPL) now trading more than 10% above their 50-day moving averages.
In Thursday’s Morning Lineup, we noted the dispersion in YTD performance using the Dow Jones Industrial Average as an example. Within the trillion-dollar stocks, we’ve seen the same degree of divergence with more than 50 percentage points separating the group’s biggest YTD winner and loser.
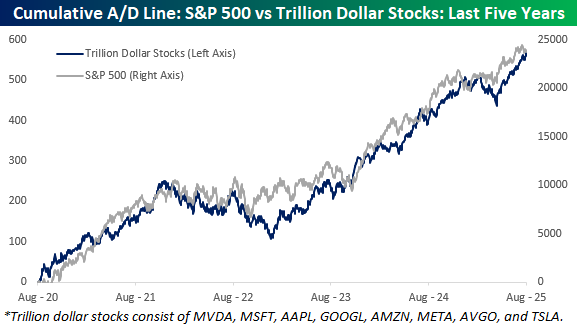
Since the trillion-dollar stocks will have such a large say in how the market moves from here, we wanted to check up on the group’s breadth compared to the S&P 500. The chart below compares the S&P 500’s cumulative A/D line to the cumulative A/D line of the trillion-dollar stocks over the last five years. For the most part, they have tracked each other very closely, and both remain near record highs, so there’s been no major divergence between the mega-caps compared to the rest of the market.
Zooming in on the last year shows similar patterns in both cumulative A/D lines, but with more granularity, you can also see some zigs in the S&P 500’s cumulative A/D line when the cumulative A/D line of the trillion-dollar stocks zags. Late last year, the S&P 500’s cumulative A/D line started to roll over about a month before the trillion-dollar stocks, and then in the Spring, the S&P 500’s A/D line bottomed a couple of weeks before the trillion-dollar stocks. That brings us to last week. As mentioned above, while the S&P 500 was up sharply last week, the majority of the gains were the result of the big moves higher in the trillion-dollar stocks. That divergence was also evident in the cumulative A/D lines as the S&P 500 finished the week well off its 7/25 high, while the one for the trillion-dollar stocks hit a new high. At this point, it’s just a modest divergence, but the last two divergences began modestly as well before turning into more extended moves.
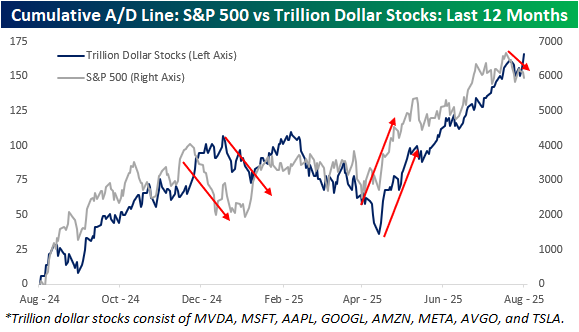
Chart of the Day: CPI, Gaps Up, Tame Sentiment, Flat Gas
Bespoke’s Morning Lineup — 8/11/25
See what’s driving market performance around the world in today’s Morning Lineup. Bespoke’s Morning Lineup is the best way to start your trading day. Read it now by starting a two-week trial to Bespoke Premium. CLICK HERE to learn more and start your trial.
“As I grow older, I pay less attention to what men say. I just watch what they do.” – Andrew Carnegie
Below is a snippet of commentary from today’s Morning Lineup. Start a two-week trial to Bespoke Premium to view the full report.
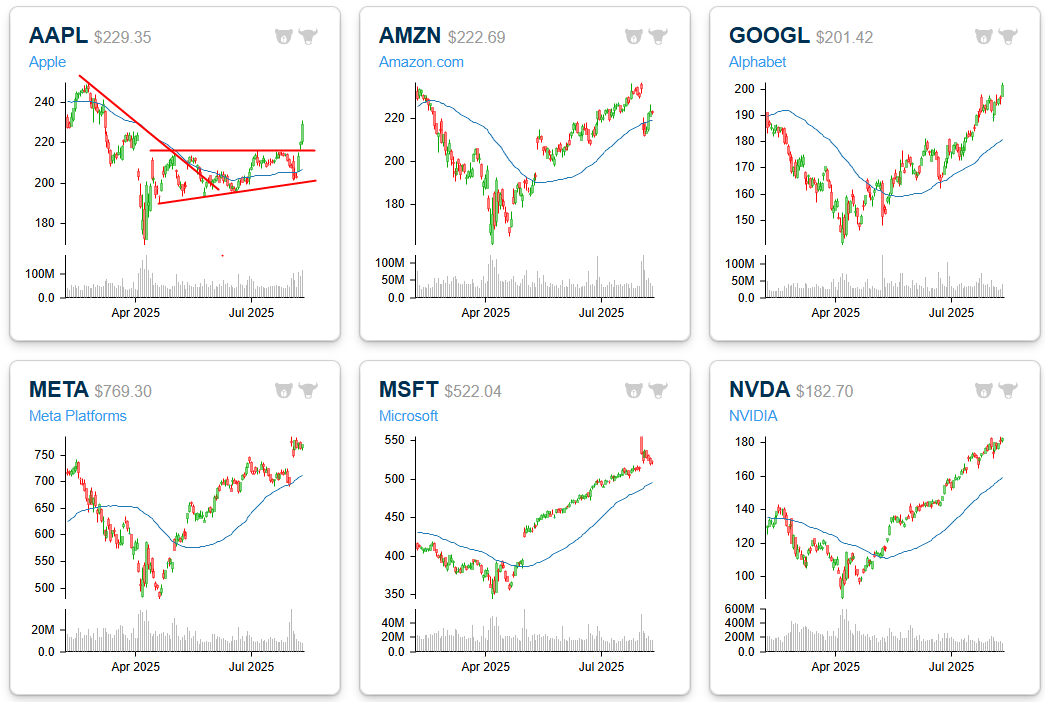
Below are six-month price charts of the mega-caps. A few months ago, pretty much all of these charts were in downtrends, but now that Apple (AAPL) has recovered and broken above resistance, all six look to be trending higher.
Brunch Reads – 8/10/25
Welcome to Bespoke Brunch Reads — a linkfest of some of our favorite articles over the past week. The links are mostly market-related, but there are some other interesting subjects covered as well. We hope you enjoy the food for thought as a supplement to the research we provide you during the week.
The Collapse of Cleopatra: On August 10, 30 BC, (some cite August 12), Cleopatra VII, the last pharaoh of Egypt, died, most likely by suicide. Surrounded by Roman forces in Alexandria after the defeat of her ally and lover Mark Anthony, she chose death over the humiliation of being paraded through Rome after Octavian’s victory. Ancient accounts differ on the method; some describe a venomous asp smuggled into her chambers, others a fast-acting poison concealed in a hairpin, but all agree she died in her royal finery. Her death marked the end of the Ptolemaic dynasty and the absorption of Egypt into the Roman Empire.
Born in 69 BCE, Cleopatra was a descendant of the Macedonian Greek rulers who had governed Egypt since the time of Alexander the Great. Unlike her predecessors, she embraced the Egyptian language and traditions, styling herself as the goddess Isis in human form. She took the throne at 18, outmaneuvering rivals in her own family to rule first alongside her father, then her brothers, and eventually alone. Politically shrewd and multilingual, she forged alliances with Julius Caesar and later Mark Antony, not just through romance but through calculated statecraft that kept Egypt independent for nearly two decades as Rome’s power grew.
Cleopatra understood the power of image, orchestrating lavish displays and cultivating an aura of divinity to reinforce her legitimacy. Under her leadership, Egypt’s wealth and grain exports remained vital to Rome, giving her leverage on the world stage. But when Antony’s forces lost to Octavian at the Battle of Actium in 31 BCE, her position collapsed.

Health & Wellness
The One Quality Most ‘Super-Agers’ Share (NYT)
Northwestern researchers have spent 25 years studying “super-agers,” people over 80 with memory on par with someone decades younger, and found one common trait: strong social connections. These highly extroverted seniors, like Holocaust survivor Ralph Rehbock and Cubs fan Leigh Steinman, tend to maintain larger brain volumes, more von Economo neurons tied to social behavior, and better-preserved attention and memory function. While genetics and biology likely play a major role, scientists say socializing may protect against age-related brain decline, helping keep minds sharp well into old age. [Link]
Continue reading our weekly Brunch Reads linkfest by logging in if you’re already a member or signing up for a trial to one of our two membership levels shown below! You can cancel at any time.

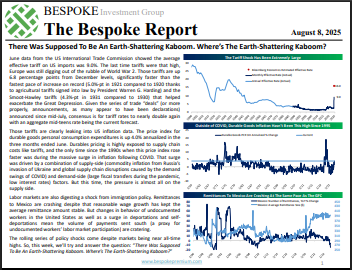
The Bespoke Report – 8/8/25 – There Was Supposed To Be An Earth-Shattering Kaboom. Where’s The Earth-Shattering Kaboom?
To read our weekly Bespoke Report newsletter and access everything else Bespoke’s research platform offers, start a two-week trial to Bespoke Premium. This week, we look at why the market has been so bulletproof despite all the shocks it’s been given from headlines this year. From economic fundamentals to earnings data, we explain the backdrop while also surveying the historic decline in the dollar, weak commodity prices, US equity market sentiment, and some of the most interesting tidbits from earnings releases we saw this week. Give it a read!

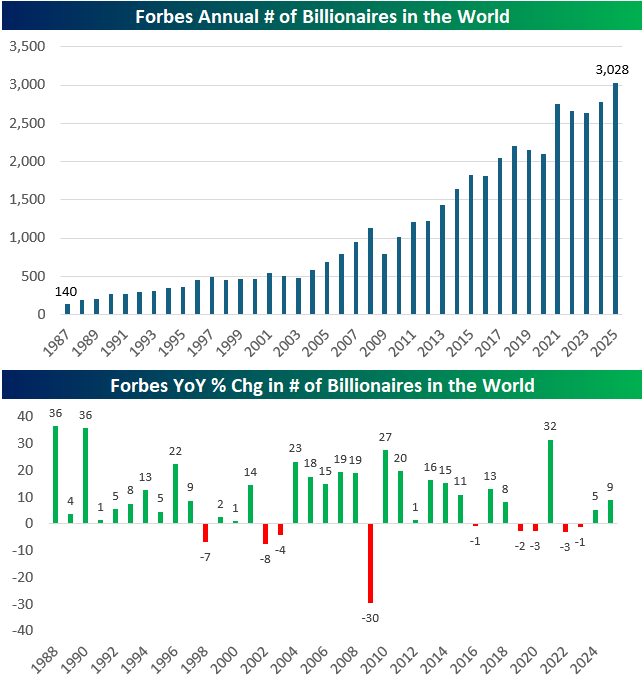
The World’s 3,028 Billionaires
The growth in the number of billionaires over the past four decades is nothing short of extraordinary. Back in 1987, Forbes counted just 140 billionaires globally. As of 2025, that number has surged to a staggering 3,028, a 21x increase. This rise has been largely consistent, interrupted only during periods of financial turbulence. The Dot Com crash in the early 2000s and the Great Financial Crisis in 2009 triggered sharp declines, including a record 30% drop in 2009. More recently, 2022 and 2023 saw modest pullbacks in billionaire numbers, reflecting broader market volatility. But the trend remains unmistakable: billionaire status is becoming more common in an increasingly capital driven world.
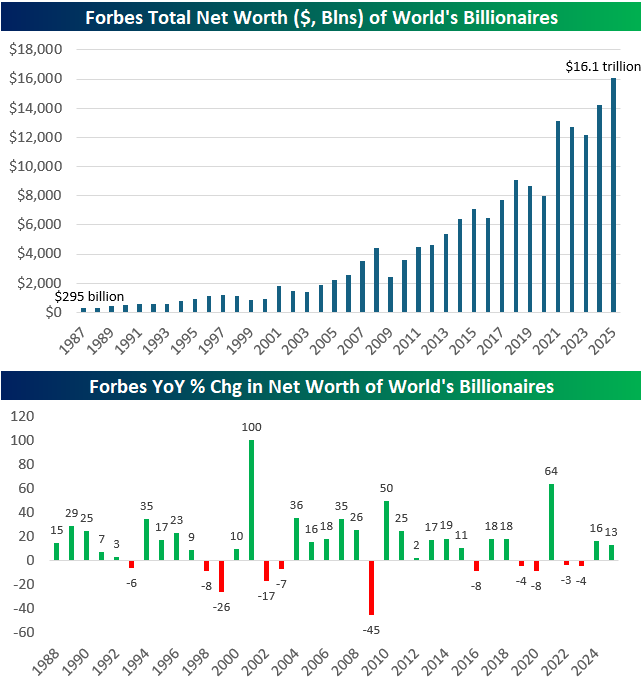
While the number of billionaires has soared, their collective net worth has grown even faster. In 1987, the global billionaire club was worth a combined $295 billion. Today, their net worth has ballooned to $16.1 trillion, more than a 50x increase. The 2009 crash wiped out nearly half of billionaire wealth (-45%), but recoveries have been swift and powerful. For instance, in 2021 alone, billionaire net worth rose by a massive 64% as markets roared back from COVID lows. Even in recent years, with inflation, rate hikes, and geopolitical stress, total billionaire wealth has continued to grow, up 13% in 2024 and another 16% in 2025. It’s clear that the billionaire class not only survives economic storms, it often thrives in their aftermath.
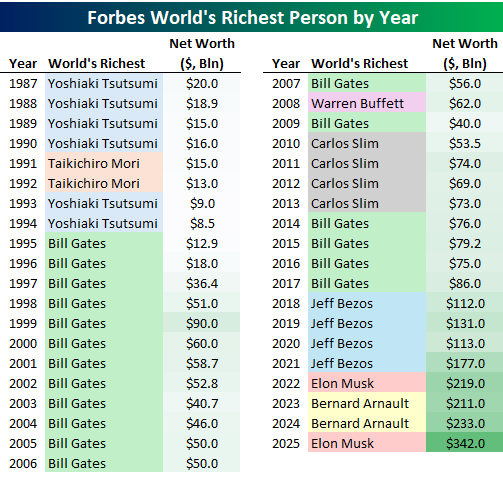
Tracking the richest person in the world each year offers a fascinating glimpse into broader economic and technological trends. The late 1980s and early 1990s were dominated by Japanese real estate moguls like Yoshiaki Tsutsumi and Taikichiro Mori, reflecting Japan’s then-surging property boom. But by the mid-1990s, Bill Gates took over and stayed on top for 13 out of 14 years, riding the explosive growth of Microsoft and the personal computing revolution.
The 2010s saw Carlos Slim ascend amid the rise of telecom and infrastructure in emerging markets. But the real shift came with the tech titans of the 2010s and 2020s: Jeff Bezos led the way during Amazon’s global expansion, and Elon Musk rocketed to the top during the EV and space boom, now commanding a mind-bending $342 billion fortune. The occasional lead by Bernard Arnault, representing luxury goods via LVMH, shows how wealth today isn’t just tech-driven, it’s increasingly global, diversified, and tied to brand power, scale, and platforms.