Fixed Income Weekly – 7/24/19
Searching for ways to better understand the fixed income space or looking for actionable ideas in this asset class? Bespoke’s Fixed Income Weekly provides an update on rates and credit every Wednesday. We start off with a fresh piece of analysis driven by what’s in the headlines or driving the market in a given week. We then provide charts of how US Treasury futures and rates are trading, before moving on to a summary of recent fixed income ETF performance, short-term interest rates including money market funds, and a trade idea. We summarize changes and recent developments for a variety of yield curves (UST, bund, Eurodollar, US breakeven inflation and Bespoke’s Global Yield Curve) before finishing with a review of recent UST yield curve changes, spread changes for major credit products and international bonds, and 1 year return profiles for a cross section of the fixed income world.
In this week’s report we review front end inversions around the world that haven’t led to a widening in credit spreads.

Our Fixed Income Weekly helps investors stay on top of fixed income markets and gain new perspective on the developments in interest rates. You can sign up for a Bespoke research trial below to see this week’s report and everything else Bespoke publishes free for the next two weeks!
Click here and start a 14-day free trial to Bespoke Institutional to see our newest Fixed Income Weekly now!
Bespoke’s Global Macro Dashboard — 7/24/19
Bespoke’s Global Macro Dashboard is a high-level summary of 22 major economies from around the world. For each country, we provide charts of local equity market prices, relative performance versus global equities, price to earnings ratios, dividend yields, economic growth, unemployment, retail sales and industrial production growth, inflation, money supply, spot FX performance versus the dollar, policy rate, and ten year local government bond yield interest rates. The report is intended as a tool for both reference and idea generation. It’s clients’ first stop for basic background info on how a given economy is performing, and what issues are driving the narrative for that economy. The dashboard helps you get up to speed on and keep track of the basics for the most important economies around the world, informing starting points for further research and risk management. It’s published weekly every Wednesday at the Bespoke Institutional membership level.
You can access our Global Macro Dashboard by starting a 14-day free trial to Bespoke Institutional now!

Trend Analyzer – 7/24/19 – Micro-Caps (IWC) Enter A Downtrend
Most of the major index ETFs are relatively unchanged within their recent trading ranges over the last week. Mid-caps have pressed higher on some of the strongest gains over the past week, leading them to rejoin large-caps in overbought territory. Meanwhile, small-caps like the Core S&P Small-Cap (IJR) and Russell 2000 (IWM) continue to lag behind and are still only at neutral levels. While IWM and IJR have not done great, the Micro-Cap (IWC) has lagged by a much larger margin. Now with the smallest YTD gain of the major index ETFs, IWC has dropped through the 50-DMA on a 1.61% decline in the past week. No other major index ETF currently trades below the 50-DMA or has seen nearly as large of a decline, and IWM, IJR, and the Russell Mid-Cap (IWR) are the only others down versus last week. More importantly, our Trend Analyzer is now showing that IWC is in a downtrend.
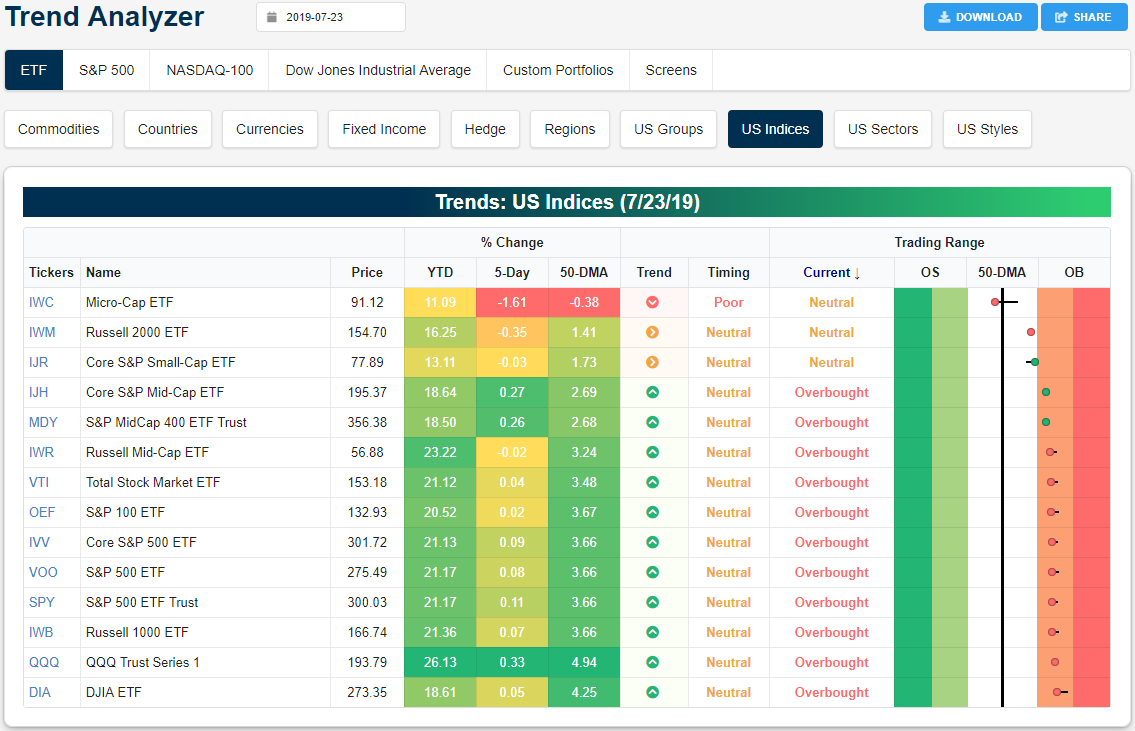
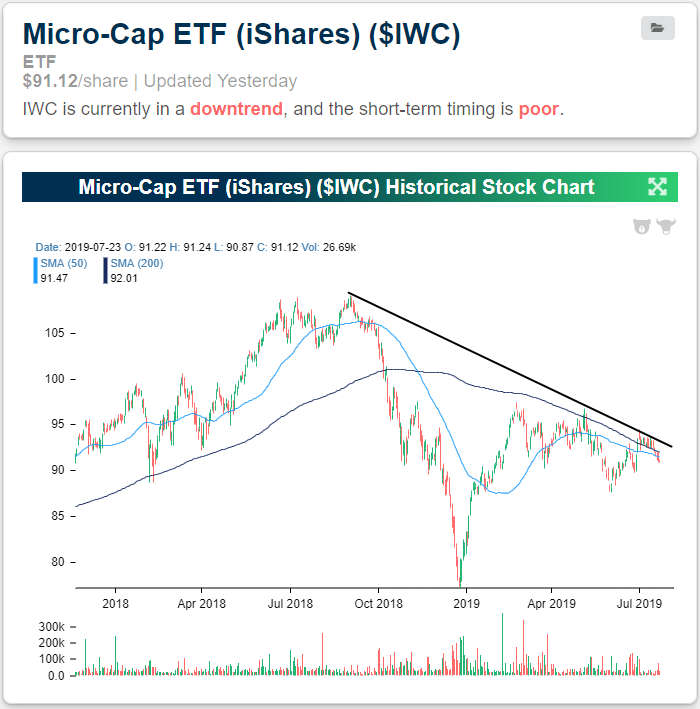
Peering at the chart for IWC, that downtrend has become more apparent. After reaching its highs almost one year ago, IWC fell sharply down to its December lows. After a significant rally in the beginning of the year, it ran into resistance around late 2018 highs and has been stuck in consolidation ever since. Earlier this month, IWC managed to close and hold above the 200-DMA for the longest span of time since last year, but it never made a considerable move higher. In the past two weeks, it has begun to turn lower running into resistance at its downtrend line; reaffirming a longer-term downtrend. Start a two-week free trial to Bespoke Institutional to access our interactive economic indicators monitor and much more.
Bespoke’s Morning Lineup – Mixed Earnings, Weak Europe PMI Data
Earnings results were once again strong in Europe overnight, with reporting companies generally gaining. Weak economic data has stocks trading higher as markets assume it means larger amounts of ECB easing, while this morning’s US earnings numbers are more mixed than we’ve seen lately. The mixed earnings in the US and news after the close yesterday of a DoJ investigation into the large technology companies have futures in the US indicating a moderate decline at the open. Rates are down, commodities are mixed, and credit is green.
Read today’s Morning Lineup to get caught up on news and stock-specific events ahead of the trading day including a discussion of earnings results from the US and Europe overnight and the latest Manufacturing PMI for July. You may want to hold your nose.
Bespoke Morning Lineup – 7/24/19

Start a two-week free trial to Bespoke Premium to see today’s full Morning Lineup report. You’ll receive it in your inbox each morning an hour before the open to get your trading day started.
New 52-Week Closing High for Semiconductor ETF (SMH)
As a leading group for the broad market, it was bullish to see the Semiconductor ETF (SMH) make a new 52-week closing high yesterday. And with Texas Instruments (TXN) expected to open higher by more than 5% this morning following strong earnings after the close yesterday, SMH is looking to trade up another 1% when it opens today. Start a two-week free trial to Bespoke Institutional to access The Closer and the rest of Bespoke’s suite of Institutional products.
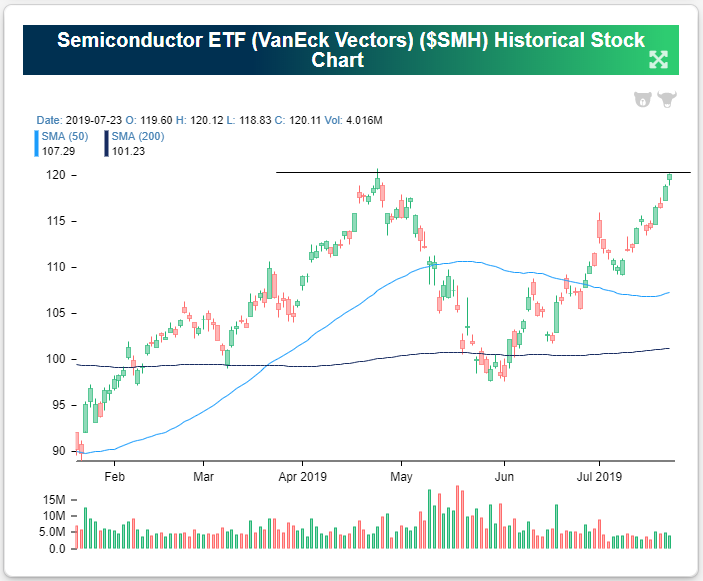
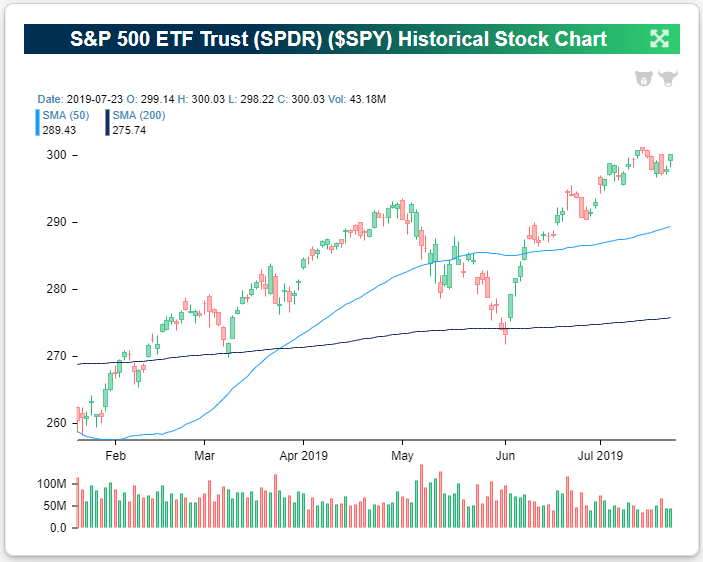
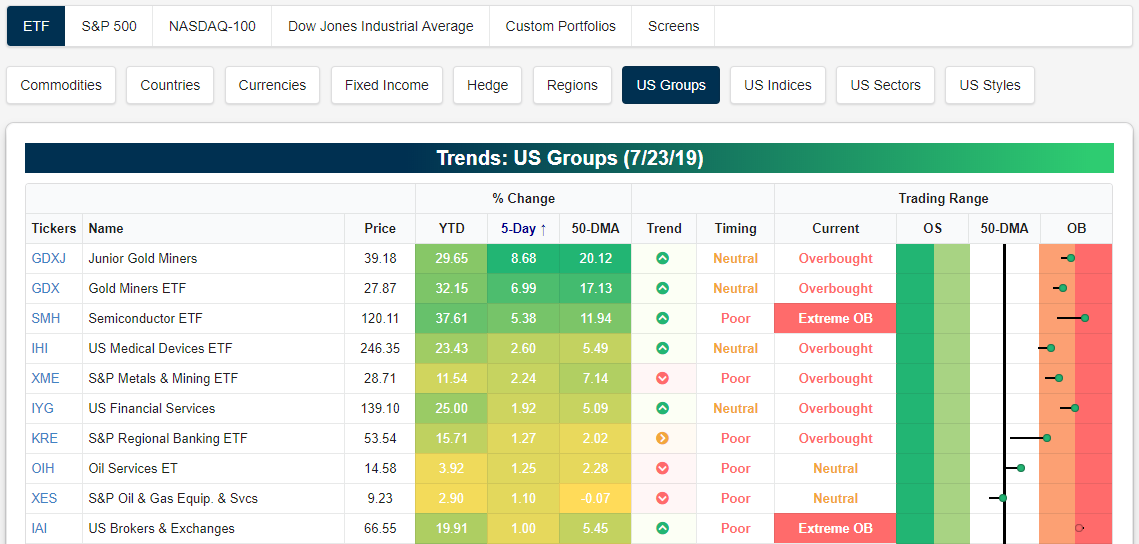
While the gold miner ETFs (GDXJ and GDX) are up the most of any group over the last week, the Semiconductor ETF (SMH) is right on their heels with a 5-day gain of 5.38%. As shown in the snapshot of group ETFs from our Trend Analyzer below, SMH is also trading in extreme overbought territory and is 11.94% above its 50-day moving average. Given that today’s open higher will leave SMH even more extended, we would be careful entering any new longs in the space until some downside mean reversion occurs.
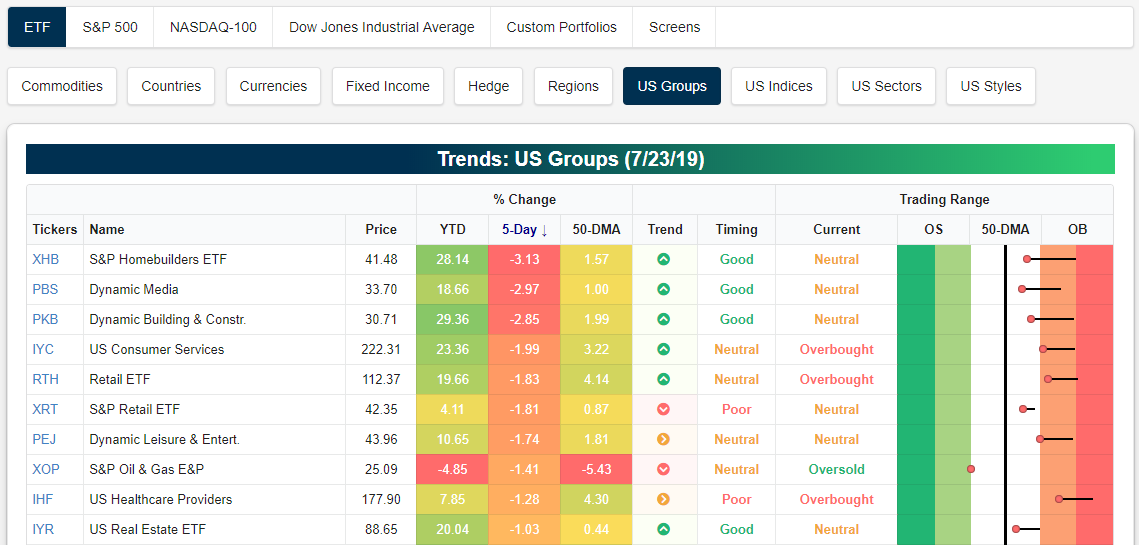
There has definitely been quite a bit of group divergence over the last couple of weeks. As shown below, the homebuilder ETF (XHB) has gotten hit hard over the last week with a decline of 3.13% even though it’s still above its 50-DMA. Media (PBS) and Building and Construction (PKB) ETFs have also fallen more than 2%.
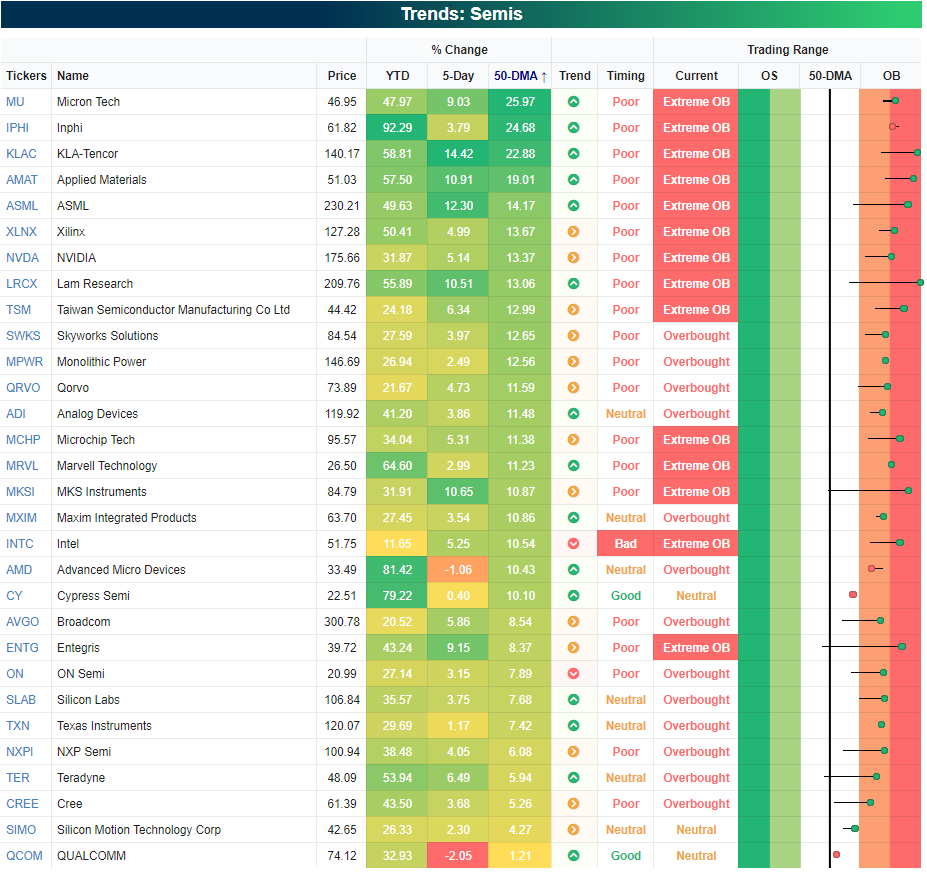
As mentioned earlier, the Semiconductor ETF (SMH) has gotten extended into extreme overbought territory. Below is a look at how extended the individual stocks are that make up the semiconductor group. As shown, all but three stocks in the group are trading overbought, while 14 are in extreme territory (>2 standard deviations above their 50-DMAs). KLA-Tencor (KLAC) and Lam Research (LRCX) are the most overbought at three standard deviations above their 50-DMAs. The least extended semiconductor stock right now is QUALCOMM (QCOM), but even it is still trading 1% above its 50-day. CLICK HERE to view our newest webinar for a full tutorial on how to use our research pages, investment tools, and custom portfolios. If you like what you see, start a two-week free trial to Bespoke Institutional.
The Closer – Stocks Breakout, Decile Definitions, Existing Sales, Five Fed – 7/23/19
Log-in here if you’re a member with access to the Closer.
Looking for deeper insight on markets? In tonight’s Closer sent to Bespoke Institutional clients, we start by showing the breakout of SPY above its July consolidation. We also show a decile analysis of year-to-date performance based on multiple factors like dividend yield, 2018 change, and P/E ratio. Next, we cover today’s miss in existing home sales and finish with an update of our Five Fed Manufacturing Composite after today’s very weak Richmond Fed release.

See today’s post-market Closer and everything else Bespoke publishes by starting a 14-day free trial to Bespoke Institutional today!
Chart of the Day: Back At It With Biogen (BIIB)
Strong Cyclicals Breadth Bodes Well
In our nightly global macro note The Closer last night, we noted strong breadth among the 27 GICS Level 3 Industries that we classify as cyclical. As-of yesterday’s close, all 27 were up on the year, with performances ranging from +30% gains for Construction Materials, Consumer Finance, and Building Products to weaker sub-2% gains from Distributors and Diversified Financial Services. Below, we show price returns by industry. Start a two-week free trial to Bespoke Institutional to access The Closer and the rest of Bespoke’s suite of Institutional products.
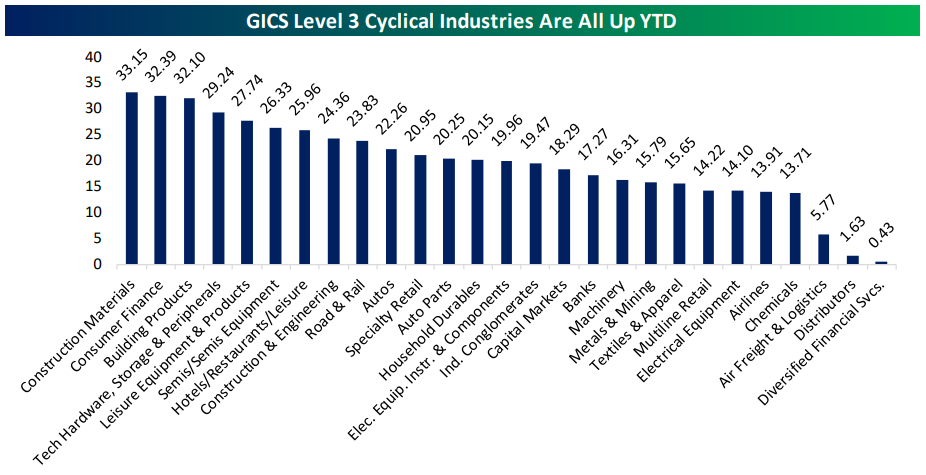
The strong cyclicals breadth bodes well for returns the rest of the year. Since 2004 (full data for all 27 industries starts in that year) there has never been stronger breadth at this part of the calendar. Generally speaking, strong cyclicals breadth is a positive sign for returns the rest of the year. There have been 8 previous years where at least two-thirds of cyclical industries were up through July 22nd. The market as a whole was up through the end of the year in seven of those eight instances, suggesting smooth sailing through the end of 2019.
How Are Stock Prices Reacting to Earnings?
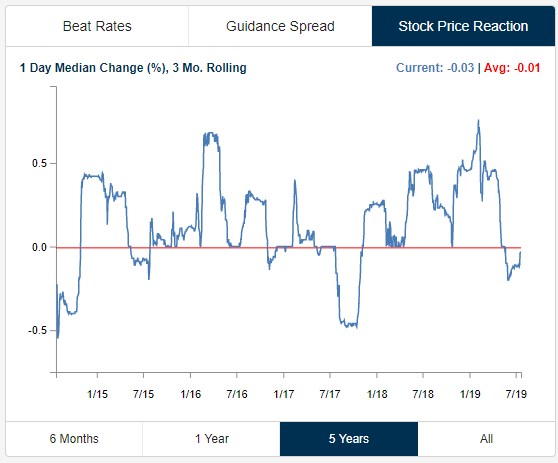
In our view, how a stock reacts to its earnings report is the ultimate arbiter of how good or bad the report actually was. To get a read on the overall market, we keep track of the median one-day price change for all stocks that have reported earnings on a rolling three-month basis. Over the last three months, the median one-day price reaction to earnings has been nearly flat at -0.03%, so we’d say earnings have been “market neutral” over the last quarter.
Below is a chart showing the rolling 3-month trend for earnings reactions over the last five years. As you can see, the trend swings from positive to negative and back to positive quite a bit, so we’d categorize this as a mean reverting indicator. Earlier this year in Q1 when the market was bouncing back from a horrific Q4 2018, stocks were trading extremely positive in reaction to earnings. In fact, we saw the highest reading over the last five years towards the end of Q1 when stocks were experiencing a median one-day price change of roughly 0.75% in reaction to their earnings reports. Since that peak, however, we’ve seen price reactions to earnings drift lower. At the end of June, the reading had dipped negative, meaning companies were experiencing declines more often than gains in reaction to earnings, but over the last few weeks, we’ve started to see price reactions improve.
Now that we’re entering the thick of the Q2 reporting period, a continued move higher for stocks reporting earnings would go a long way in causing an overall market breakokut. Stay on top of the most recent earnings trends by starting a two-week free trial to Bespoke Institutional.
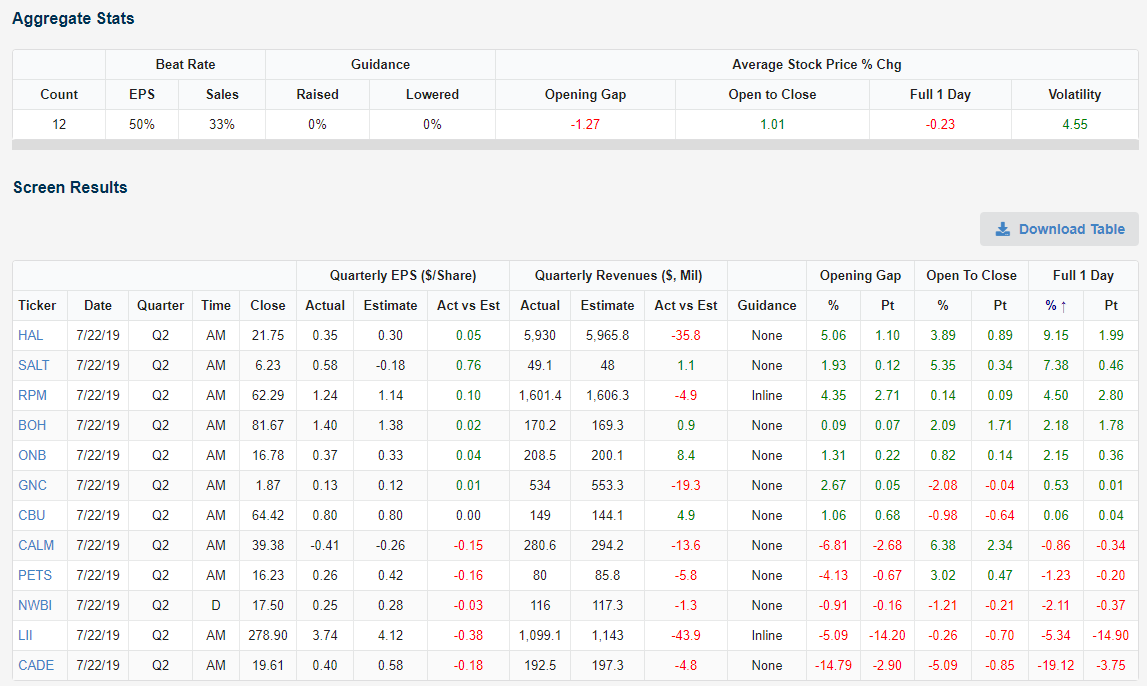
Beats and Misses — HAL, SALT, RPM, CADE
Below is a quick rundown of earnings results from Monday, July 22nd. Of the twelve companies that reported their Q2 numbers, 50% beat EPS estimates, one reported inline, and five missed. Just 33% of companies beat sales estimates. On the day, the average stock that reported traded lower by 0.23%. Halliburton (HAL) was the day’s biggest earnings winner with a gain of 9.15%. Scorpio Bulkers (SALT) gained the second most at +7.38%, followed by RPM International (RPM) at +4.5%. Cadence Bancorp (CADE) was by far the biggest earnings disappointment yesterday with a one-day drop of 19.12%. Stay on top of the most recent earnings trends by starting a two-week free trial to Bespoke Institutional.