Chart of the Day: European Earners Outperforming
B.I.G. Tips – Checkup on Breadth at New Highs
Throughout the bull market and especially since early 2018 when volatility in the market started to pick up, one factor consistently working in the market’s favor has been breadth, specifically the S&P 500’s cumulative A/D line. Each time the S&P 500 has made a new high, breadth has confirmed the move, and in each of the rallies coming out of corrections, breadth has consistently lead price. With the S&P 500 making another new closing high yesterday, in our latest B.I.G. Tips report we looked at current breadth levels for not only the S&P 500 but also each of the major sectors.
To continue reading this report, start a two-week free trial to Bespoke Premium!
Claims Keep Moving Lower
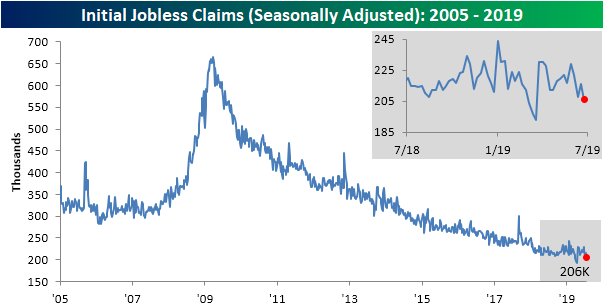
Two weeks after seasonally adjusted initial jobless claims came in at the lowest level in 3 months (208K), this week’s claims data continued to edge even lower dropping to 206K. This 206K number is now only 13K above the multi-decade low of 193K from the April 12th release. Expectations were actually calling for a small increase to 217K from last week’s 216K. This week’s drop also gave some headroom to the record streaks below 250K and 300K which grew to 94 and 229 weeks, respectively. Overall, this was a healthy print for claims as it held up near the lower end of the past year’s range and helped to reaffirm a trend lower of the past several weeks.
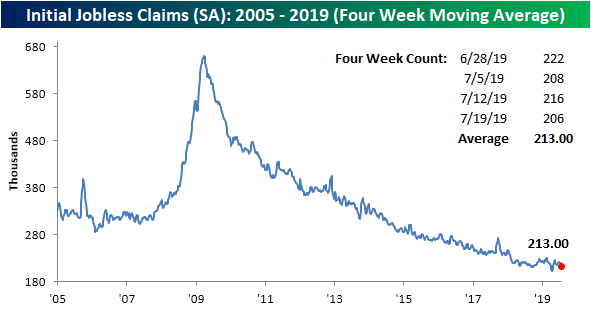
The four-week moving average, which helps to smooth out some of the week-to-week fluctuations, dropped to 213K from 218.75K last week. Similar to the seasonally adjusted weekly number, the moving average is also near the multi-decade lows from April (201.5K). Assuming next week sees another healthy print like we have over the past few weeks and with the recent high of 222K rolling off, the average could continue to grind lower.
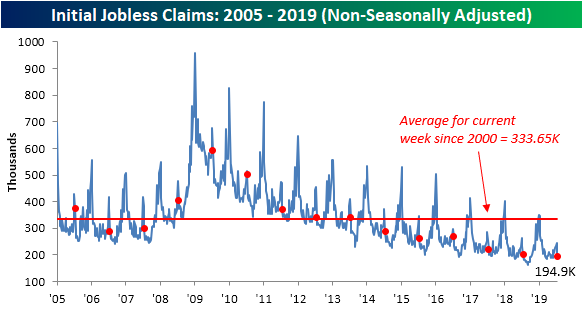
On a non-seasonally adjusted basis, claims came in at 194.9K. This was a sizeable drop of 48.7K from last week’s number. This could be expected though as last week has typically been a seasonal peak for this time of the year. Regardless of seasonality, this drop to 194.9K is still a healthy print as this week’s reading is well below the average for the current week since 2000 and the lowest for the current week of the year of this cycle. Start a two-week free trial to Bespoke Institutional to access our interactive economic indicators monitor and much more.
Trend Analyzer – 7/25/19 – Big Moves In Small Caps
Small and mid-caps’ recent lag has been turned on its head following strong gains in yesterday’s session. Whereas most of these have been at neutral over the past week, today only the Micro-Cap ETF (IWC) has not moved into overbought territory, although it has gotten close to doing so. Small and mid-caps have seen the largest gains over the past five days and have also seen significant moves within their trading ranges as shown through the long tails in the Trading Range section of our Trend Analyzer snapshot below.
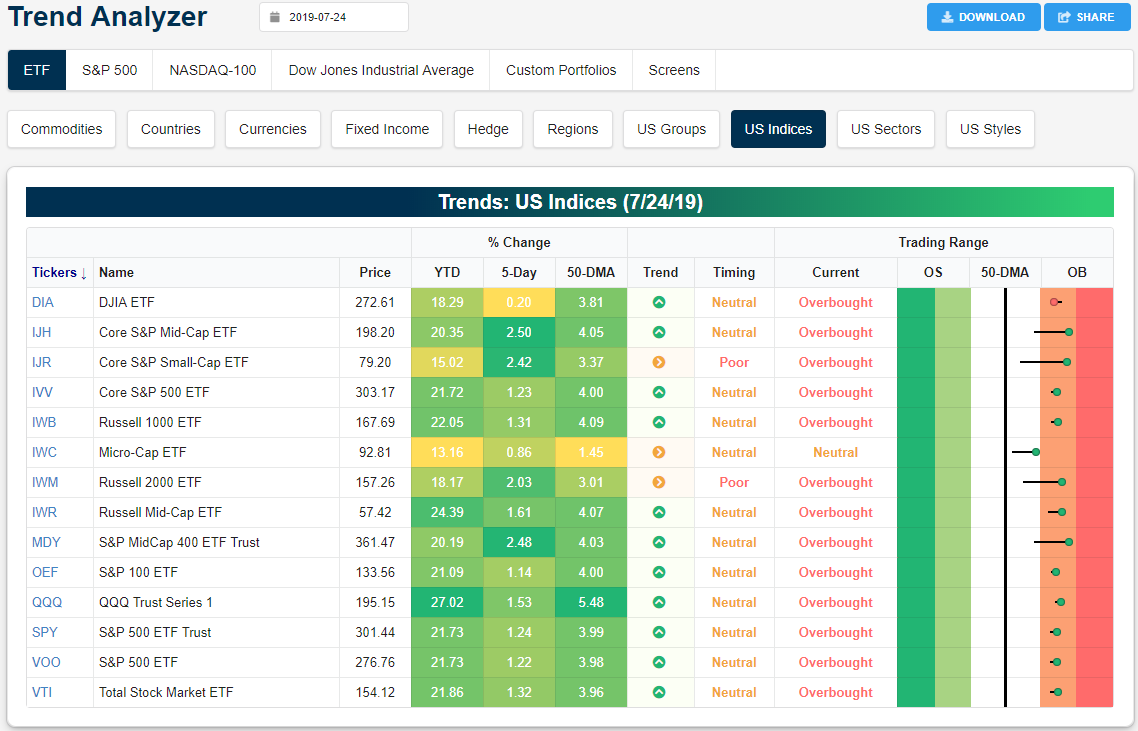
Looking at the charts, yesterday’s strong session for small and mid-caps is evident. Mid-cap ETFs like the Core S&P Mid-Cap ETF (IJH) have broken out above resistance to reach new highs. Meanwhile, small-caps like the Russell 2000 (IWM) and the Core S&P Small-Cap ETF (IJR) have broken out of their short term and a longer-term downtrends. IWC on the other hand still needs to push a bit higher to do the same. Large caps did not see as explosive of a move but the S&P 500 (SPY) and Nasdaq (QQQ) also managed to clear resistance to finish yesterday at new highs.
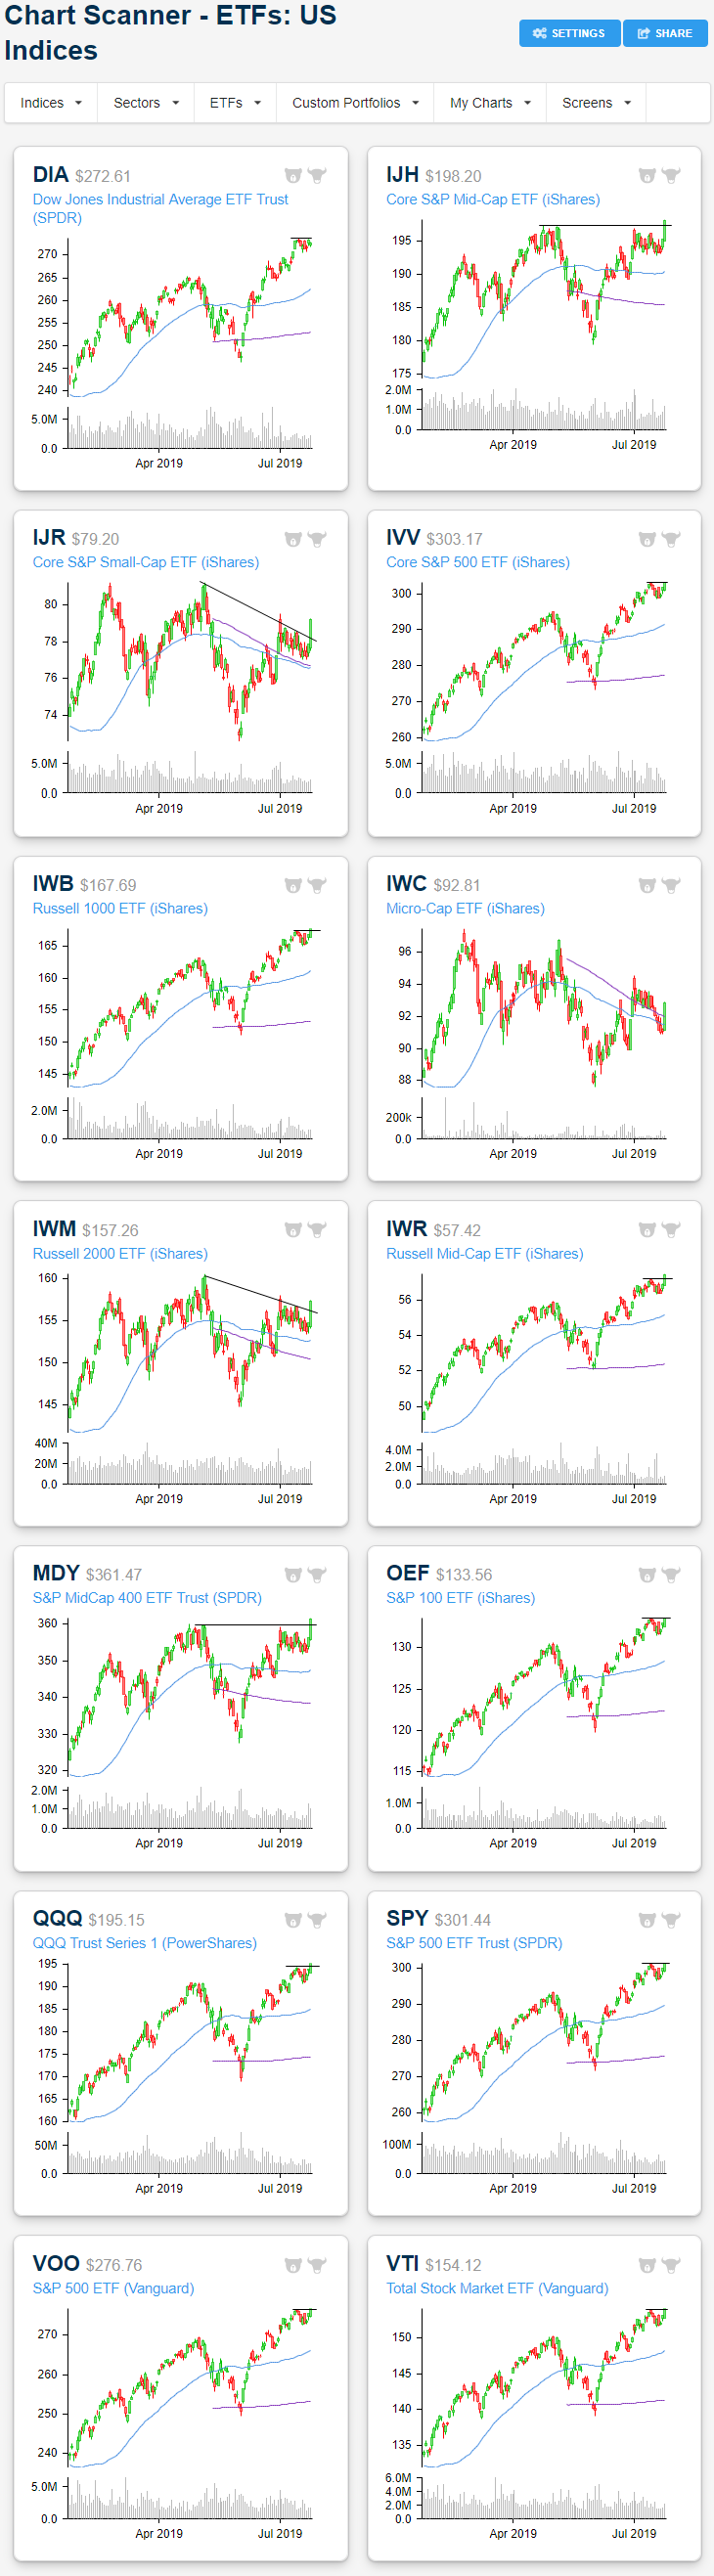
In the past week, it has mostly been more cyclical sectors that have led the way higher with Materials (XLB), Financials (XLF), Industrials (XLI), and Tech (XLK) all gaining well over 2%. On these moves, these ETFs have reached overbought levels. At the same time, defensives like Consumer Staples (XLP), Real Estate (XLRE), and Utilities (XLU) have fallen the most as they mean revert off of overbought levels. Start a two-week free trial to Bespoke Institutional to access our interactive Trend Analyzer, Chart Scanner, and much more.

Russell 2000 Gets in on the Act
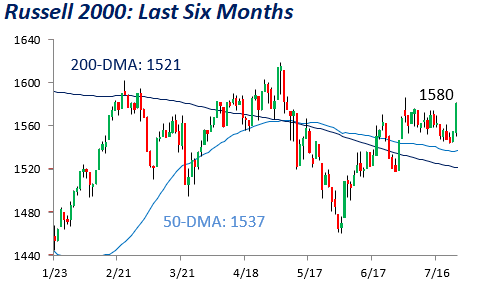
As the S&P 500 and Nasdaq have both been rallying and testing their record highs, small-caps had been lagging behind. In yesterday’s trading, though, even the Russell 2000 got in on the act and rallied. As shown in the intraday chart for the index over the last three weeks, yesterday’s 1.6% rally broke what had been a pretty consistent short-term funk for the sector.
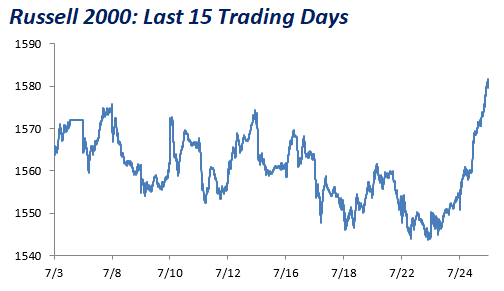
A fifteen-day high for the Russell 2000 is a start, but it still has a ways to go before getting anywhere close to catching up to the large-cap S&P 500 or Nasdaq. Not only is the index still well off its highs from earlier this year, but it’s also still more than 9% from its all-time high made back in August 2018. Start a two-week free trial to Bespoke Institutional for access to our full research suite.
Bespoke’s Morning Lineup – Peak Earnings
As noted in our earnings preview earlier this month, with 61 S&P 500 companies scheduled to report earnings, today marks the peak day for earnings among large-cap companies. With the S&P 500 up over 2.5% heading into today, so far investors apparently like what they hear.
Mario Draghi’s last ECB meeting is a dovish one, with European assets ripping in response to a new look at QE as well as the possibility of tiered deposits at the central bank. US equity index futures were pointing to a decline but now suggest a gain at the open as European credit markets rally. Earnings data last night was mixed but has been generally strong this morning. Yields are down, the dollar is up, and markets are at or near session highs.
Read today’s Morning Lineup to get caught up on news and stock-specific events ahead of the trading day.
Bespoke Morning Lineup – 7/25/19


Start a two-week free trial to Bespoke Premium to see today’s full Morning Lineup report. You’ll receive it in your inbox each morning an hour before the open to get your trading day started.
The Closer – Semis, Machinery, Banks Breaking Out, New Home Sales, EIA – 7/24/19
Log-in here if you’re a member with access to the Closer.
Looking for deeper insight on markets? In tonight’s Closer sent to Bespoke Institutional clients, we kick things off with a look at semiconductors as SMH has broken out to a new all-time high. We also look at the movements in the 3m10y yield curve while cyclical machinery and bank stocks begin to breakout. Turning to economic data, we review today’s New Home Sales release. We also show what staffing provider Robert Half’s (RHI) earnings report indicated on the labor market. We finish tonight with our weekly look at ICI fund flows—showing another week of equity outflows—and EIA data showing a massive drop in production.

See today’s post-market Closer and everything else Bespoke publishes by starting a 14-day free trial to Bespoke Institutional today!
Big Day for Triple Plays
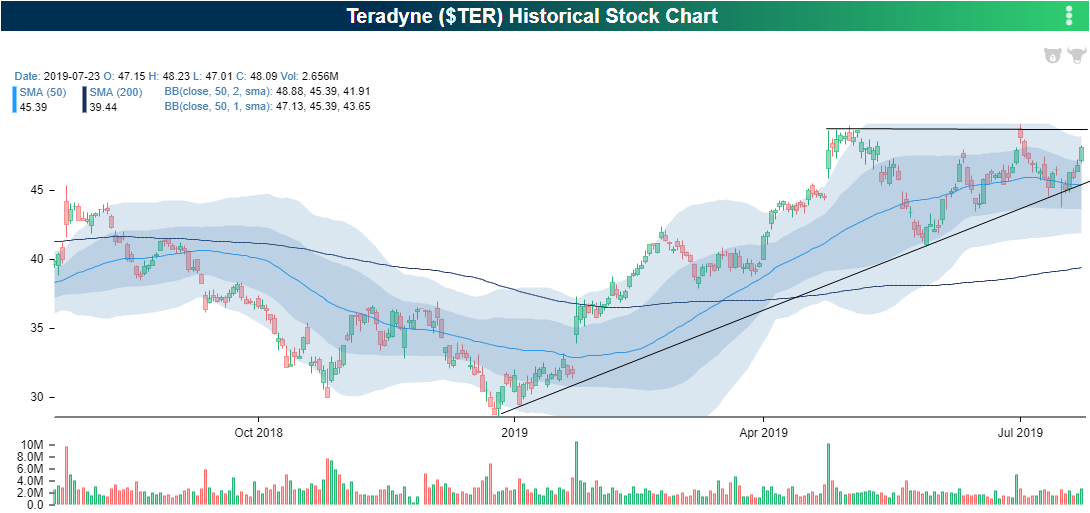
Since last night’s close, there have been five triple plays. A triple play is when a company reports quarterly earnings with EPS and sales above analyst estimates and raised guidance. Typically this is a healthy sign for a company’s fundamentals with price reacting accordingly. You can use our Earnings Explorer and 100 Most Recent Triple Plays tools to keep track of recent strong earners.
Of the five that reported in the past day, Teradyne (TER) has seen the best response, up over 20% on the day as of this writing. TER has been forming an ascending triangle with this recent move leading to a breakout. TER has also been a strong company on earnings with both EPS and sales beats for every quarter since 2013. Last night’s 4 cent EPS beat and $27.3 mm revenue beat marked the ninth triple play in that time. On average, each of these triple plays was responded to with a 2.8% gain, but today’s performance has left this average in the dust. Additionally, the company commented that the growth of 5G was a key factor in the strong quarter, similar to the first triple plays of this earnings season.
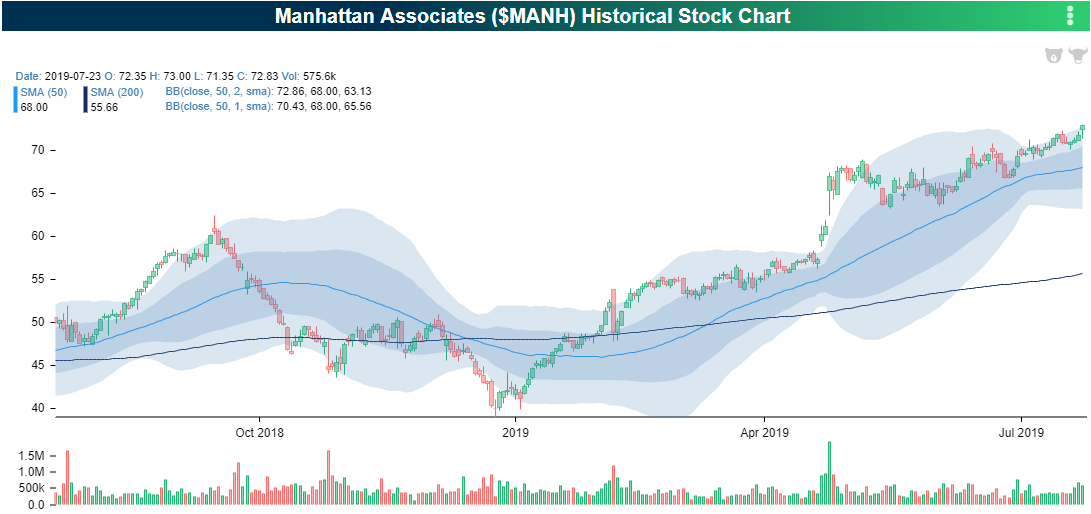
Also out last night, reporting its second straight triple play was Manhattan Associates (MANH). MANH has consistently reported strong quarters with the last EPS miss being back in 2009. Additionally, it is no stranger to triple plays with ten prior occurrences. EPS for the most recent quarter came in at $0.42 versus estimates of $0.35 while revenues were at $154.3 million, $8.3 million above estimates. Ahead of this report, the software and services company reached a 52-week high; also bringing it to extremely overbought levels. In reaction today, the stock has continued to move deeper into overbought territory with a 19% gain.
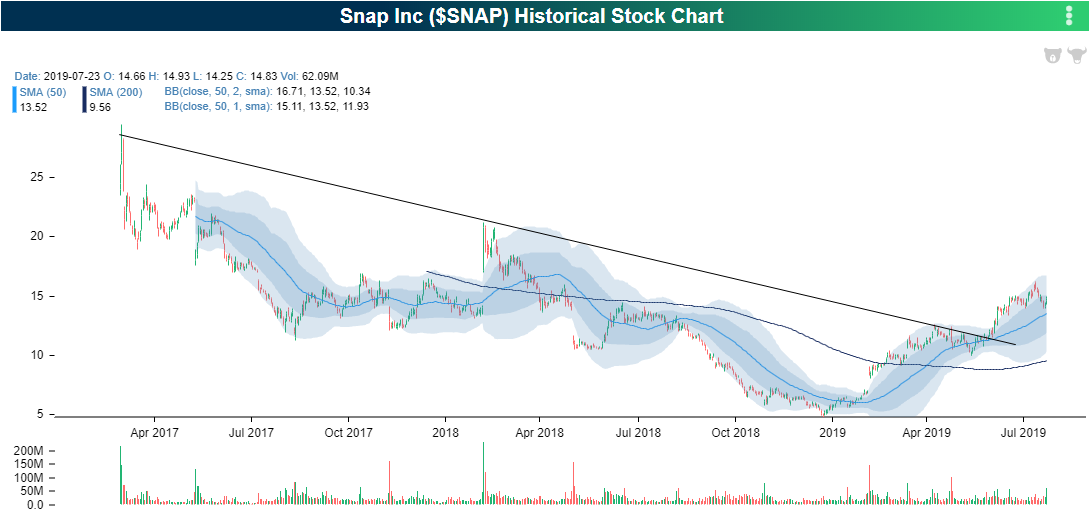
Ahead of Facebook’s (FB) quarter out later today, another social media giant, Snapchat (SNAP), reported last night. Though EPS was still negative (-$0.06), it was also the second smallest loss to date and the second largest revenue per quarter at $388.02 million. SNAP has been in a downtrend since its IPO but earlier this year the stock managed to break out of this downtrend. The 16% gain today has brought the stock further away from this downtrend. Of the ten quarterly reports for SNAP, today is only the third time that the stock has experienced a positive full-day change.
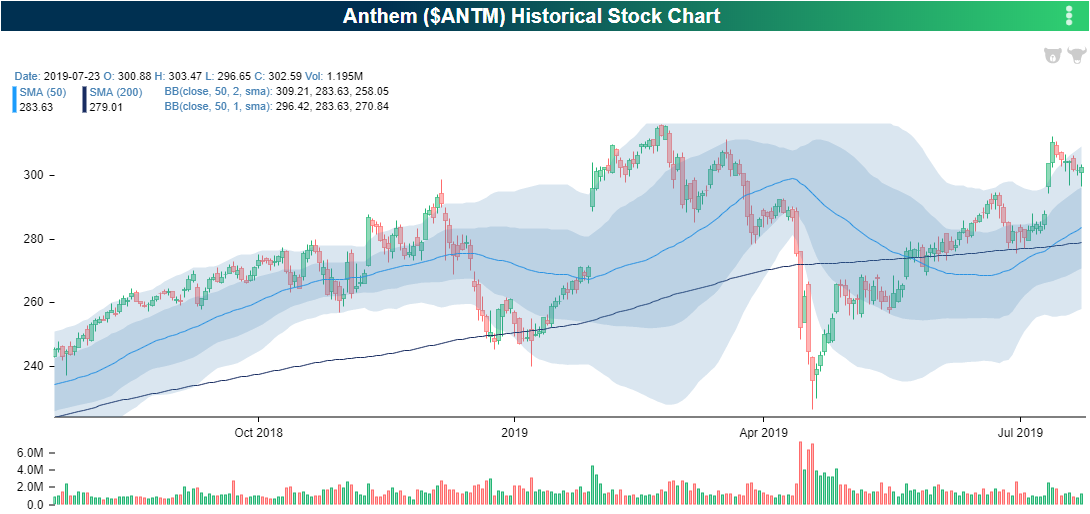
This morning, Anthem (ANTM) also reported a triple play. Its third triple play in a row, ANTM also has not missed EPS since 2016. Perhaps the most impressive streak for ANTM in regards to earnings is in the past seven quarters, the stock has seen a full day gain each time. Despite the triple play today, this streak is looking like it will come to an end. As of this writing, the stock is down 4.18% in today’s trading. Granted, it is also well off of the day’s lows that stopped just short of the 200-DMA. But if the stock was to have seen a positive reaction today, it could have run back up to resistance around the $315 level.
Finally, Teledyne (TDY) saw a solid EPS beat and revenues slightly above estimates. TDY has never missed EPS estimates in its 59 quarter history, although it has only beaten sales 59% of the time. The last two times the stock reported a triple play it saw a full day decline of 1.19% and 0.6%. Today it has bucked this trend with a 5.61% gain. Like MANH, this move higher has brought the stock to elevated levels as it has sat in a steady uptrend this year. Access all of the day’s earnings triple plays with a Bespoke Premium membership. Click here to start a two-week free trial.

Greece 10 Year Yields Fall Below 10 Year UST
Earlier this month, some headlines noted that Greece’s 10-year government bond yields fell below that of US Treasuries of the same maturity. This came on hopes of ECB easing as well as a victory of the New Democracy party in the most recent election. Today, Greek government bond yields have fallen further to fresh lows with the 10-year yield now a hair under 2% while the US 10 year yields 2.05%. This is the first time since Q4 of 2007 that Greek 10-year debt has had a lower yield than the same maturity in the US. Where they currently stand is a far cry from earlier in the decade when Greek yields surged when the country was dealing with bankruptcy.
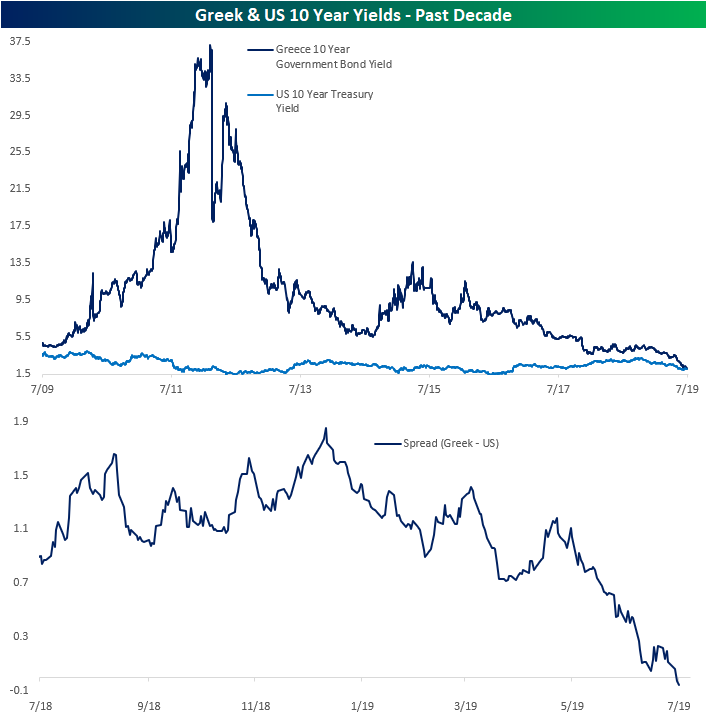
But there is one caveat to this comparison. These yields are in local currency. Even though the yields may appear to be relatively similar, controlling for currency differences, Greece’s bond would yield more. If the Greek 10 year (EUR denominated) was swapped to USD it would actually have a much higher yield than the US treasury yield (USD denominated). To be specific, swapping cashflows from EUR to USD shows the Greek 10 year currently yields 4.75% in USD equivalent, more than 250 bps over the 10y UST yield.
The biggest reason for the difference in yields across the two currencies is that the benchmark/policy rates are different. The ECB’s current policy rate is set at -0.4% whereas in the US that rate is significantly higher at 2.4%. Relative to their respective benchmarks, the Greek yield is actually higher, especially compared to other Eurozone countries; some of which even have negative yields at the ten-year maturity. In the table below, we show these rates for the 23 countries in our Global Macro Dashboard also adding in Greece. In other words, while the fact that the lower yield on Greek 10-year debt doesn’t seem to make sense at face value, the comparison in yields is not necessarily like-for-like. Start a two-week free trial to Bespoke Institutional to access our Global Macro Dashboard and much more.

Chart of the Day: Higher Opens, Flat Intraday
In today’s Chart of the Day, we update a chart we have referenced often over the years. It shows the performance of the S&P 500 ETF (SPY) since it began trading in 1993 broken up by after-hours trading and intraday trading. The after-hours strategy measures the performance of SPY had you brought the ETF at its closing price every day and sold it at the next trading day’s open. The intraday strategy measures the performance of SPY had you bought the ETF at the open every day and sold it at the close that same day.
See whether the after-hours or intraday strategy has performed better by continuing this Chart of the Day by logging in (if you’re already a member) or starting a two-week free trial to any of our research membership levels.