Bespoke Consumer Pulse Report — August 2025
Bespoke’s Consumer Pulse Report is an analysis of a huge consumer survey that we run each month. Our goal with this survey is to track trends across the economic and financial landscape in the US. Using the results from our proprietary monthly survey, we dissect and analyze all of the data and publish the Consumer Pulse Report, which we sell access to on a subscription basis. Sign up for a 30-day free trial to our Bespoke Consumer Pulse subscription service. With a trial, you’ll get coverage of consumer electronics, social media, streaming media, retail, autos, and much more. The report also has numerous proprietary US economic data points that are extremely timely and useful for investors.
We’ve just released our most recent monthly report to Pulse subscribers, and it’s definitely worth the read if you’re curious about the health of the consumer in the current market environment. Start a 30-day free trial for a full breakdown of all of our proprietary Pulse economic indicators.

Bespoke’s Morning Lineup – 8/14/25 – Ribbit!
See what’s driving market performance around the world in today’s Morning Lineup. Bespoke’s Morning Lineup is the best way to start your trading day. Read it now by starting a two-week trial to Bespoke Premium. CLICK HERE to learn more and start your trial.
“Don’t dream it, be it” – Dr Frank-N-Furter, Rocky Horror Picture Show

Below is a snippet of commentary from today’s Morning Lineup. Start a two-week trial to Bespoke Premium to view the full report.
Heading into this morning’s PPI and jobless claims reports, equity futures were all up less than 0.05% while the 10-year yield was unchanged. The July PPI report came in much higher than expected, though, and equity futures have moved lower, but not necessarily by as much as you would expect given the magnitude of the miss. While we’ll have to look further into the report for details, jobless claims remained subdued and came in lower than expected. It’s also worth pointing out that interest rates have barely budged higher.
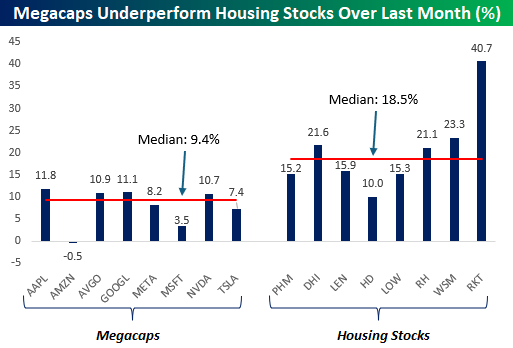
Quick question. Which group has done better over the last month? Megacaps or housing stocks? Most people would instinctively say the megacaps, but as the numbers show, the housing-related stocks have really surged over the last four weeks. The chart below compares the performance of the eight trillion-dollar megacap tech-like stocks to a group of eight housing-related stocks over the last month. For the housing basket, we’ve chosen a few homebuilders (Pulte, DR Horton, and Lennar), a couple of home improvement stocks (Home Depot and Lowe’s), housing retailers (RH and Williams Sonoma), and a mortgage company (Rocket Companies).
Of the eight megacap stocks, their performance over the last month has ranged between a decline of 0.5% and a gain of 11.1% for a median gain of 9.4%. Under any environment, 9.4% is impressive, but it pales in comparison to what the housing-related stocks have done. All eight of the stocks shown are up at least 10%, and their median gain has been nearly twice the gain of the megacaps (18.5%). HD is also the only stock in the group that isn’t outperforming all eight of the megacaps.
The Closer – Fedspeak, Distribution, Wild Moves – 8/13/25
Log-in here if you’re a member with access to the Closer.
Looking for deeper insight into markets? In tonight’s Closer sent to Bespoke Institutional clients, after a busy day of Fedspeak, we parse recent commentary to see what the likely outcome will be at the September meeting (page 1). We then dive into the bifurcation between well-off and insecure consumers (pages 2 and 3). Next, we check in on the wild moves observed under the hood today including the huge difference between value and momentum (pages 4 and 5). We finish with an update on the rally in crypto prices (page 6).
See today’s full post-market Closer and everything else Bespoke publishes by starting a 14-day trial to Bespoke Institutional today!
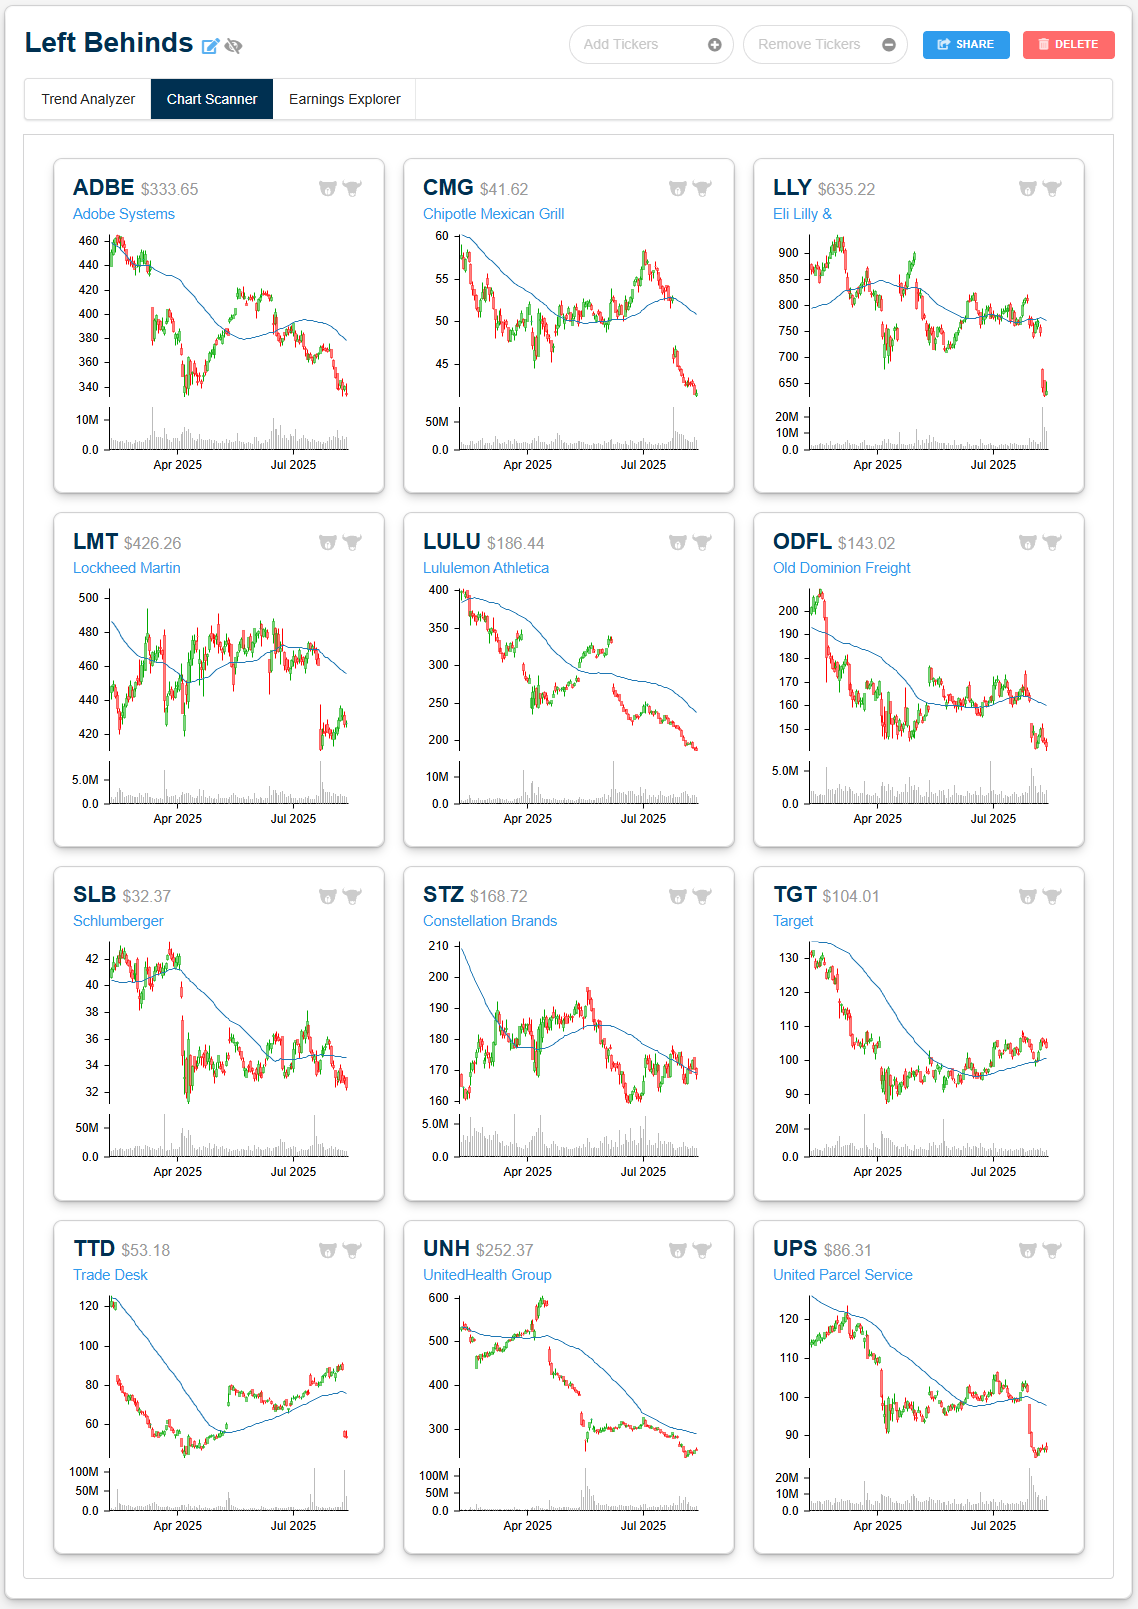
The “Left Behinds” Have a Pulse
Yesterday we published a blog post highlighting 31 large-cap stocks in the S&P 500 that have been struggling mightily in the midst of a broader bull market. These are stocks with market caps above $20 billion that were down 20%+ from 52-week highs and down 20%+ over the last year. The list included well-known names like Chipotle (CMG), Lululemon (LULU), United Health (UNH), Eli Lilly (LLY), and Adobe (ADBE). All of these stocks have been dogs so far in 2025.
We concluded the post with this: “Of course, the name of the game is to buy low and sell high, right? We aren’t sure which ones will make comebacks, but there will likely be a few that you wished you’d bought when revisiting this list of left-behinds a year from now.”
One day doesn’t make a trend, but amazingly, these “left behind” stocks are staging a big comeback today. While the Mag 7 ETF (MAGS) is in the red today, the 31 struggling stocks from yesterday’s post are up an average of 1.5%. LULU, LLY, UNH, and ADBE are all up 3%+ as investors look to be rotating out of winners into losers in a big way. Now let’s see how long it lasts.
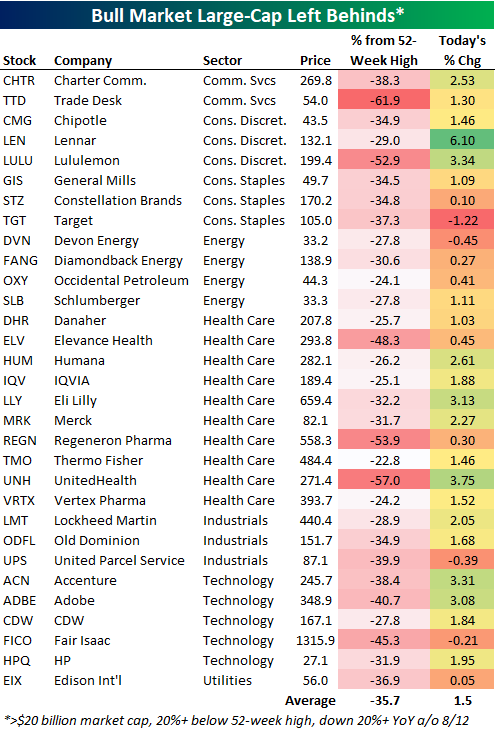

Chart of the Day: Hump Day Rotation
The Triple Play Report — 8/13/25
An earnings triple play is a stock that reports earnings and manages to 1) beat analyst EPS estimates, 2) beat analyst sales estimates, and 3) raise forward guidance. You can read more about “triple plays” at Investopedia.com where they’ve given Bespoke credit for popularizing the term. We like triple plays as an indication that a company’s business is firing on all cylinders, with better-than-expected results and an improving outlook. A triple play is indicative of positive “fundamental momentum” instead of pure fundamentals, and there are always plenty of names with both high and low valuations on our quarterly list.
Bespoke’s Triple Play Report highlights companies that have recently reported earnings triple plays, and it features commentary from management on triple-play conference calls, company descriptions and analysis, and price charts. Bespoke’s Triple Play Report is available at the Bespoke Institutional level only. You can sign up for Bespoke Institutional now and receive a 14-day trial to read this week’s Triple Play Report, which features 24 new stocks. To sign up, choose either the monthly or annual checkout link below:
Bespoke Institutional – Monthly Payment Plan
Bespoke Institutional – Annual Payment Plan
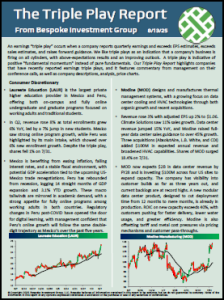
Below is a blurb from our newest Triple Play Report to give you an idea of the insights that are included in this piece.
Merit Medical (MMSI) is a medical device maker involved in cardiology, radiology, endoscopy, and dialysis access maintenance. Its catheters, stents, embolization products, and hemostatic solutions are designed to improve procedural efficiency and patient outcomes. MMSI sells primarily to hospitals, outpatient centers, and physician offices. Recent growth has been fueled by acquisitions such as Cook Medical’s lead management portfolio, EndoGastric Solutions’ assets, and BioLife’s patented StatSeal and WoundSeal products, which expand MMSI’s offerings in high-value niches like vascular closure, indwelling catheter bleeding control, and cardiac intervention.
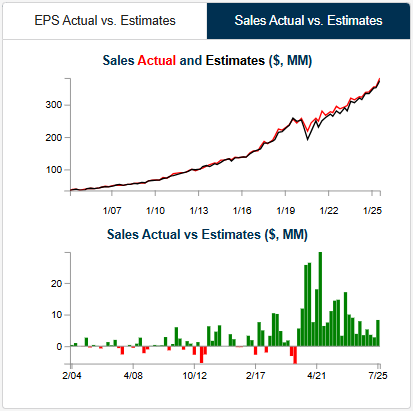
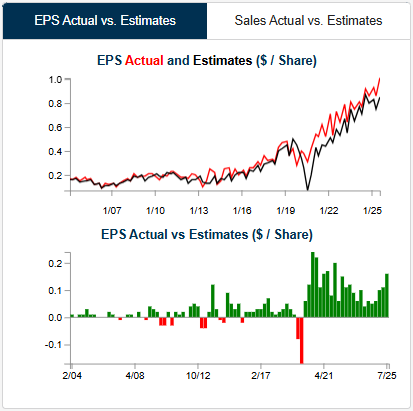
Below is a look at EPS and sales versus consensus estimates for MMSI from our Earnings Explorer tool. Notably, MMSI has beaten both top and bottom line estimates on each of its last 23 quarterly reports dating back to the start of 2020, and as you can see in the charts, both have been trending sharply higher. In addition to the strong EPS and sales results, MMSI completed the triple play this quarter by raising guidance. Shares reacted positively with a gain of 2.3% on its earnings reaction day on 7/31, but the stock didn’t quite see the “pop” that most triple plays do on such strong results.
The most interesting thing we heard on MMSI’s triple-play earnings call this quarter was related to tariffs. As a maker of all kinds of medical devices, MMSI estimated earlier in the year that tariffs would cost the company roughly $26 million. On this call, however, the company noted that the easing of tariffs had cut their cost-impact estimates down to just $7 million at the high end.
Several other triple-play companies have also provided positive news on the tariff front recently.
You can read more about MMSI and the 23 other triple plays we covered in our newest report by starting a Bespoke Institutional trial today.
Bespoke Investment Group, LLC believes all information contained in these reports to be accurate, but we do not guarantee its accuracy. None of the information in these reports or any opinions expressed constitutes a solicitation of the purchase or sale of any securities or commodities. This is not personalized advice. Investors should do their own research and/or work with an investment professional when making portfolio decisions. As always, past performance of any investment is not a guarantee of future results. Bespoke representatives or clients may have positions in securities discussed or mentioned in its published content.
Trump 2.0 vs Trump 1.0 – The First 200 Days
With little fanfare last Friday, President Trump’s second term in office reached the 200-day mark. As with anything related to Donald Trump, there wasn’t a dull moment during the first 200 days of the President’s second term, but despite the volatility and massive swings, the S&P 500 and most sectors made it through with gains.
The chart below compares the performance of the S&P 500 and all eleven sectors during the first 200 days of President Trump’s two terms. The S&P 500’s 6.6% gain this time around trailed the 9.0% gain during Trump 1.0 by 2.4 percentage points. At the sector level, eight gained during the first 200 days of Trump 2.0 compared to nine sectors with gains in the first go around. The second chart below shows the performance spread for the S&P 500 and each sector during each period, and for most sectors, the performance disparity has been relatively narrow at less than five percentage points.
The big exceptions were Communication Services, Consumer Discretionary, and Health Care. Communication Services is performing much better this time around than during Trump 1.0, while the latter two sectors are performing much worse. The underperformance of Consumer Discretionary is largely the result of weakness in Tesla (TSLA), which is ironic given that the stock surged immediately after the election on expectations that Musk would be one of the biggest beneficiaries of a Trump Presidency.
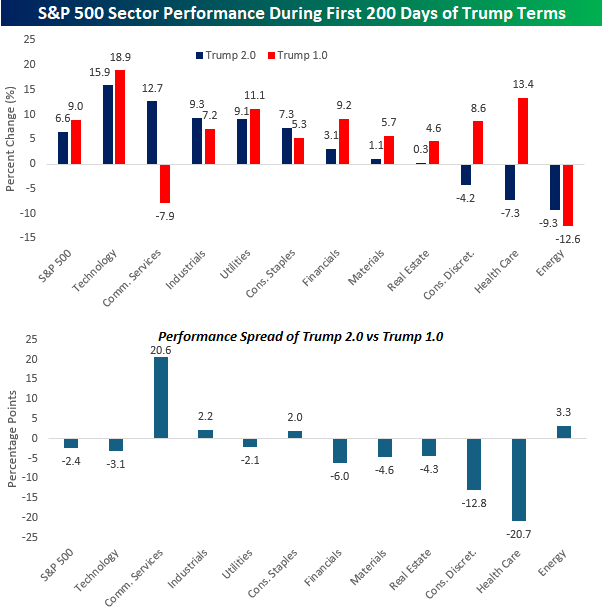
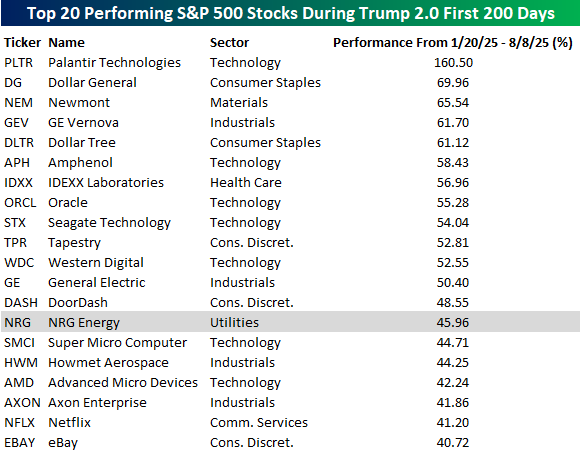
In the tables below, we list the 20 best-performing stocks during the first 200 days of President Trump’s two terms. Starting with Trump 2.0, all 20 of the best-performing stocks have rallied at least 40%, but the far leader has been Palantir (PLTR), which is up over 160%. That’s over 90 percentage points more than the next closest stock – Dollar General (DG). Besides PLTR, six more of the top 20 performing stocks are from the Technology sector, which is more than any other sector, and the only ones with multiple stocks are Industrials (4), Consumer Discretionary (3), and Consumer Staples (2).
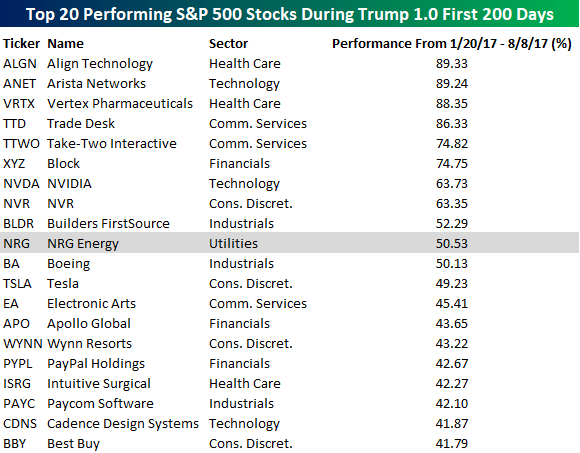
During Trump 1.0, the top-performing stock in the first 200 days was from the Health Care sector as Align Technology (ALGN) surged 89.3%. Behind ALGN, Arista Networks (ANET), Vertex Pharma (VRTX), and Trade Desk (TTD) were all up over 80%. In terms of sector representation, Consumer Discretionary led the way with four, followed by Communication Services, Financials, Health Care, Industrials, and Technology had three each.
One of the most surprising aspects of the two lists to us was that of all the stocks listed, there was only one that showed up on both lists, and it was Utility! That’s right, NRG Energy (NRG) rallied 50.5% during the first 200 days of Trump 1.0 and 46.0% during Trump 2.0. If you had asked us to guess, NRG wouldn’t have been anywhere near the top of our list!
Bespoke’s Morning Lineup – 8/13/25 – The Bridesmaid Walks Down the Aisle
See what’s driving market performance around the world in today’s Morning Lineup. Bespoke’s Morning Lineup is the best way to start your trading day. Read it now by starting a two-week trial to Bespoke Premium. CLICK HERE to learn more and start your trial.
“Ideas come from everything” – Alfred Hitchcock
Below is a snippet of commentary from today’s Morning Lineup. Start a two-week trial to Bespoke Premium to view the full report.
Following yesterday’s CPI, traders are looking to extend the rally this morning, as futures indicate a gain of approximately 0.25% at the open. This morning, in an interview on Bloomberg TV, Treasury Secretary Scott Bessent expressed a view that the Fed should cut rates by 50 bps in September. Additionally, for anyone concerned that the Administration might end the monthly release of Non-Farm Payrolls, Bessent stated that he would not support such a move.
There’s no economic data on the calendar, but we will hear from multiple Fed Presidents throughout the day. Overnight, Asian stocks rallied, led by the Hang Seng, which surged 2.6% while the Nikkei added another 1.3% on top of Tuesday’s gains. The gains came even as a 5-year JGB auction was met with little demand. The gains in Asia flowed into Europe this morning as well, as the STOXX 600 is up 0.4% as inflation data in Germany and Spain was in line with expectations.
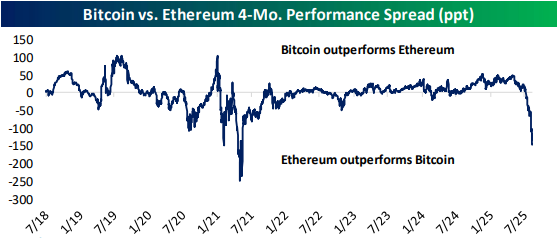
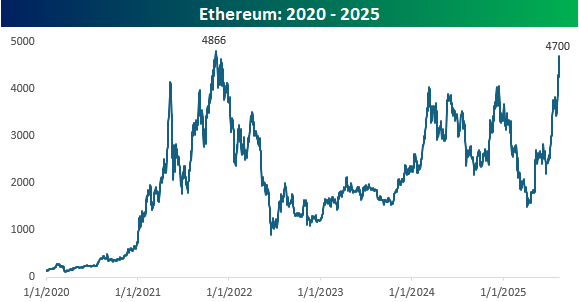
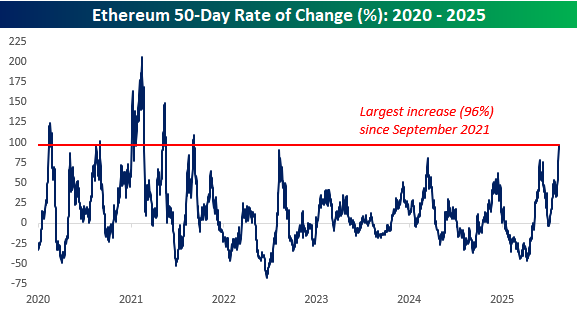
Known by most as either the ‘other crypto’ besides Bitcoin or the Bitcoin bridesmaid, Ethereum looks to be walking down the aisle on its own lately as the world’s second-largest cryptocurrency has surged from under $1,500 in April to $4,700 this morning. Over the last week, Ethereum’s price has broken out above the highs from Q4 of last year to new 52-week highs.
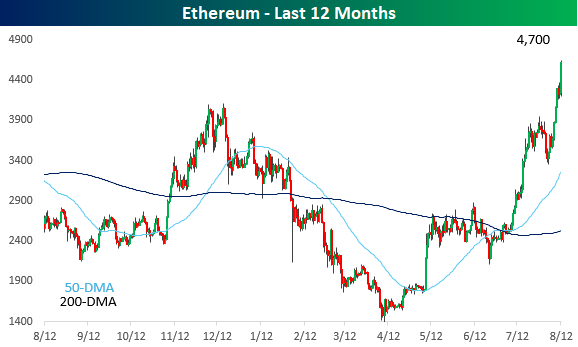
From a longer-term perspective, Ethereum is now not far from its all-time high of just under $4,900, and this morning, Standard Chartered raised its year-end price target to $7,500 and sees it trading as high as $25,000 by the end of 2028. That’s the beauty of dramatic price targets; they generate headlines when they’re made, but no one ever looks back to see if they actually panned out (hint: they seldom do).
This latest surge in Ethereum has been extreme to say the least, with the 50-day rate of change rising to 96%. A move of that magnitude hasn’t been seen since September 2021.
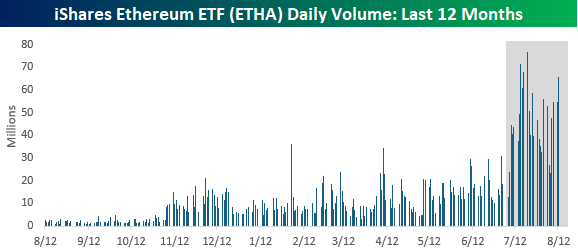
Along with the surge in price, volume in Ethereum has also surged. The chart below shows the daily volume in the iShares Ethereum ETF (ETHA) over the last year. From the start of 2025 through the end of Q2, average daily volume in ETHA was 12.3 million shares. Since the start of July, though, average daily volume has been more than 3.5 times that at just under 44 million shares per day.
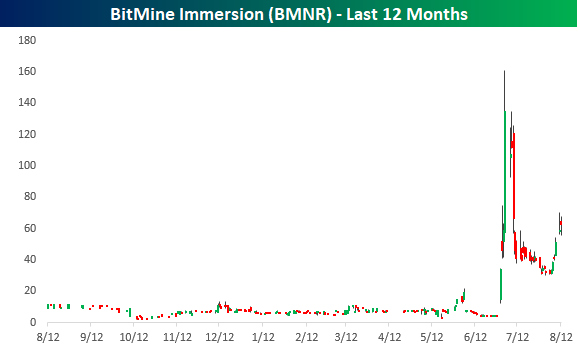
So, what’s behind the surge in Ethereum prices and volume over the last 6 or 7 weeks? As shown in the chart below, the move into overdrive coincided with the announcement at the end of June that BitMine Immersion (BMNR) would become an Ethereum treasury company, sending that stock from under $5 to as high as $161. While it pulled back quickly, at yesterday’s closing price of $62.44, the stock is still up 1,364% since June 27th!
The Closer – CPI, BLS, GLP-1s – 8/12/25
Log-in here if you’re a member with access to the Closer.
Looking for deeper insight into markets? In tonight’s Closer sent to Bespoke Institutional clients, we begin with a rundown of the CPI data (page 1) followed by some commentary regarding the inflation risk premium (page 2). Afterward, we turn over to commentary regarding the President’s choice of who will lead the BLS (page 3). We then dive into earnings results for restaurant brands (page 4) and next up is a review of breadth as the market hits new highs (page 5). We finish with a dive into the Health Care sector’s weakness with focus on GLP-1s and stocks affected by MAHA (pages 6 – 8).
See today’s full post-market Closer and everything else Bespoke publishes by starting a 14-day trial to Bespoke Institutional today!
Large-Cap Left Behinds
While major US stock market indices are back to new highs and the bull market continues on, there are some well-known large-cap stocks that have been just plain bad recently. We screened the large-cap S&P 500 for stocks that have market caps greater than $20 billion that are more than 20% below their 52-week highs as well as down 20%+ over the last year. Within the S&P, there are 31 stocks that fit this criteria, which we’ve called the large-cap “left behinds” in the table below.
You can probably think of a few of these recent “dogs” off the top of your head. Some of the once-popular stocks that have been left behind include Trade Desk (TTD), Chipotle (CMG), Target (TGT), Schlumberger (SLB), UnitedHealth (UNH), Lockheed Martin (LMT), UPS, and Adobe (ADBE). This is a pretty diversified group of large-cap stocks covering communication services (TTD), the consumer (CMG, TGT), energy (SLB), health care (UNH), defense (LMT), transports (UPS), and tech (ADBE), but had you built an equally-weighted basket of these names starting a year ago, you’d be down 32%!
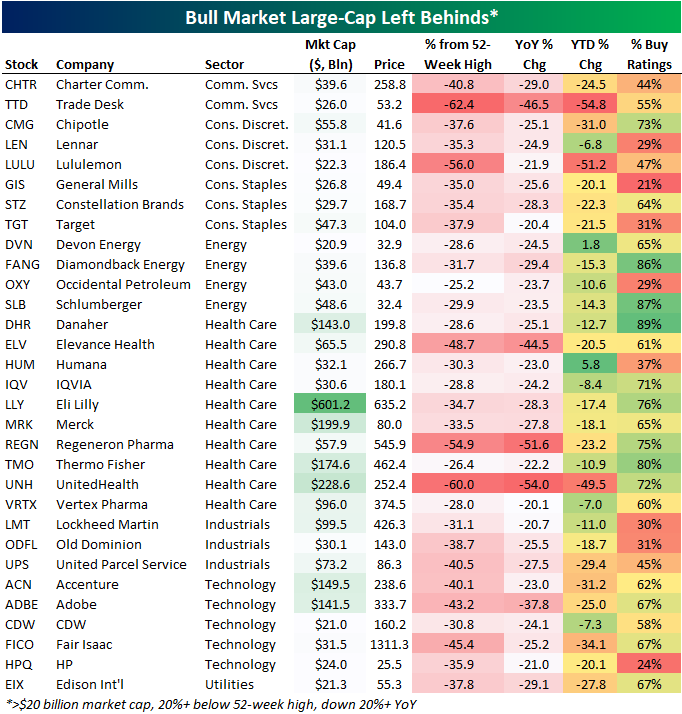
If you’re a chart-watcher and want to hold down your lunch, don’t look at the snapshot below which is another sampling of key names in the “Left Behind” table above. These down-on-your-luck stocks have been torched recently and most look like they’ll never find a bottom.
Of course, the name of the game is to buy low and sell high, right? We aren’t sure which ones will make comebacks, but there will likely be a few that you wished you’d bought when revisiting this list of left-behinds a year from now.