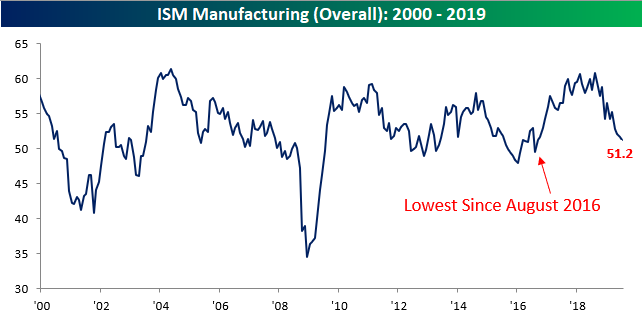
ISM Manufacturing Near a Three Year Low
The pace of growth in the manufacturing sector continued to show signs of a slowdown in July as the ISM Manufacturing Index came in at a level of 51.2 versus expectations for a reading of 52.0. The last time we saw readings this weak in the ISM Manufacturing Index was nearly three years ago back in August 2016. Not only did this month’s reading come in below expectations, but it was also the fourth straight monthly decline which is the longest such streak since the eight-month stretch ending in January 2016. Talk about a rut!
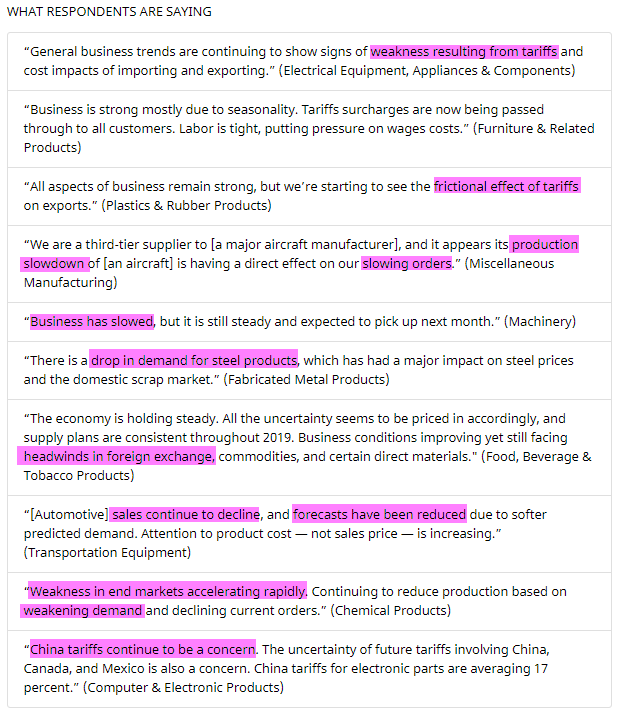
As you might expect given the ISM Manufacturing Index’s move towards 50 (the dividing line between growth and contraction), the commentary from respondents in this month’s report is sounding increasingly cautious. The frequency of terms like weakness, slowdown, and other terms like these have been on the rise in recent months.
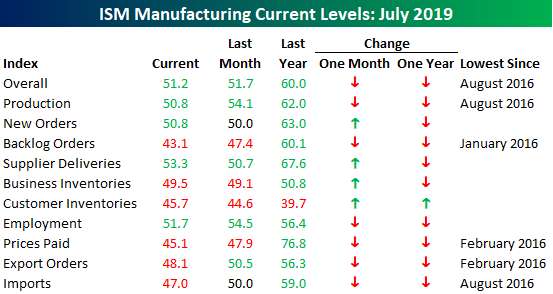
In looking at the breadth of the ISM Manufacturing Index’s sub-indices, things were biased towards the downside as six components saw m/m declines and just four saw increases. On a y/y basis, things were even worse as Customer Inventories was the only one higher versus a year ago. Just as the headline index saw its lowest reading since August 2016, a number of the sub-indices are also at their weakest levels since 2016. Both Production and Imports haven’t been this weak since August 2016, Prices Paid and Export Orders haven’t been this weak since February 2016, and Backlog Orders dropped to its lowest level since January 2016. In order to not close on a down note, we would note that New Orders managed to show a slight increase rising from 50.0 to 50.8. Start a two-week free trial to Bespoke Premium to receive our best equity research on a daily basis.
Claims Still Low But Not A New Low
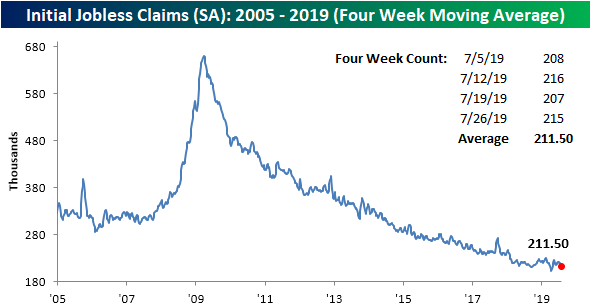
Seasonally adjusted jobless claims rose after dropping last week to the lowest level in three months (which was revised up to 207K). With a reading of 215K, claims came in slightly above estimates of 214K. While claims are currently at the lower end of the past year’s range, other than a few spikes higher and lower, there has been no significant consistent trend higher or lower over the past 12 months (gray shaded chart below). That does not mean the data has not been healthy though as claims have remained at or below 250K and 300K for record streaks of 95 and 230 weeks, respectively.

While it may not be evident in the weekly seasonally adjusted numbers, the four-week moving average has been continuing to trend lower. This week marked the fourth straight week with a decline in the moving average falling from 213.25K last week to 211.5K. This decline was largely a result of a recent high of 222K coming off of the average. This average is also now at its lowest level since mid-April’s multi-decade low and would need to fall another 10K to take out this low to help confirm the trend lower is still alive and well.
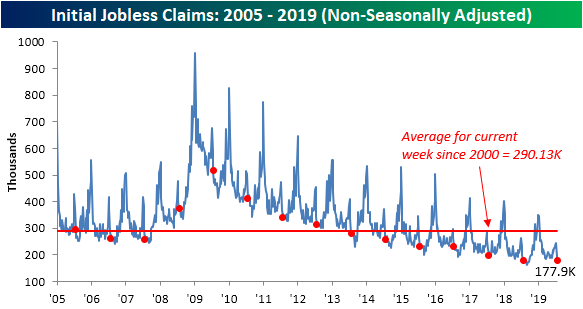
This time of year typically has favorable seasonality for jobless claims as a large drop is usually observed after a short term peak a few weeks prior. This year is following this pattern to a tee as NSA claims dropped to 177.9K from 196.4K last week and the recent peak of 243.6K the week before that. Seasonality aside, 177.9K is still the lowest print for non-seasonally adjusted claims for any week in ten months. At its current levels, NSA claims are also at the lowest level for the current week of the year for this cycle, but this year did see a much smaller degree of change year-over-year than previous years; a 2K decline versus declines of 20.9K and 18.9K for the comparable week in the past two years.
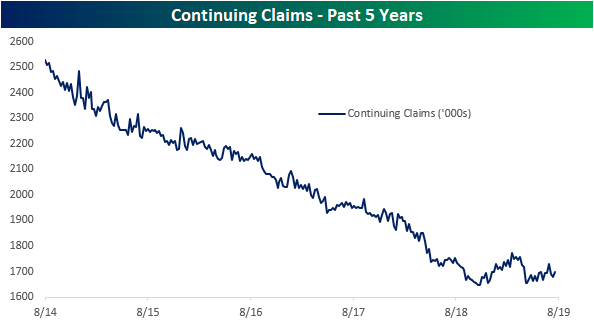
While claims are still at healthy levels, the trend lower has not been as strong as it has been in prior years. Initial claims data has hinted at this but continuing claims are perhaps a more obvious example. Back in October of last year, continuing claims fell to a multi-decade low of 1649K. Since then though, there has not been a new low despite coming close in April and May. Since the spring, claims has been slowly grinding higher once again with another uptick to 1699K this week. So overall, while labor market data still is healthy and low by historical standards, the rate of improvement has subsided a bit. Start a two-week free trial to Bespoke Institutional to access our interactive economic indicators monitor and much more.
Beyond Bonds
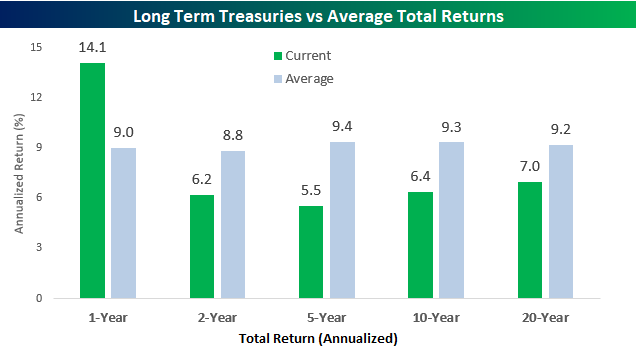
The outperformance of the recent IPO of Beyond Meat (BYND), even after its secondary announcement, has been well documented over the last several weeks, but have you seen the performance of bonds? The chart below shows the total return of the S&P 500 compared to long-term US Treasuries over the last year. How many times in the last few weeks have you heard about how the rally in stocks has gotten way too far ahead of itself and is reminiscent of the late 1990s? We’ll concede that 2019 has been an exceptionally strong year for equities so far, but over the last year, the S&P 500 is up less than 8% on a total return basis. Meanwhile, long-term US Treasuries are up over 14%! That’s nearly 80% more than equities. So, if stocks are a bubble what are bonds?

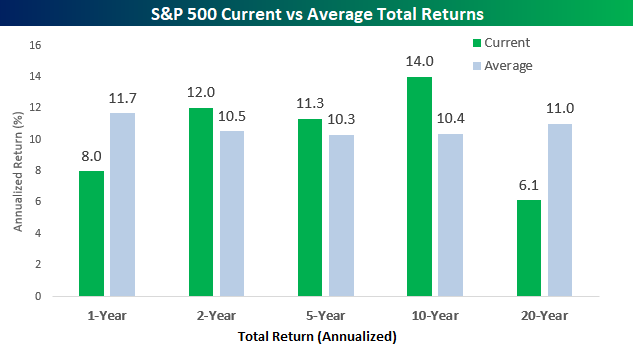
The chart below compares the one, two, five, ten, and twenty-year annualized returns for the S&P 500 going back to 1928. The S&P 500’s performance over the last year is actually well below its historical average of 11.7% and ranks in just the 39th percentile relative to all other 12-month periods. While two and five-year returns are both just modestly above their historical average and rank in the 52nd and 51st percentiles relative to history, the S&P 500’s ten-year annualized return is well above average (14.0% vs 10.4%) putting it in the 65th percentile relative to all other periods. Keep in mind, though, that ten years ago was just four months removed from the financial crisis lows. Expanding our window out to 20-years, the S&P 500’s current returns relative to average start to fall off a cliff again. The 6.1% annualized return is almost five full percentage points below the historical average of 11.0% and ranks in just the 4th percentile relative to all other 20-year periods. Continuous underperformance of almost five percentage points per year really starts to add up over time. For example, while a 6.1% annualized return over a 20-year window translates to a total gain of 227%, an 11% annualized gain over that same time period works out to a gain of 706%!
While equity market returns have been well below average over the last year, bonds have performed extremely well relative to average. At 14.1%, the one-year total return is in the 72nd percentile relative to all other one-year periods. However, for every other time window (two, five, ten, and twenty years) returns have been consistently below-average ranking well below all other periods on a percentile basis. Keep in mind here, though, that unlike total return data for equities which goes back to the late 1920s, the total return series we used for Long-Term US Treasuries (Merrill Lynch Long Term Treasuries Index) only goes back to the mid-1970s.Start a two-week free trial to Bespoke Premium to receive our best equity research on a daily basis.
Bespoke’s Morning Lineup – Still Digesting the Fed
After plunging during Powell’s presser yesterday, S&P 500 futures have staged a modest rebound; they’re currently trading consistent with a 20 bps gain versus yesterday’s close. The dollar is now trading at 7-month highs after the Bloomberg USD Index gained 44 bps yesterday. Since June 25th lows, the buck has gained consistently but the total advance is only 2.2%, so it’s hard to argue things are getting out of hand.
One of the harder-hit areas by the more hawkish (relative to expectations) Fed yesterday is commodities where WTI is down 1.3%, gold is down 1.6%, and copper is down 63 bps versus yesterday’s pre-Fed levels. For their part, yield curves are higher this morning, with 2s5s steepening but 5s10s or 5s30s flattening as the belly of the curve gets the worst of traders’ reassessment about the path of FOMC policy through the rest of the year and into 2020.
PMIs overnight were generally weaker sequentially (discussed in greater detail in today’s report), but a number beat expectations. Finally, earnings are generally positive in the US and Europe this morning, with US names like GM, Cigna, Verizon, Shopify, Yum! Brands, and Wayfair all reporting big beats of one kind or another.
Continue reading in today’s Morning Lineup.
Bespoke Morning Lineup – 8/1/19

Equity Market Trend Updates Across the World
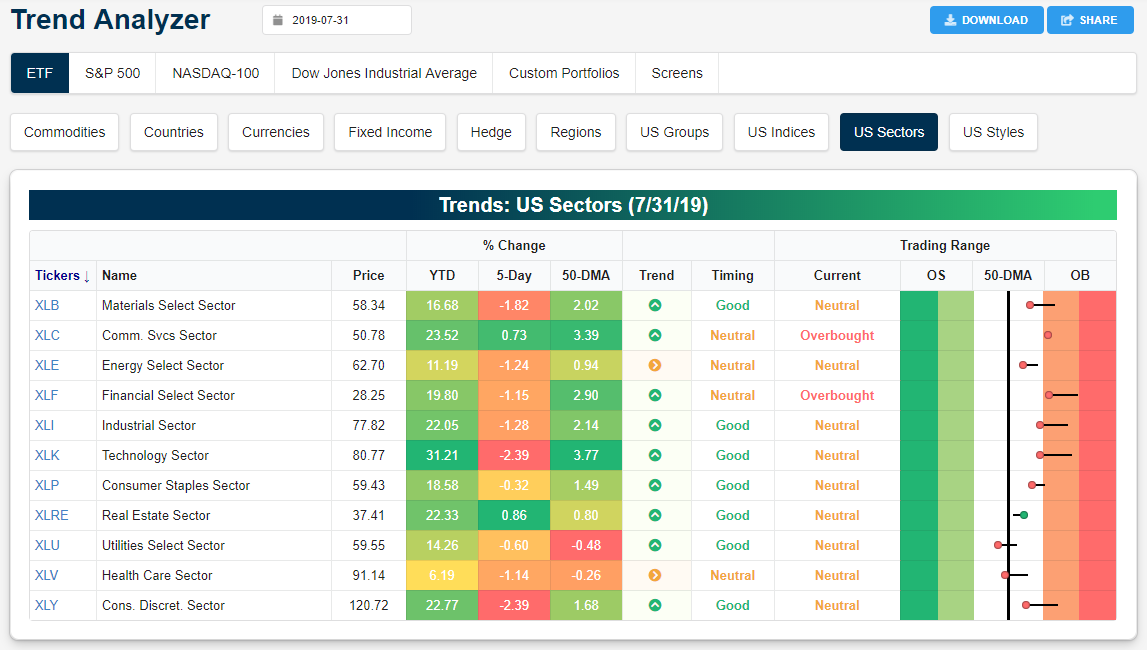
Fed Chair Powell’s press conference yesterday sparked a pretty large drop for US equities. The S&P 500 finished the day lower by more than 1%, and as shown below, most of the index ETFs that we monitor were pulled back into neutral territory from overbought levels. For now this can be characterized as simple mean reversion.

Looking at sectors, Financials and Communication Services are the only remaining ones in overbought territory, while Utilities and Health Care are the only two that have dropped below their 50-day moving averages.
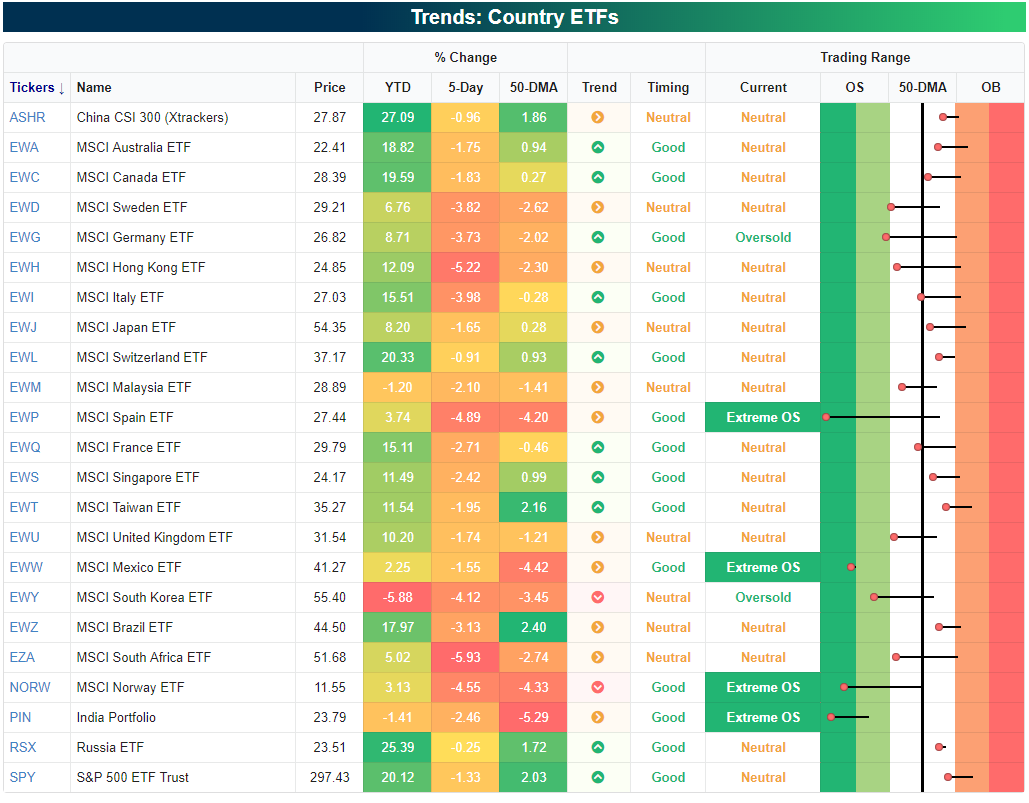
International equities are in much worse shape given that many of the country ETFs we follow are now below their 50-day moving averages or outright oversold. Spain (EWP), Mexico (EWW), Norway (NORW), and India (PIN) are actually in extreme oversold territory after sharp moves lower over the past week. Start a two-week free trial to Bespoke Premium to receive our best equity research on a daily basis.
July 2019 Asset Class Performance
July ended with a thud after Chair Powell’s presser this afternoon sent the S&P 500 lower by 1.09% at the close. Even with today’s 1% declines, though, US equities posted solid returns during the month.
Below is our asset class performance matrix showing total returns for various ETFs today, in July, and year-to-date.
Interestingly, Consumer Staples was the sector that got hit hardest today with a decline of more than 2%. Consumer Discretionary, Materials, Industrials, and Technology also fell more than 1%.
For the month of July, most country ETFs ended up struggling badly even though the US gained 1%+. France, Germany, Hong Kong, India, Mexico, Spain, and the UK all fell more than 2% in July. Silver was the best asset class in July with a gain of more than 6%.
Year to date, the best performer in the entire matrix is the US Tech sector with a gain of more than 30%. Russia ranks second at +25%. Start a two-week free trial to Bespoke Premium to receive our best equity research on a daily basis.

The Closer – Burn After Cutting – 7/31/19
Log-in here if you’re a member with access to the Closer.
Looking for deeper insight on markets? In tonight’s Closer sent to Bespoke Institutional clients, we provide our commentary on today’s FOMC rate decision and subsequent press conference by Fed Chair Powell. We go over the broadly negative reaction across assets before turning to some of today’s macroeconomic data including the employment cost index and EIA petroleum data.

See today’s post-market Closer and everything else Bespoke publishes by starting a 14-day free trial to Bespoke Institutional today!
Chart of the Day: Traders Rush For the Exits
“Make Fed Days Great Again!”
President Trump has raised a lot of eyebrows recently with his comments saying that despite all the good going on in the economy and stock market, the DJIA would be “10,000 points higher than already a very high number” were it not for the Fed. While it is hard to believe that the DJIA would be 10,000 points higher had the Fed not hiked rates, it is interesting to note that on FOMC days since Powell became the Fed Chair, that the DJIA has seen a cumulative decline of over 1,000 points. Throughout history, Fed days have historically been positive market days, but under Powell, they have been nothing of the sort. Start a two-week free trial to Bespoke Institutional, and receive full access to all of our must-read content.

Americans Still Not All In on Equities
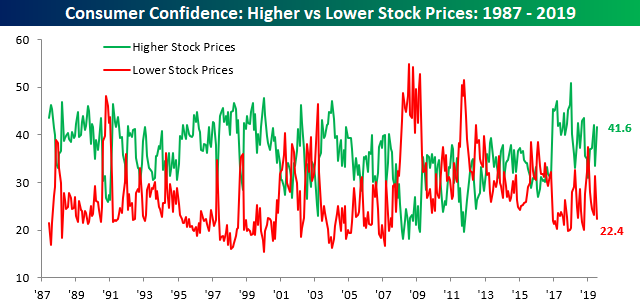
Maybe they’re still feeling the sting of January 2018 when they basically went ‘all-in’ on stocks (and bitcoin for that matter) and then saw prices crater for two months, but despite more new highs for equities, US consumers haven’t been really quick to embrace the market. In Tuesday’s Consumer Confidence Report, for the question which asks consumers for their views on the direction of US equities, 41.6% expect prices to continue rising, while only 22.4% expect lower prices. Granted, the 41.6% reading is a relatively big increase from June when the reading was at 33.5%, but it’s still below the 42.1% reading from May and the peak reading of 51.0% from January 2018. As shown in the green line of the chart, ever since the peak reading in January 2018, we have been seeing lower highs in the percentage of consumers expecting higher stock prices.
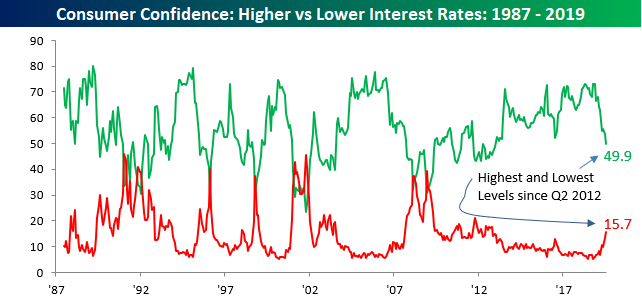
Consumers are also asked to give their views on interest rates in each month’s Consumer Confidence Report, and here we’ve seen some interesting moves over the last few months. Ever since the Fed started to pivot towards lower rates at the start of the year, the percentage of consumers expecting higher interest rates has declined rapidly. From a recent high of over 70% in late 2018, less than half of consumers now expect higher interest rates. Meanwhile, the percentage of investors expecting lower rates has risen from near historic lows up to 15.7%. For both of these series, July’s readings were the most extreme since late 2012. Keep in mind too, that this comes as long-term treasury yields are close to historic lows. Start a two-week free trial to Bespoke Institutional, and receive full access to all of our must-read content.