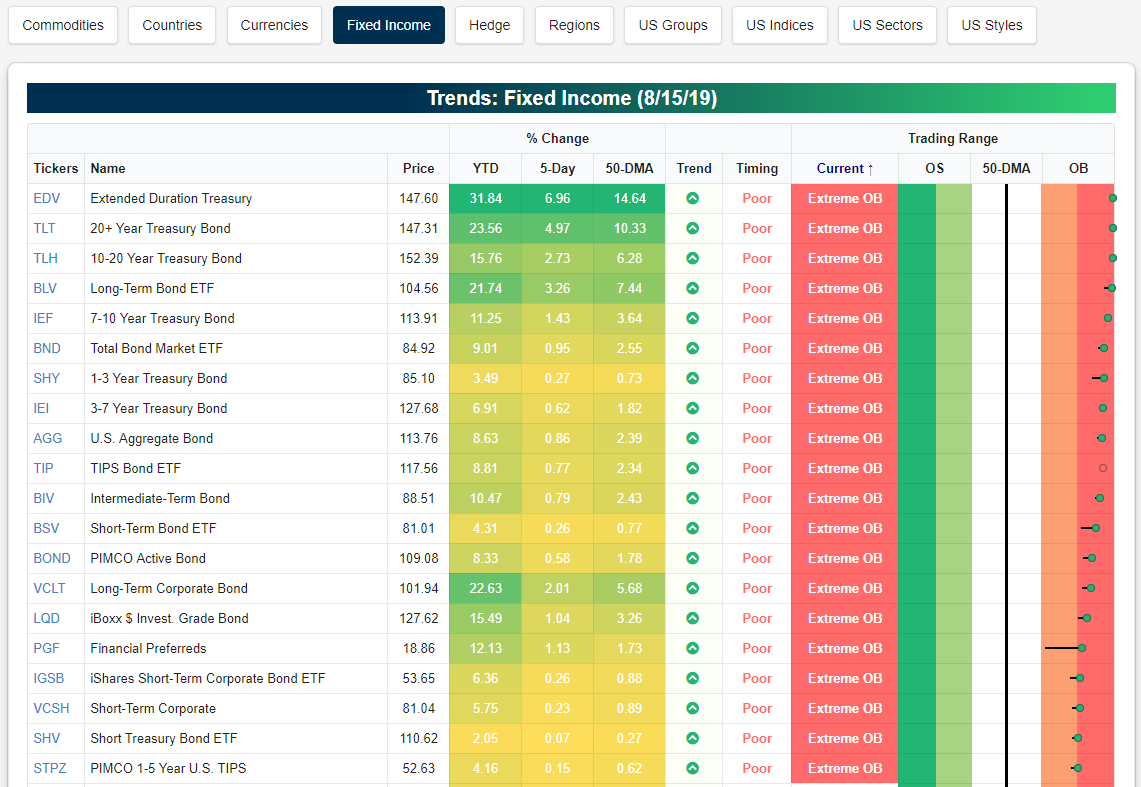
Fixed Income Through the Roof
Our Trend Analyzer does a great job of finding those assets that are at extremes either on the oversold side or the overbought side. While equities are mostly oversold at this point, fixed income is in the stratosphere. Below is a look at the most overbought fixed income ETFs at the moment. Dozens of them are in extreme territory at 2-3 standard deviations above their 50-day moving averages. You don’t see readings like this often, and they’re due for some mean reversion. Start a two-week free trial to one of Bespoke’s premium research offerings.
Home Builder Sentiment Keeps Climbing
The NAHB’s Housing Market Index for August saw its second straight month with a modest increase bringing it to 66 compared to expectations of an unchanged 65. Although the index has been grinding higher since plummeting to its late 2018 low, it is still well off of its December 2017 record high of 74.
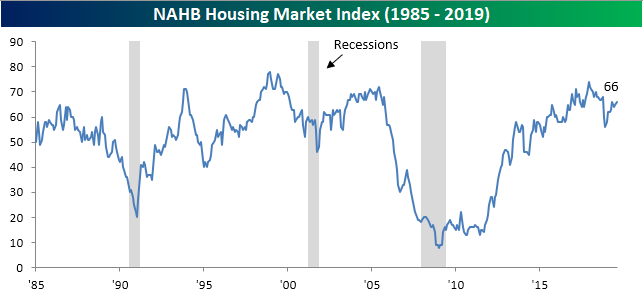
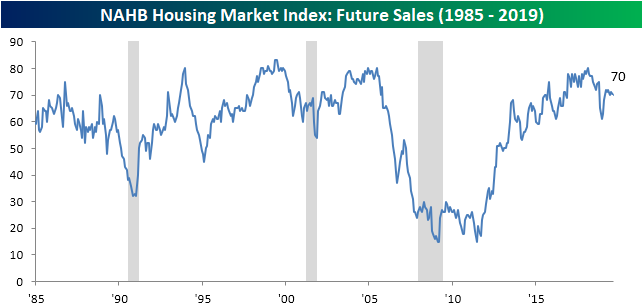
Breaking down the indicator by its sub-indices, improved present sales and traffic led to a stronger index in August. Both rose by 2 and are now at their highest levels of 2019. Future sales outlook still remains bleaker though as it declined to 70 in August. As shown in the chart below, in addition to the spike lower at the end of last year, future sales have been in a downtrend since February 2018. Unlike present sales and traffic, the rebound of future sales’ off of the December low has not seen promising follow-through.
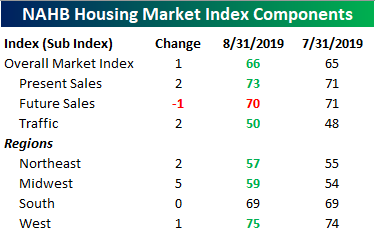
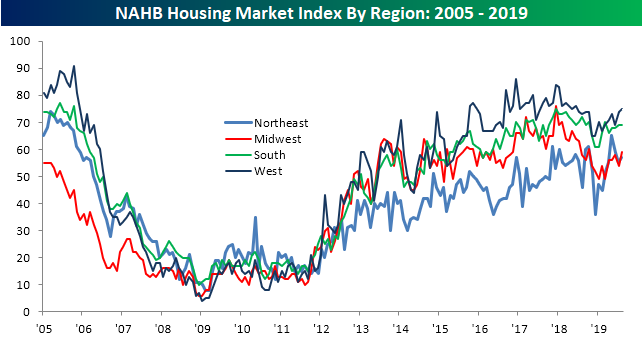
Of the individual regions, sentiment in the West continues to be the strongest improving to 75 in August. Granted this is still off of its cycle highs; as is the case for each of the regions. The other regions generally saw improvements as well, other than the South. While the South did not improve, it did hold steady at a solid reading of 69. The Midwest jumped by 5 points and the Northeast also improved to 57. Start a two-week free trial to Bespoke Institutional to access our interactive economic indicators monitor and much more.
Bespoke’s Morning Lineup — A Break for Rates
See what’s driving market performance around the world in today’s Morning Lineup. Bespoke’s Morning Lineup is the best way to start your trading day. Read it now by starting a two-week free trial to Bespoke Premium. CLICK HERE to learn more and start your free trial.

The Closer – On Support, Strong Data Day, Economic Surprises Perking Up – 8/15/19
Log-in here if you’re a member with access to the Closer.
Looking for deeper insight on markets? In tonight’s Closer sent to Bespoke Institutional clients, as small caps and US equities on a relative basis test support, we show the massive short interest in copper. After today’s massive slug of economic data, we recap the releases of quarterly productivity and costs, Empire State and Philly Fed indices, industrial production volumes, retail sales, homebuilder sentiment, and finally, the improvement in the Citi Economic Surprise Index.

See today’s post-market Closer and everything else Bespoke publishes by starting a 14-day free trial to Bespoke Institutional today!
Sentiment Still Bearish But That’s A Good Sign
In last Thursday’s Chart of the Day, we noted that AAII‘s sentiment survey saw a sharp bearish turn as the percentage of investors reporting as bears saw the fourth largest increase in the history of the survey. This week, sentiment saw modest improvements but continues to have a bearish bias. Bullish sentiment was up modestly to 23.18% from 21.66% last week. At this level, bullish sentiment is still over a standard deviation below the historical average.
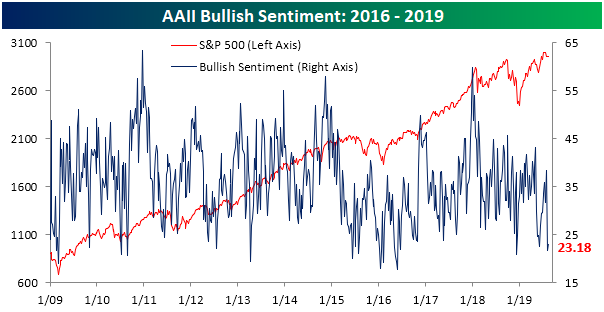
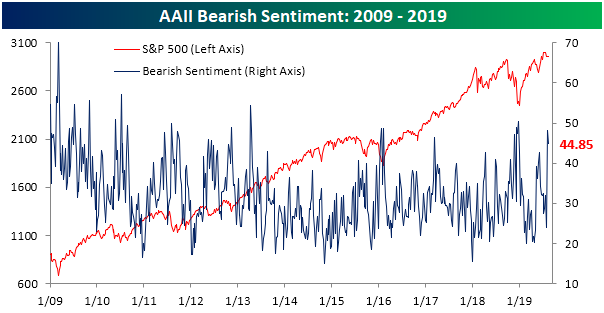
Bearish sentiment saw a larger move declining 3.3% to 44.85%. Like bullish sentiment, this move did little in regards to changing where the sentiment reading sits relative to history. Bearish sentiment remains at an extreme of over 1 standard deviation above the historical average.
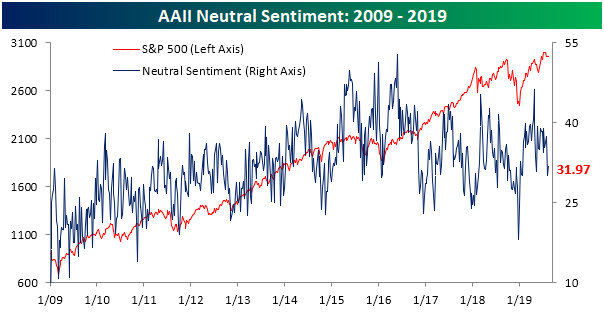
The losses in bearish sentiment did not entirely go to the bullish camp. 31.97% of investors reported neutral sentiment, which was up 1.82% from last week. While this is well below the low end of the past few months’ range, neutral sentiment is now only 0.45 percentage points above its historical average.
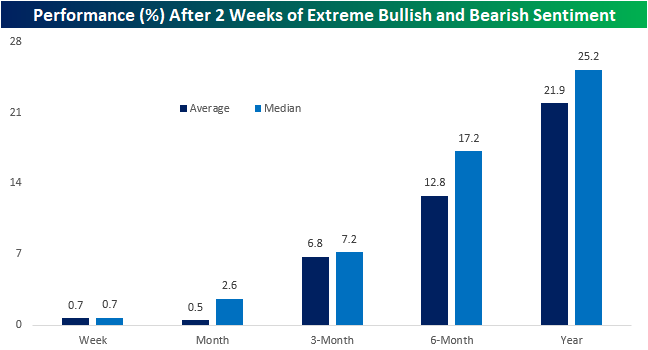
Both bullish and bearish sentiment readings were at a historical extreme (over 1 standard deviation away from the historical average) for the second week in a row. The last time this was observed was during the first week of June after May equity market declines. Typically, these can be taken as a contrarian bullish sign. In the past, there have been 16 other times that bearish sentiment was over 1 standard deviation above its average while bullish sentiment was over 1 standard deviation below its historical average for two consecutive weeks. As shown below, both average and median performance for the S&P 500 have been very strong in the weeks and months after with the S&P 500 moving higher over 80% of the time across each of these periods. Start a two-week free trial to one of Bespoke’s premium memberships to get our best investor research.
We Won’t
Below is a re-post of part of our Closer report (available to Bespoke Institutional members) from August 14th.
We have not been big fans of most major tech IPOs so far this year. Uber’s IPO (UBER) has been a pretty big failure so far: in addition to pricing at the bottom of its range and way below expectations in the lead-up to marketing, the stock has dropped 25% since. WeWork (WE) looks much worse. The company spends about 80% of total revenues operating its coworking spaces, with two-thirds of revenues going to expenses related to new office openings. Another 43% of revenues go to other pre-tax expenses.
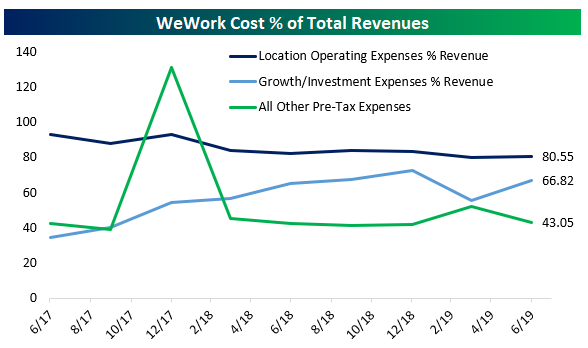
As a result, the company’s pre-tax margin is –79%, with operating margins of –90%! Even adjusted EBITDA margins are hugely negative: -36.8%.
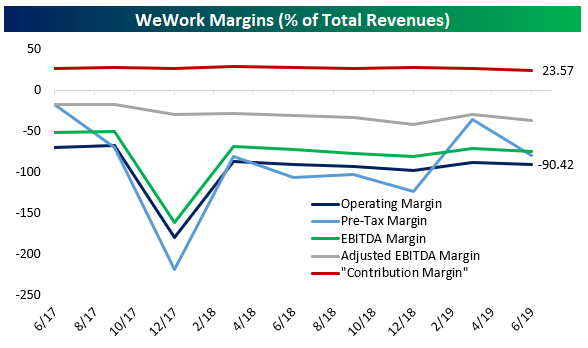
The metric the company claims is its economically relevant performance statistic is “contribution margin” which excludes location start-up costs, non-core operating expense, all sales and marketing costs, all growth/new development investments, all general and administrative expense, all depreciation and amortization, and all stock-based compensation. This is about as close to “earnings before everything” as you can get and is completely ludicrous as a way to judge a business’s costs; we strongly urge readers to evaluate the business by other, more traditional metrics that reflect total costs, growth funding, and liabilities to shareholders.
This analysis of course leaves aside the massive concerns elsewhere in the S1: self-dealing involving properties the CEO owns, possible securities law breaches, hideous financial and legal entity complexity, lease obligations north of $34bn (although a more modest $18.5bn at discounted present value), and an extremely shareholder unfriendly governance structure that concentrates massive power with the CEO. While WeWork (WE) may survive as a company, it contains a massive host of risks that are suitable for only a very narrow range of investors, if anyone; there are many, many companies out there that don’t throw up an almost comical forest of red flags. This analysis was originally published in our nightly Closer report on August 14th. Start a two-week free trial to Bespoke Institutional to access The Closer and the rest of Bespoke’s suite of Institutional products.
Fund Flows Remain Feeble
Yesterday, the Investment Company Institute updated its weekly report on the net cash available to mutual funds. These flows of cash in and out of the mutual fund industry have tilted very hard against the equity market in recent months, and that didn’t change much this week. While domestic, large cap equity funds had a pretty decent week ($1.46bn in net buying, larger than 92.9% of weeks since 2007), other categories were extremely weak. Similarly, equity-correlated fixed income in the high yield space saw massive $3.26bn outflows, weaker than 97% of weeks since 2007. Fixed income in general, though, continued to show massive inflows including $2.44bn into municipal bond funds. That’s in the 99th percentile of all periods, while rolling 4 week and 13 week fund flows are in the 97th percentile of all periods. Start a two-week free trial to Bespoke Institutional to access The Closer and the rest of Bespoke’s suite of Institutional products.
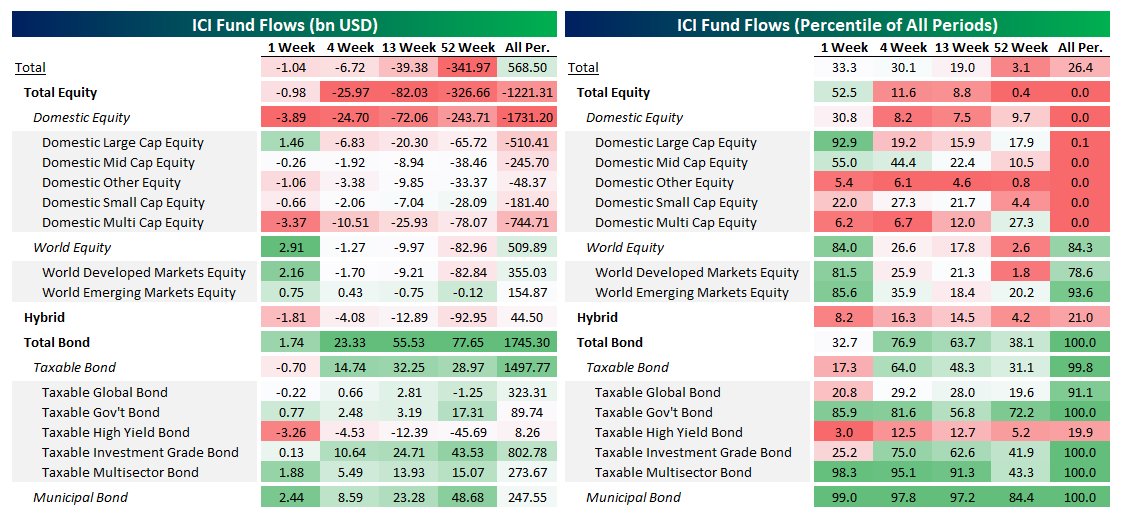
Below we show the rolling 13 week fund flows into various types of equity mutual funds since 2007. Only one week since 2015 has seen mutual fund flows into equities positive on a rolling 13 week basis. That’s obviously driven in large part by ETFs stealing market share but even by the standards of the last few years, investor flows into mutual funds have been very, very weak. It’s hard to call market sentiment excessive when retail is so desperately avoiding equity mutual fund allocations.
Jobless Claims Back Up
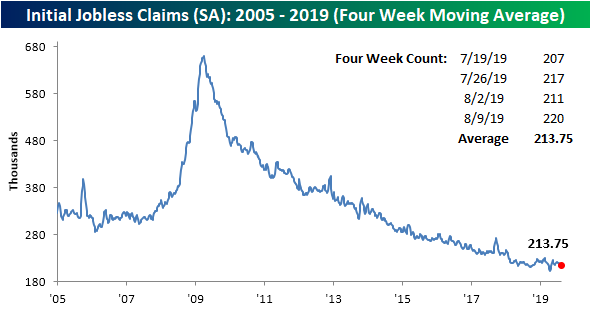
In addition to last week’s original print of 209K being revised up to 211K, this week’s initial jobless claims came in a bit weaker than expectations of 214K, rising to 220K. This brings the seasonally adjusted indicator back towards the middle of the past year’s range after it has remained at the lower end of that same range for most of the summer. Claims are now at the highest level since the last week of June when they read 222K. While not an improvement, this week’s data was also not any significant worsening. In fact, the record streaks at or below 250K and 300K continue to grow now at 97 and 232 weeks, respectively.
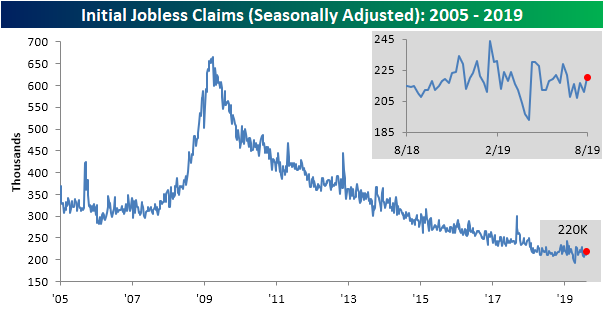
As we have repeatedly mentioned recently, labor data is still by all means at healthy levels but has not been improving at the same rate that it has for most of the cycle. This continues to be evident in the four-week moving average which rose 1K this week to 213.75K. This was the third consecutive week with an increase in the moving average. Granted the degree of these increases has been no larger than 1K!
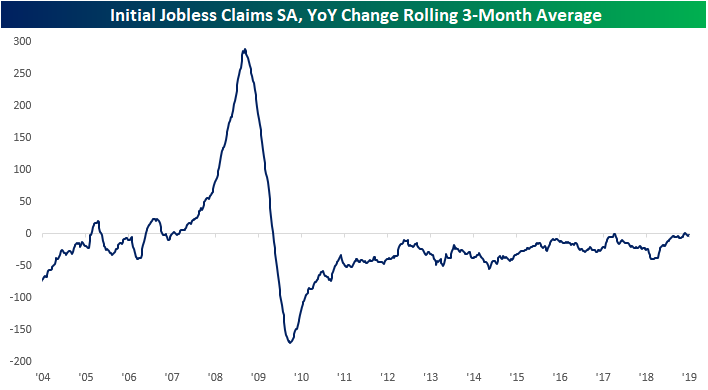
While it still has generally been moving lower, the degree of change (on a year-over-year basis) of claims has not been large. The most the moving average has improved by in the past three months was a 7K YoY drop at the end of May whereas most weeks of the current cycle have seen a double-digit decline YoY. We expand on this dynamic in the chart below showing the rolling 3 month average YoY change in the level of seasonally adjusted data. As shown, the size of that average change has shrunk in the past year.
On a non-seasonally adjusted basis, claims moved higher to 186K from 179.9K last week. While healthily below the average for this week of the year of 288.75K, this is a higher value than the comparable week last year (180K).
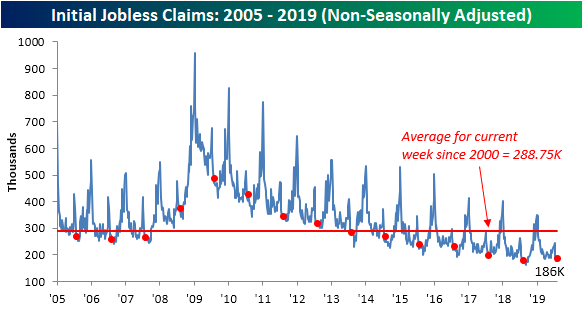
This marked the 12th YoY uptick in NSA claims in 2019. Similarly, for the SA data, it was also the 12th week with a YoY increase. Despite having a few months left this year, 2019 has seen the highest frequency of weeks with YoY increases in claims since the financial crisis. While claims remain extremely low by historical standards, it’s likely that somewhere around 200k is the ultimate floor. Start a two-week free trial to Bespoke Institutional to access our interactive economic indicators monitor and much more.

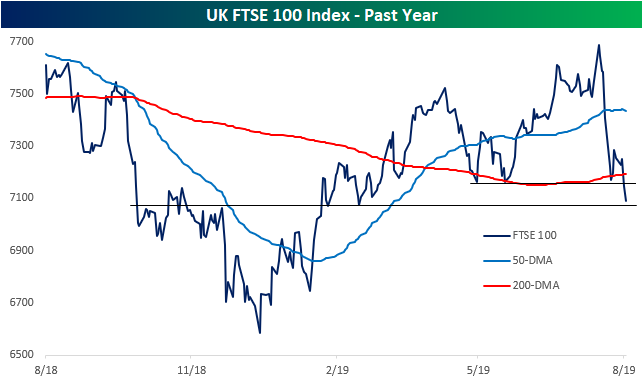
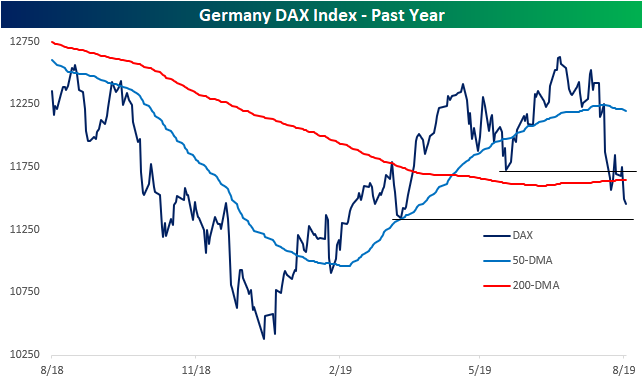
UK and German Equities Break Down
Whereas major US equity indices have yet to distinctively see any significant breakdown below recent support, the same cannot be said for European indices. Both the UK’s FTSE 100 Index and Germany’s DAX Index have fallen sharply from their recent highs at the end of July. This week’s declines have caused key support levels to break, and the uptrends that were in place over the past six months are now completely gone. Start a two-week free trial to Bespoke Institutional to access our interactive Security Analysis tool, Chart Scanner, and much more.