Brunch Reads – 8/24/25
Welcome to Bespoke Brunch Reads — a linkfest of some of our favorite articles over the past week. The links are mostly market-related, but there are some other interesting subjects covered as well. We hope you enjoy the food for thought as a supplement to the research we provide you during the week.
The Walls Kept Tumbling Down: On the morning of August 24, 79 CE, life in the Roman towns of Pompeii and Herculaneum began like any other summer day. Merchants opened their shops, farmers tended their fields, and families prepared meals. But by midday, Mount Vesuvius, long thought to be just another mountain, erupted. A towering column of ash, pumice, and noxious gases shot twelve miles upward, more than twice the height of Mount Everest, darkening the daylight and raining fragments onto the towns below.
In Pompeii, streets quickly filled with debris as terrified citizens tried to flee. Roofs collapsed under the weight of falling pumice, and those who stayed behind struggled to breathe in the thickening air. Across the bay in Herculaneum, many believed they were safer, but hours later, superheated pyroclastic surges swept down the volcano’s flanks at speeds up to 70 miles per hour. The waves of ash, gas, and molten rock buried the town instantly, sealing its people in place.
By dawn the next day, both cities lay under about 16 feet of volcanic material. Pompeii was smothered in ash, and thousands died, frozen in plaster-like casts of their final moments. What had been bustling Roman communities were erased in less than 24 hours, only to be rediscovered nearly 1,700 years later. It is one of the most visited sites in the world today, as the ruins were preserved exactly as the people and buildings had been left.

AI & Technology
Brace for a crash before the golden age of AI (Financial Times)
Big Tech is pouring unprecedented sums ($750 billion this year and next from just four companies) into data centers to fuel AI, yet history suggests these spending frenzies often end in crashes before real gains arrive. Scholar Carlota Perez frames AI as part of a familiar cycle: a manic installation phase marked by bubbles and upheaval, which eventually lays the groundwork for broader prosperity. What’s different now is the software-driven scale of AI, the global reach of tools like ChatGPT, and the open question of whether today’s giants can capture the long-term rewards, or if instability, debt, and political fractures derail the path to a golden age. [Link]
Continue reading our weekly Brunch Reads linkfest by logging in if you’re already a member or signing up for a trial to one of our two membership levels shown below! You can cancel at any time.

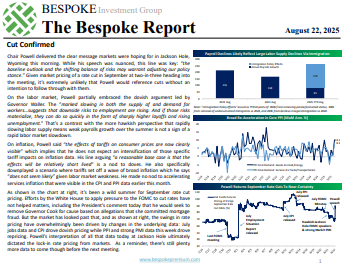
The Bespoke Report – 8/22/25 – Cut Confirmed
To read our weekly Bespoke Report newsletter and access everything else Bespoke’s research platform offers, start a two-week trial to Bespoke Premium. This week, Fed Chair Powell signaled a cut is almost a given at the next FOMC meeting. His embrace of dovish arguments on both the labor markets and inflation drove a massive rally in stocks to end the week, both in the US and Europe. Other markets are also performing well with investment grade corporate bonds trading at a record low risk premium this week. We also discuss earnings, AI stocks, custom baskets of stocks that tease out market narratives, and more in this week’s report. Give it a read!

A Whipsaw Week
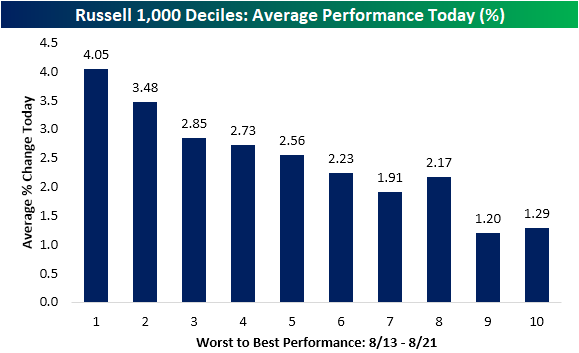
The first part of this week was driven by rotation out of the year’s winners into the year’s losers. Fast forward to Friday with Fed Chair Powell hinting at rate cuts in September, everything reversed. As shown below, breaking the Russell 1,000 into deciles (ten equal sized groups of 100 index members), today’s best performers were those that had been the worst performers from August 13th through yesterday’s close. The 100 stocks down the most from 8/13-8/21 gained over 4% today on average. Conversely, the deciles of the best performers from 8/13-8/21 still averaged gains today, but they were much weaker at just over 1%.
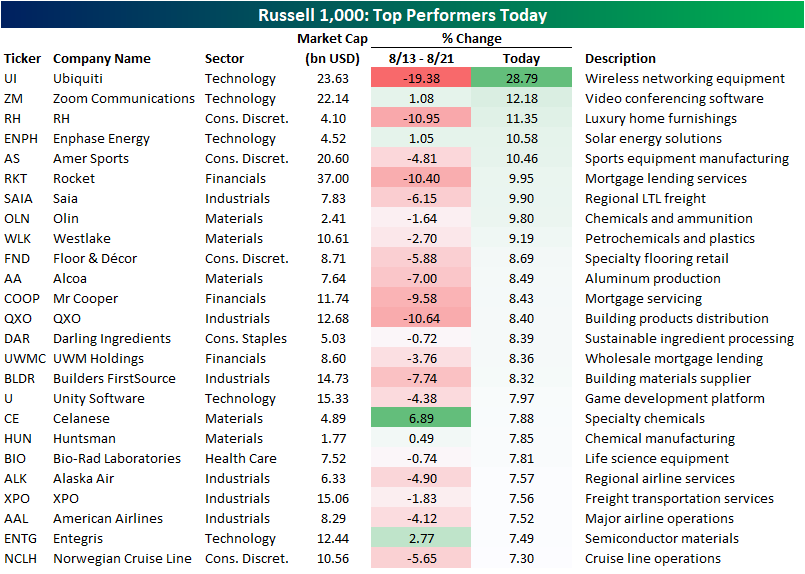
In the table below, we show the 25 best performing stocks in the Russell 1,000 today. As shown, wireless networking equipment maker Ubiquiti (UI) is experiencing the single largest gain of any stock in the index, up 28.8%. The stock’s surge comes after reporting a top and bottom line beat this morning with the announcement of a stock buyback and cash dividend. Earnings aside, the stock was a big decliner in the days prior, having fallen almost 20% since August 13. The next largest gain was another earnings story as Zoom Communications (ZM) rose 12.18% on its own top and bottom line beat.
On average, the stocks up the most today were down 4% from 8/13-8/21, with names like RH, Rocket (RKT), and QXO down 10%+ during this period. As Powell opened the door for another cut, many of the biggest gainers today were housing related or cyclical in nature. RH (RH) is a high-end home furnishing business whereas Rocket (RKT), Mr Cooper (COOP, and UWM (UWMC) represent mortgage lending. Homebuilder-adjacent names like Builders FirstSource (BLDR) and Floor & Decor (FND) likewise posted high-single digit gains today. Out of the transportation industry, travel and leisure names like Alaska Air (AIR) and Norwegian Cruises (NCLH) made the list in addition to logistics and goods transporters such as XPO (XPO).

The Triple Play Report — 8/22/25
An earnings triple play is a stock that reports earnings and manages to 1) beat analyst EPS estimates, 2) beat analyst sales estimates, and 3) raise forward guidance. You can read more about “triple plays” at Investopedia.com where they’ve given Bespoke credit for popularizing the term. We like triple plays as an indication that a company’s business is firing on all cylinders, with better-than-expected results and an improving outlook. A triple play is indicative of positive “fundamental momentum” instead of pure fundamentals, and there are always plenty of names with both high and low valuations on our quarterly list.
Bespoke’s Triple Play Report highlights companies that have recently reported earnings triple plays, and it features commentary from management on triple-play conference calls, company descriptions and analysis, and price charts. Bespoke’s Triple Play Report is available at the Bespoke Institutional level only. You can sign up for Bespoke Institutional now and receive a 14-day trial to read this week’s Triple Play Report, which features 28 new stocks. To sign up, choose either the monthly or annual checkout link below:
Bespoke Institutional – Monthly Payment Plan
Bespoke Institutional – Annual Payment Plan
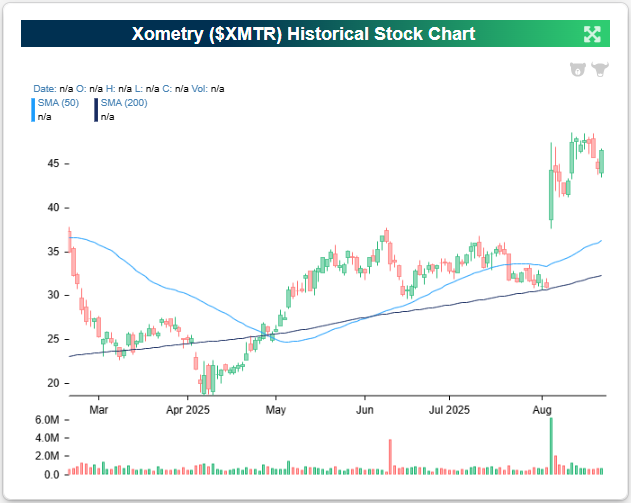
Xometry (XMTR) is an example of a company that recently reported an earnings triple play before the open on 8/5. On a streak of six EPS and revenue beats, this quarter’s triple play saw the stock 43% higher on the day. That rally brought the stock out of the red on the year, and it has since climbed another 10%. What a month it’s been for XMTR shareholders!
Here’s how AI describes the company: Xometry (XMTR) is a technology company that operates a global AI-powered marketplace for on-demand manufacturing, connecting businesses that need custom parts with a network of more than 4,300 suppliers. Its platform covers a wide range of processes, including CNC machining, 3D printing, injection molding, sheet metal fabrication, and urethane casting, making it a one-stop solution for industries such as aerospace, defense, automotive, medical devices, and robotics. The company differentiates itself by offering instant quoting, dynamic pricing algorithms, and supplier-matching tools that leverage machine learning to improve accuracy and speed in sourcing. For enterprises, Xometry provides software integrations like Teamspace, which enables collaborative procurement across organizations, and Workcenter, a cloud-based platform that helps suppliers manage workflow, capacity, and payments. Through its asset-light model, Xometry addresses inefficiencies in the traditionally fragmented and offline manufacturing market, helping buyers diversify supply chains and reduce costs while allowing small and mid-sized manufacturers to monetize excess capacity and reach new customers globally.
XMTR turned in a strong Q2, with revenue up 23% from last year to $163 million, led by 26% growth in its core marketplace and a 31% jump overseas. The customer base keeps expanding, with nearly 75,000 active buyers, up 22%, and more large accounts spending above $50,000 annually. Profitability improved as well, with gross margin climbing to a record 40.1%, helped by smarter AI-driven pricing and new tools that speed up quoting and order processing. Recent product rollouts included instant quotes for new materials, a system that reads technical drawings automatically, and the launch of Teamspace in Europe, which makes it easier for teams to manage projects together. Suppliers also got a lift from a new mobile app that lets them track jobs and share updates more easily. Growth came across industries like aerospace, defense, automotive, and robotics, with a major European aerospace firm choosing Xometry as a preferred supplier, an account that could generate over $10 million annually. Management pointed out that marketplace margins have steadily climbed over the past four years, showing how scale and data continue to strengthen the model.
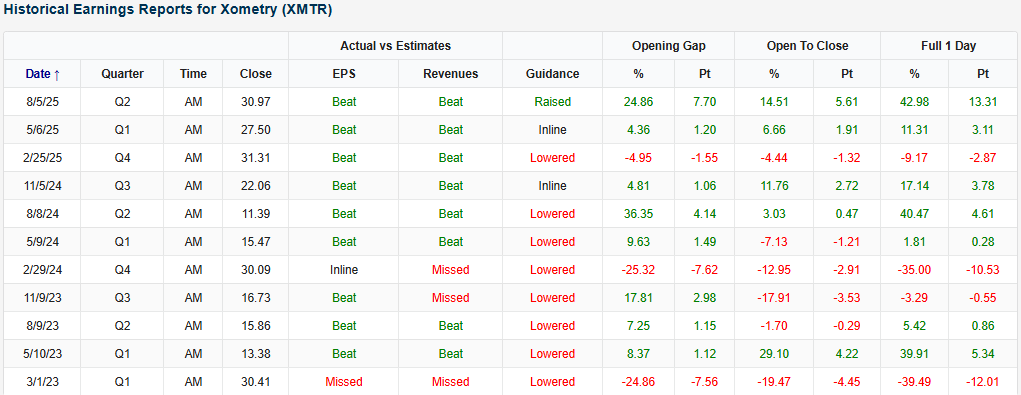
Looking at the snapshot below from our Earnings Explorer, Xometry (XMTR) reported its first triple play after a string on lower guidance. A 40% pop for the stock post-earnings isn’t totally new for XMTR, but it’s an impressive swing nonetheless. Beat rates have also been strong the last several quarters, a positive sign that the stock is on the right track.
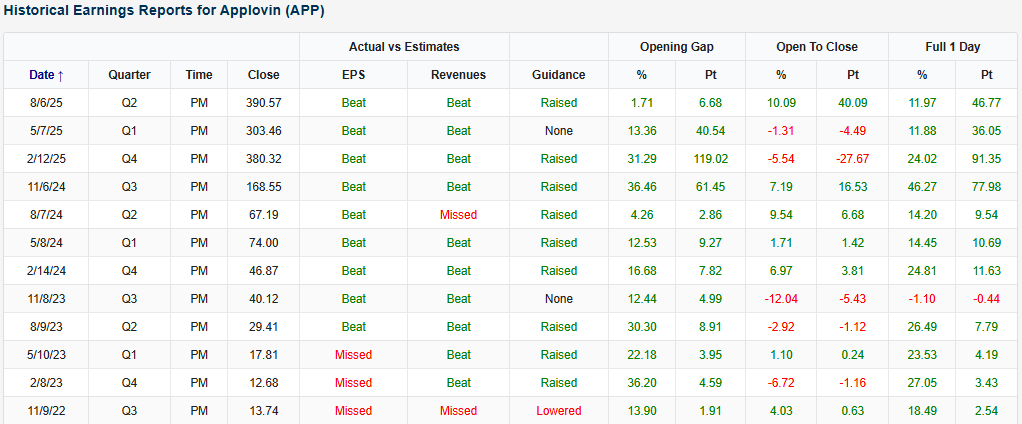
As a bonus to this installment of the Triple Play Report, we’d like to point out a hard-hitting stat from one of the Triple Play stocks found within today’s report. Advertisement technology company Applovin (APP) has gained more than 10% on each of its last seven earnings reaction days and 11 of its last 12. We can’t think of another stock that has done this. These massive moves higher on basically every earnings report in the last couple years is one reason why it has been a 10-bagger since the start of 2024!
You can read more about XMTR, APP, and the 26 other triple plays we covered in our newest report by starting a Bespoke Institutional trial today.
Bespoke Investment Group, LLC believes all information contained in these reports to be accurate, but we do not guarantee its accuracy. None of the information in these reports or any opinions expressed constitutes a solicitation of the purchase or sale of any securities or commodities. This is not personalized advice. Investors should do their own research and/or work with an investment professional when making portfolio decisions. As always, past performance of any investment is not a guarantee of future results. Bespoke representatives or clients may have positions in securities discussed or mentioned in its published content.
NVIDIA (NVDA), Microsoft (MSFT) Charts
As the two largest companies in the world, NVIDIA (NVDA) and Microsoft (MSFT) account for more than 15% of the S&P 500. Needless to say, their performance and the way they’re trending has a big impact on the overall market.
Below is a check-up on their price charts, both short-term and long-term.
While the market is rallying sharply as of mid-day Friday following Fed Chair Powell’s Jackson Hole commentary that has so far been interpreted as dovish, the price action in the two biggest mega-caps hasn’t been great recently.
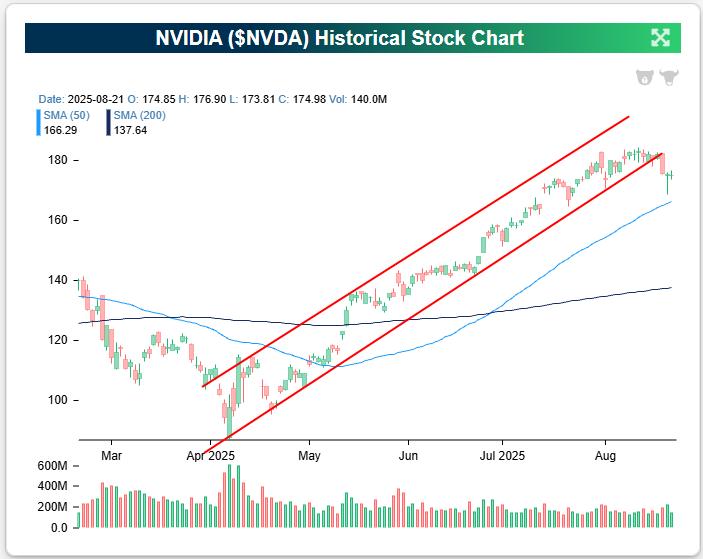
As shown below, both NVDA and MSFT had been trading in just about the tightest uptrend channels you could ask for in the months leading up to August, but those uptrends are now broken. The sellers were finally able to break the backs of the bulls this month just as we’re entering what has historically been the weakest month of the year from a seasonal perspective (September).
The broken uptrend for NVIDIA (NVDA) also comes just ahead of its Q2 earnings report due out next Wednesday (8/27) after the close.

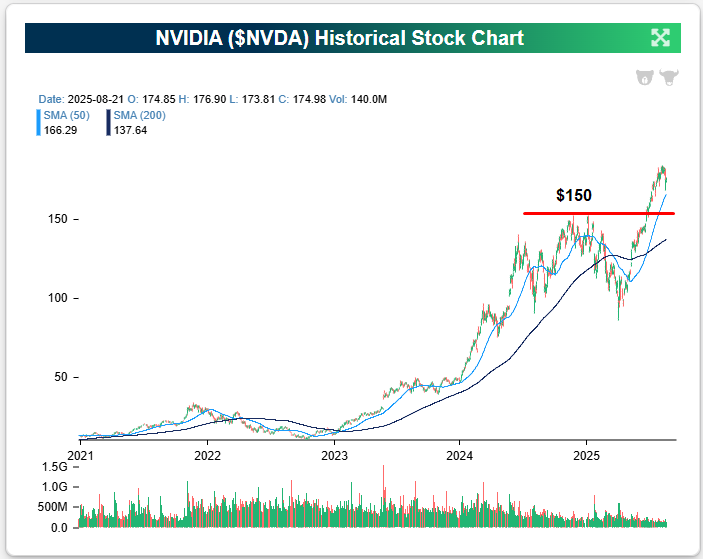
We don’t need to provide any more superlatives about the gains that both NVDA and MSFT have seen over the last five years, but a look at their long-term price charts can be helpful for identifying support levels should their short-term weakness turn into something deeper.
For NVIDIA (NVDA), its first big long-term support level is at $150, which represents its prior highs made at the end of 2024. That support is about $25 below where NVDA was trading coming into today.
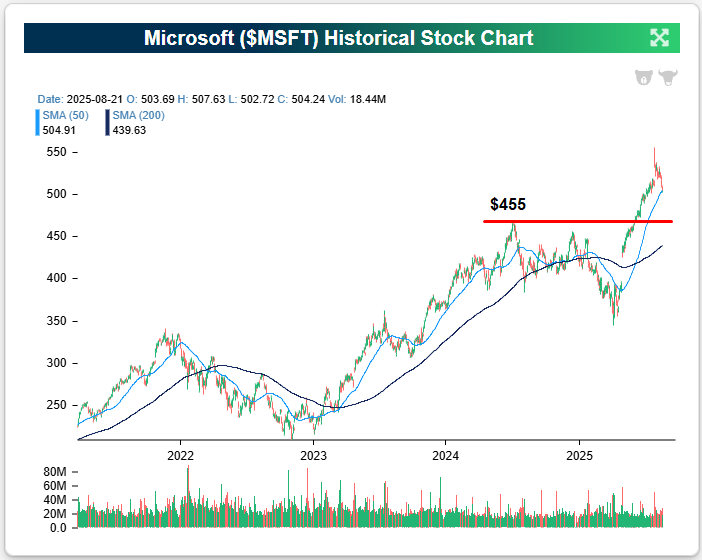
For Microsoft (MSFT), its first major support level to keep an eye on is $455; also represented by its 2024 highs made last July. MSFT came into today trading a few dollars above $500/share, so a drop to support at $455 would represent a decline of about 10%.
We provide chart analysis of individual stocks and ETFs on a daily basis for Bespoke Premium subscribers. We also have unique charting tools available for subscribers like our Chart Scanner and Trend Analyzer. If you’ve never tried it out, we urge you to start a two-week Bespoke Premium trial today!

Bespoke’s Morning Lineup – 8/22/25 – Same Day of the Week, Different Sentiment
See what’s driving market performance around the world in today’s Morning Lineup. Bespoke’s Morning Lineup is the best way to start your trading day. Read it now by starting a two-week trial to Bespoke Premium. CLICK HERE to learn more and start your trial.
“There is winning and there is misery.” – Bill Parcells

Below is a snippet of commentary from today’s Morning Lineup. Start a two-week trial to Bespoke Premium to view the full report.
Futures are modestly higher heading into the last session of the week as the S&P 500 looks to end a five-day losing streak. There’s no economic data on the calendar, so whether we can end this streak will likely depend entirely on Powell’s 10 AM Jackson Hole speech.
In Europe, stocks are modestly higher on little in the way of news besides German GDP for Q2 being revised down more than expected to a decline of 0.3% versus forecasts for a decline of 0.1%.
In Asia, equities finished off a mixed week with a mixed session. Japan’s Nikkei finished slightly higher but down over 1% for the week. Chinese stocks were up over 1%, taking the weekly gain to more than 3%, while India traded down 0.9% on Friday but still managed to finish the week up nearly 1%. The main story out of the region was in China where Nvidia (NVDA) has reportedly stopped sales of its H20 chip to Chinese customers after that country’s government told local tech companies not to buy the chips citing security concerns. In response to the news, Chinese semiconductor names traded sharply higher.
It’s only been a week, but the general market tone heading into this Friday’s session is different than last Friday. For starters, we’re not sure where you are, but in the New York area, last Friday’s morning temperature was around 80 degrees, but this morning, we’re looking at a fall-like temperature of 58 degrees as we type this. In the equity market, last Friday, the S&P 500 was coming off its 3rd record closing high in a row and its 13th record high of the quarter. A rate cut at the next Fed meeting in September was pretty much a done deal.
Today, things look a lot less certain, the market is now pricing in just a 70% chance of a cut at the September meeting, and ahead of his Jackson Hole speech at 10 AM this morning, he probably won’t rule it out, but it doesn’t feel like Powell will make a forceful case to cut rates. With all the increased uncertainty, we’ve gone from a market closing at record highs to a 5-day losing streak that is tied for the longest since April 2024.
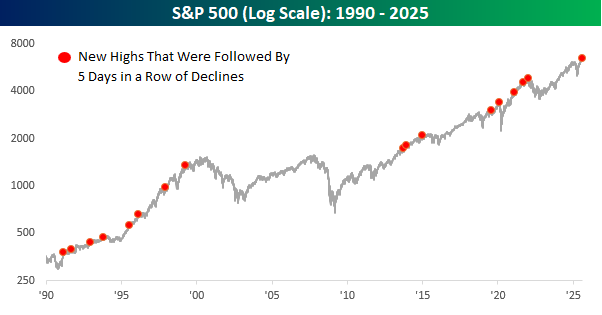
The last time the S&P 500 closed at a record high and then fell for five straight days was in January 2022 right at the start of the last bear market. There was also an occurrence right around the pre-Covid peak, and another near the dot-com peak in 2000. Any time you can make a connection between the current market and those three periods, it’s an ominous signal. Don’t they say that tops are a process? These all sound like pretty quick reversals!
Looking at ALL the occurrences where the S&P 500 hit a new high and then immediately went into a five-day losing streak, though, shows that there were plenty of occurrences within much longer-term bull markets.
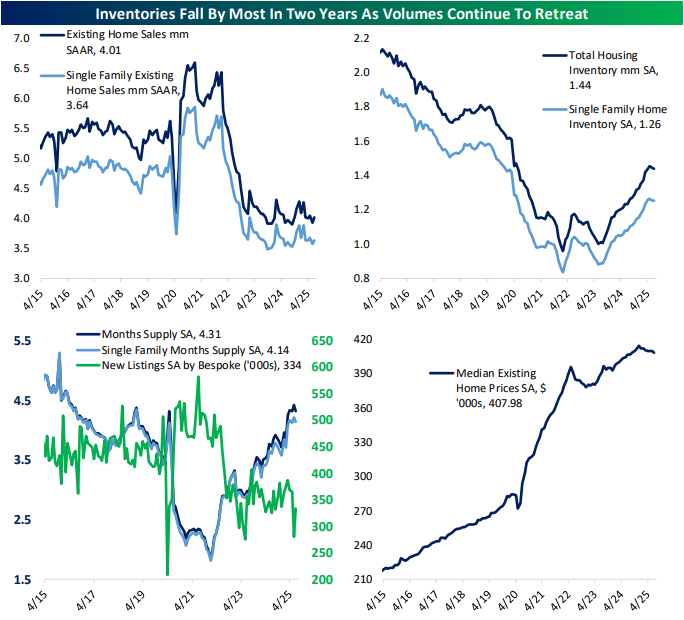
The Closer – Manufacturing Rebound, Claims Demographics, Home Sales – 8/21/25
Log-in here if you’re a member with access to the Closer.
Looking for deeper insight into markets? In tonight’s Closer sent to Bespoke Institutional clients, we begin with a rundown on the latest earnings reports and macro themes coming out of those earnings and Jackson Hole (page 1). Next, we check in on manufacturing PMIs (pages 2 and 3) before pivoting over to claims data (pages 3 – 5). We round out tonight’s report with an update on existing home sales (page 6).
See today’s full post-market Closer and everything else Bespoke publishes by starting a 14-day trial to Bespoke Institutional today!
Q2 2025 Earnings Conference Call Recaps: Walmart (WMT)
Bespoke’s Conference Call Recaps use AI to summarize lengthy earnings calls. The commentary below is AI-generated and then edited by Bespoke for quality control. As always, none of these summaries should be construed as recommendations to buy or sell any securities, and investors should do their own research and/or consult with a financial professional before making any investment decisions.
Our latest recap available to Bespoke subscribers covers Walmart’s (WMT) Q2 2026 earnings call.
![]()
Walmart (WMT) is the world’s largest retailer, operating supercenters, neighborhood markets, Sam’s Club warehouses, and a rapidly growing e-commerce platform. It serves over 250 million customers weekly across the US and 18 countries, offering everything from groceries and apparel to electronics and pharmaceuticals. Walmart posted 5.6% constant-currency sales growth, driven by 26% US e-commerce growth, a 6% Sam’s Club comp, and 10.5% international growth (China +30%, Walmex +6%). Delivery speed is a standout: one-third of orders arrived in under 3 hours, 20% in under 30 minutes. Tariffs remain a headwind, yet Walmart expanded rollbacks to 7,400 items, up nearly 2,000 from Q1, with grocery rollbacks up 30%. Consumer resilience was mixed: higher-income households fueled share gains, while middle and lower-income cohorts traded down. Advertising revenue surged 46% globally, membership income rose 15%, and the marketplace grew 17%. AI dominated discussion, with “Sparky” and other super-agents set to transform shopping, associates’ work, and supplier tools. On mixed results, WMT shares tumbled more than 5% on 8/21…
Continue reading our Conference Call Recap for WMT by becoming a Bespoke Institutional subscriber. You can sign up for Bespoke Institutional now and receive a 14-day trial to read our newest Conference Call Recap. To sign up, choose either the monthly or annual checkout link below:
Chart of the Day: Health Care, Sick Or Hearty?
Best and Worst: Be Careful What You Wish For
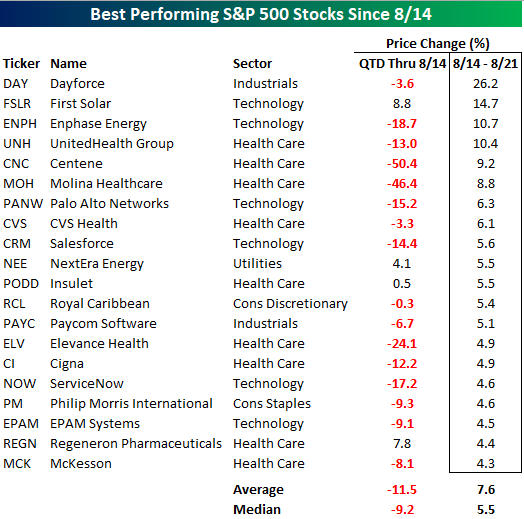
With the S&P 500 on pace for a five-day losing streak, several investors are probably looking at losses in their portfolios, and then looking over at the stocks that have been rallying and wondering why they don’t own those. One good answer is that outside of the last week, they were terrible! The table below lists the 20 best-performing stocks in the S&P 500 over the last week. Overall, the 20 stocks listed are up an average of 7.6% (median: 5.5%). At the sector level, nine of them come from the Health Care sector, and another six come from the Technology sector. The remaining five are spread out across four different sectors. What stands out, though, is that the 20 best-performing stocks over the last five days have been terrible performers so far in the quarter. From the end of June through 8/14, they declined an average of 11.5% (median: -9.2%), and only four were up. So, sure, owning them over the last week would have been nice, but you weren’t having a very good summer before the last five trading days.
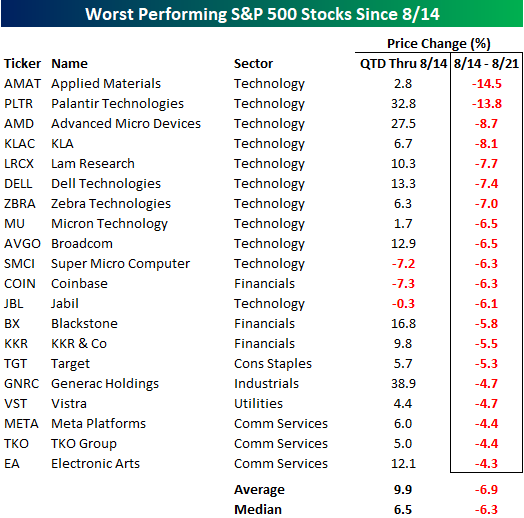
Conversely, the worst 20 performers since the S&P 500’s losing streak started had seen strong gains QTD through 8/14. As shown in the table below, their average gain was 9.9% (median: +6.5%), and only three were down. At the sector level, more than half of the worst performers over the last five trading days are all from the Technology sector, including the ten worst performers!